
|
|||||
|
 | |
| |
| |
| |
| |
| |
|
Gene: RPS3 |
Gene summary for RPS3 |
| Gene information | Species | Human | Gene symbol | RPS3 | Gene ID | 6188 |
| Gene name | ribosomal protein S3 | |
| Gene Alias | S3 | |
| Cytomap | 11q13.4 | |
| Gene Type | protein-coding | GO ID | GO:0000165 | UniProtAcc | P23396 |
Top |
Malignant transformation analysis |
| Identification of the aberrant gene expression in precancerous and cancerous lesions by comparing the gene expression of stem-like cells in diseased tissues with normal stem cells |
| Entrez ID | Symbol | Replicates | Species | Organ | Tissue | Adj P-value | Log2FC | Malignancy |
| 6188 | RPS3 | GSM4909281 | Human | Breast | IDC | 5.13e-05 | -1.06e-01 | 0.21 |
| 6188 | RPS3 | GSM4909286 | Human | Breast | IDC | 1.63e-66 | 2.87e-01 | 0.1081 |
| 6188 | RPS3 | GSM4909287 | Human | Breast | IDC | 6.06e-10 | -2.29e-01 | 0.2057 |
| 6188 | RPS3 | GSM4909293 | Human | Breast | IDC | 4.84e-48 | -2.61e-01 | 0.1581 |
| 6188 | RPS3 | GSM4909294 | Human | Breast | IDC | 2.76e-15 | -2.22e-01 | 0.2022 |
| 6188 | RPS3 | GSM4909296 | Human | Breast | IDC | 7.26e-14 | 1.56e-01 | 0.1524 |
| 6188 | RPS3 | GSM4909297 | Human | Breast | IDC | 8.12e-46 | -5.16e-01 | 0.1517 |
| 6188 | RPS3 | GSM4909298 | Human | Breast | IDC | 8.34e-59 | -3.56e-01 | 0.1551 |
| 6188 | RPS3 | GSM4909301 | Human | Breast | IDC | 3.09e-16 | -1.73e-01 | 0.1577 |
| 6188 | RPS3 | GSM4909306 | Human | Breast | IDC | 2.66e-12 | -1.55e-01 | 0.1564 |
| 6188 | RPS3 | GSM4909311 | Human | Breast | IDC | 1.05e-03 | -6.27e-02 | 0.1534 |
| 6188 | RPS3 | GSM4909312 | Human | Breast | IDC | 2.11e-15 | 1.66e-01 | 0.1552 |
| 6188 | RPS3 | GSM4909313 | Human | Breast | IDC | 1.58e-04 | 9.27e-02 | 0.0391 |
| 6188 | RPS3 | GSM4909315 | Human | Breast | IDC | 1.77e-14 | -2.18e-01 | 0.21 |
| 6188 | RPS3 | GSM4909317 | Human | Breast | IDC | 8.23e-26 | -3.20e-01 | 0.1355 |
| 6188 | RPS3 | GSM4909319 | Human | Breast | IDC | 4.80e-27 | -4.81e-01 | 0.1563 |
| 6188 | RPS3 | brca2 | Human | Breast | Precancer | 2.55e-20 | -1.71e-01 | -0.024 |
| 6188 | RPS3 | M1 | Human | Breast | IDC | 1.22e-04 | -1.44e-01 | 0.1577 |
| 6188 | RPS3 | NCCBC14 | Human | Breast | DCIS | 3.56e-14 | -3.83e-01 | 0.2021 |
| 6188 | RPS3 | NCCBC5 | Human | Breast | DCIS | 2.91e-04 | -2.31e-01 | 0.2046 |
| Page: 1 2 3 4 5 6 7 8 9 10 11 12 13 14 15 16 17 18 |
| Tissue | Expression Dynamics | Abbreviation |
| Breast | 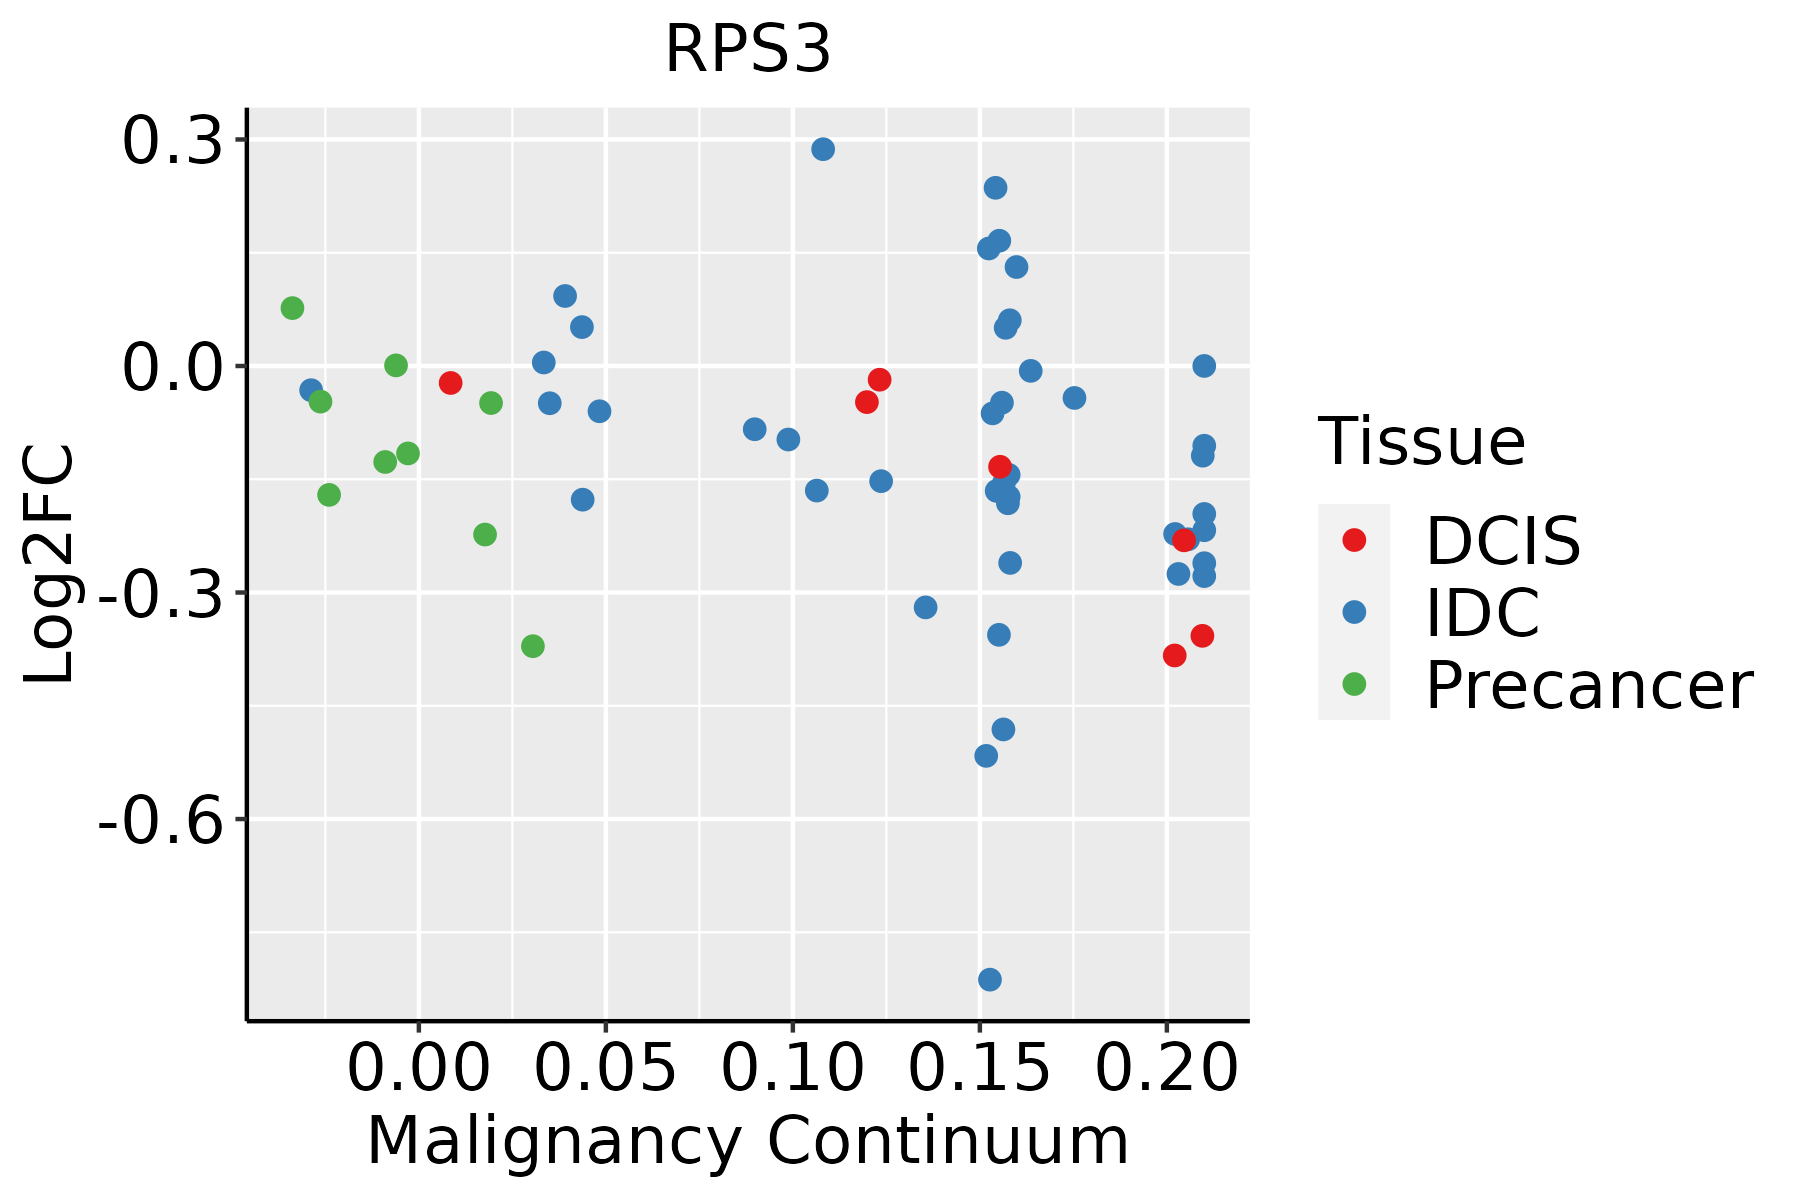 | IDC: Invasive ductal carcinoma |
| DCIS: Ductal carcinoma in situ | ||
| Precancer(BRCA1-mut): Precancerous lesion from BRCA1 mutation carriers | ||
| Cervix | 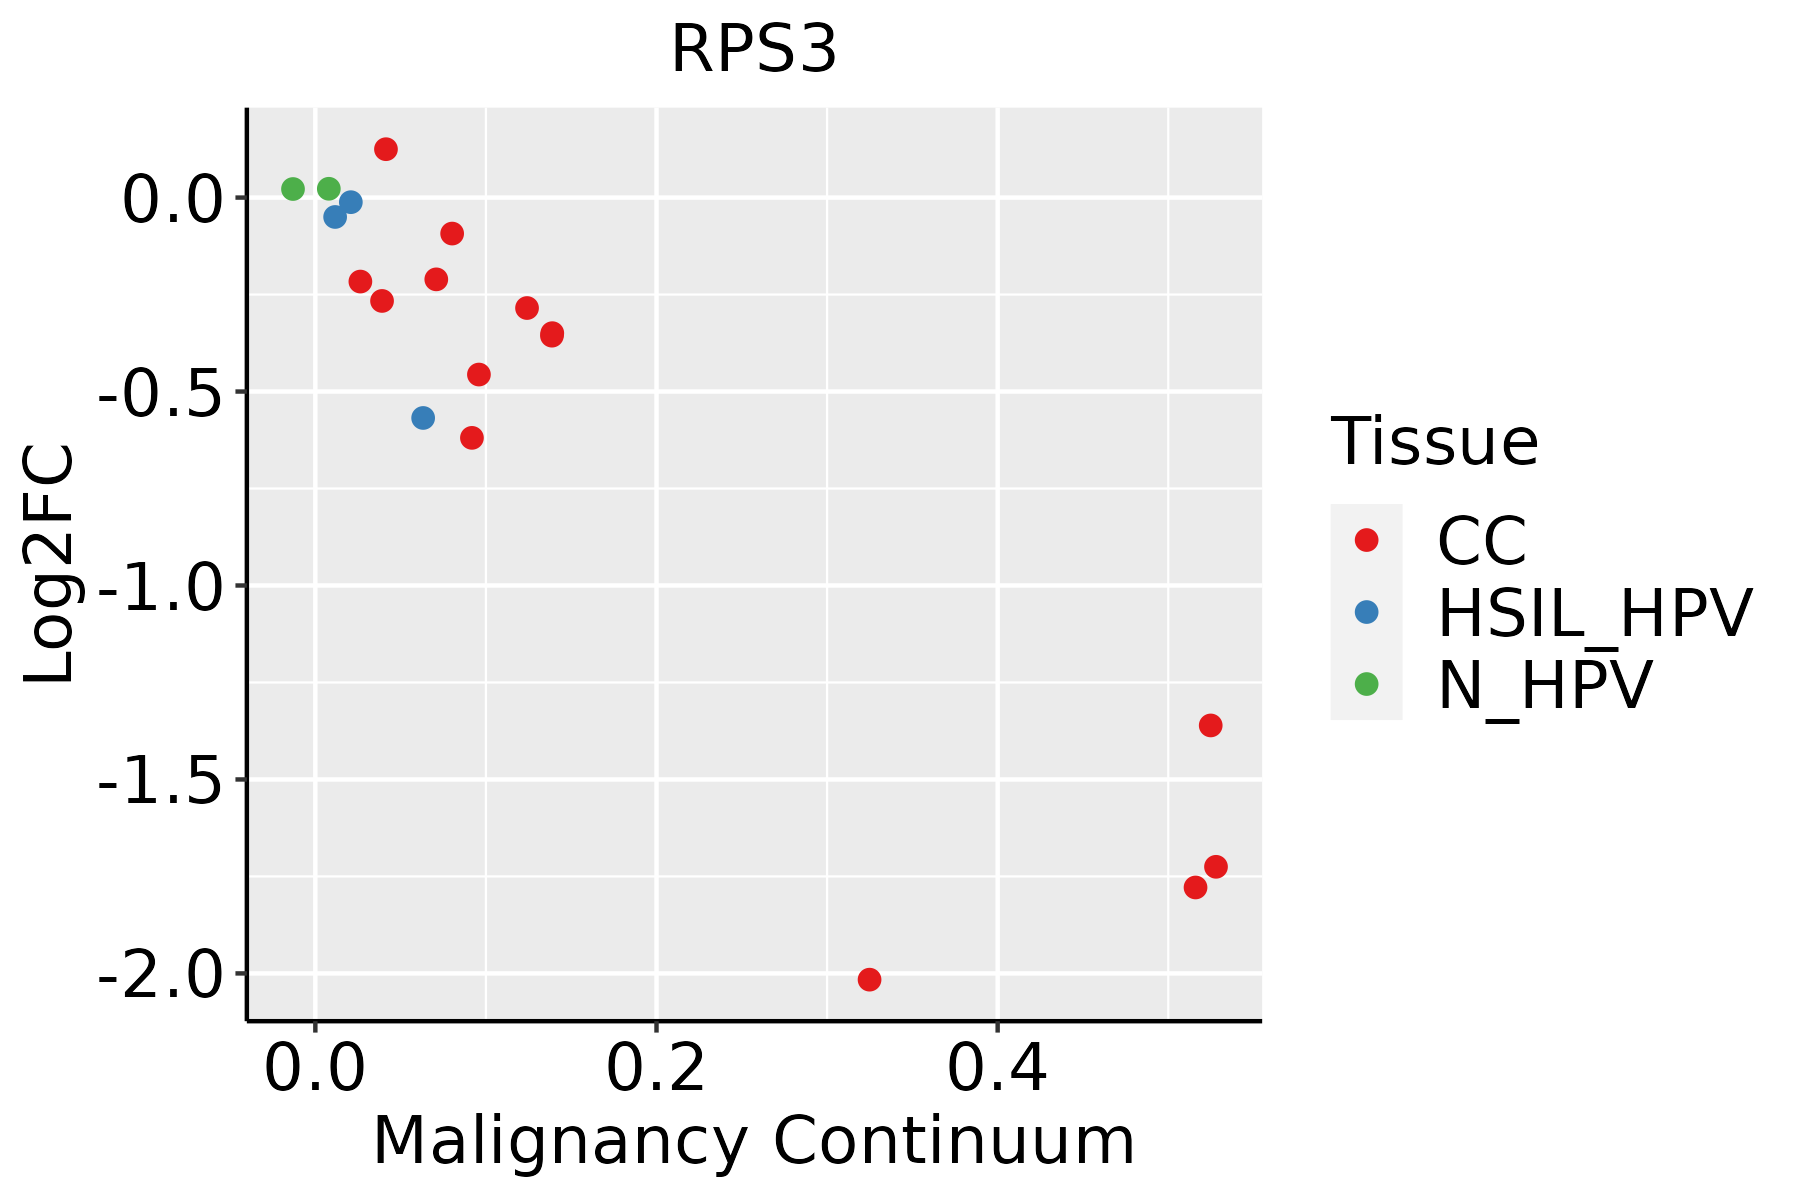 | CC: Cervix cancer |
| HSIL_HPV: HPV-infected high-grade squamous intraepithelial lesions | ||
| N_HPV: HPV-infected normal cervix | ||
| Colorectum (GSE201348) |  | FAP: Familial adenomatous polyposis |
| CRC: Colorectal cancer | ||
| Colorectum (HTA11) |  | AD: Adenomas |
| SER: Sessile serrated lesions | ||
| MSI-H: Microsatellite-high colorectal cancer | ||
| MSS: Microsatellite stable colorectal cancer | ||
| Endometrium |  | AEH: Atypical endometrial hyperplasia |
| EEC: Endometrioid Cancer | ||
| Esophagus | 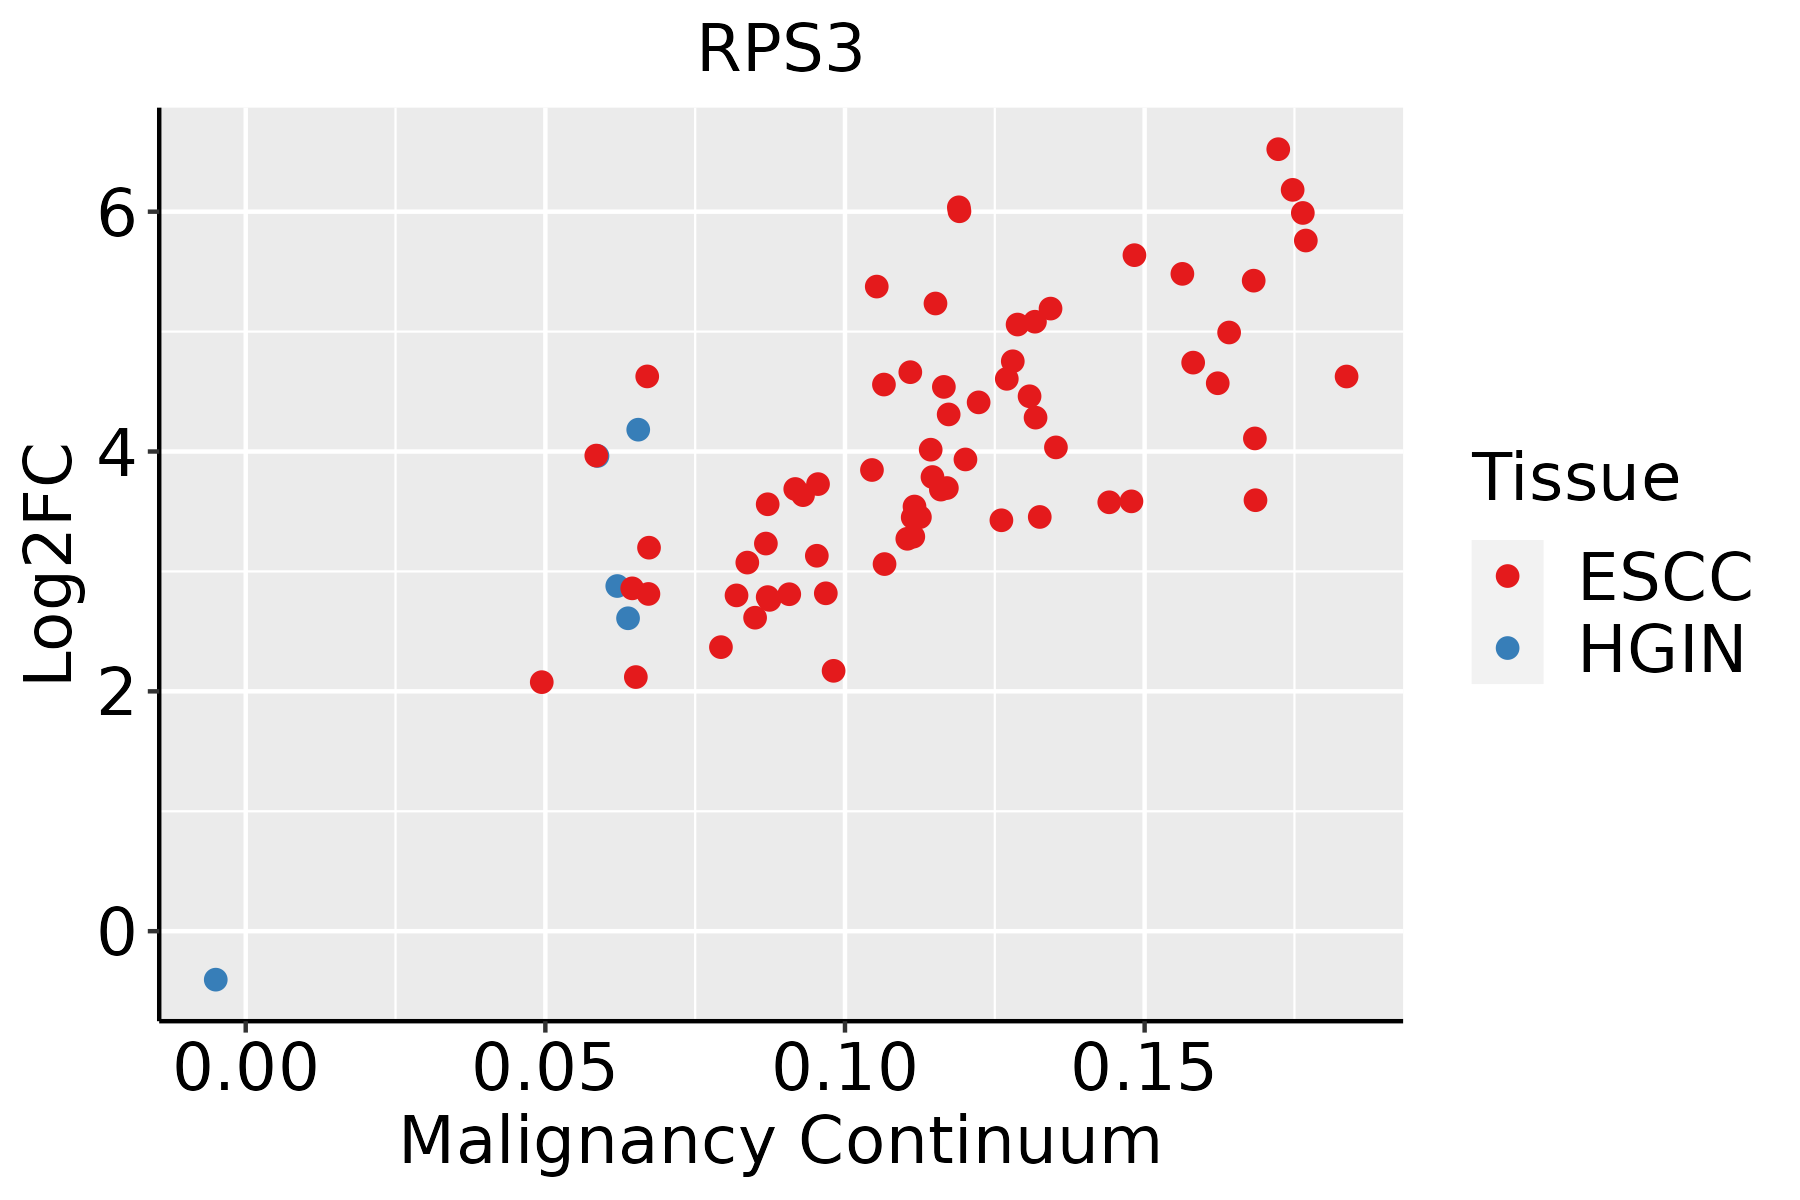 | ESCC: Esophageal squamous cell carcinoma |
| HGIN: High-grade intraepithelial neoplasias | ||
| LGIN: Low-grade intraepithelial neoplasias | ||
| Liver | 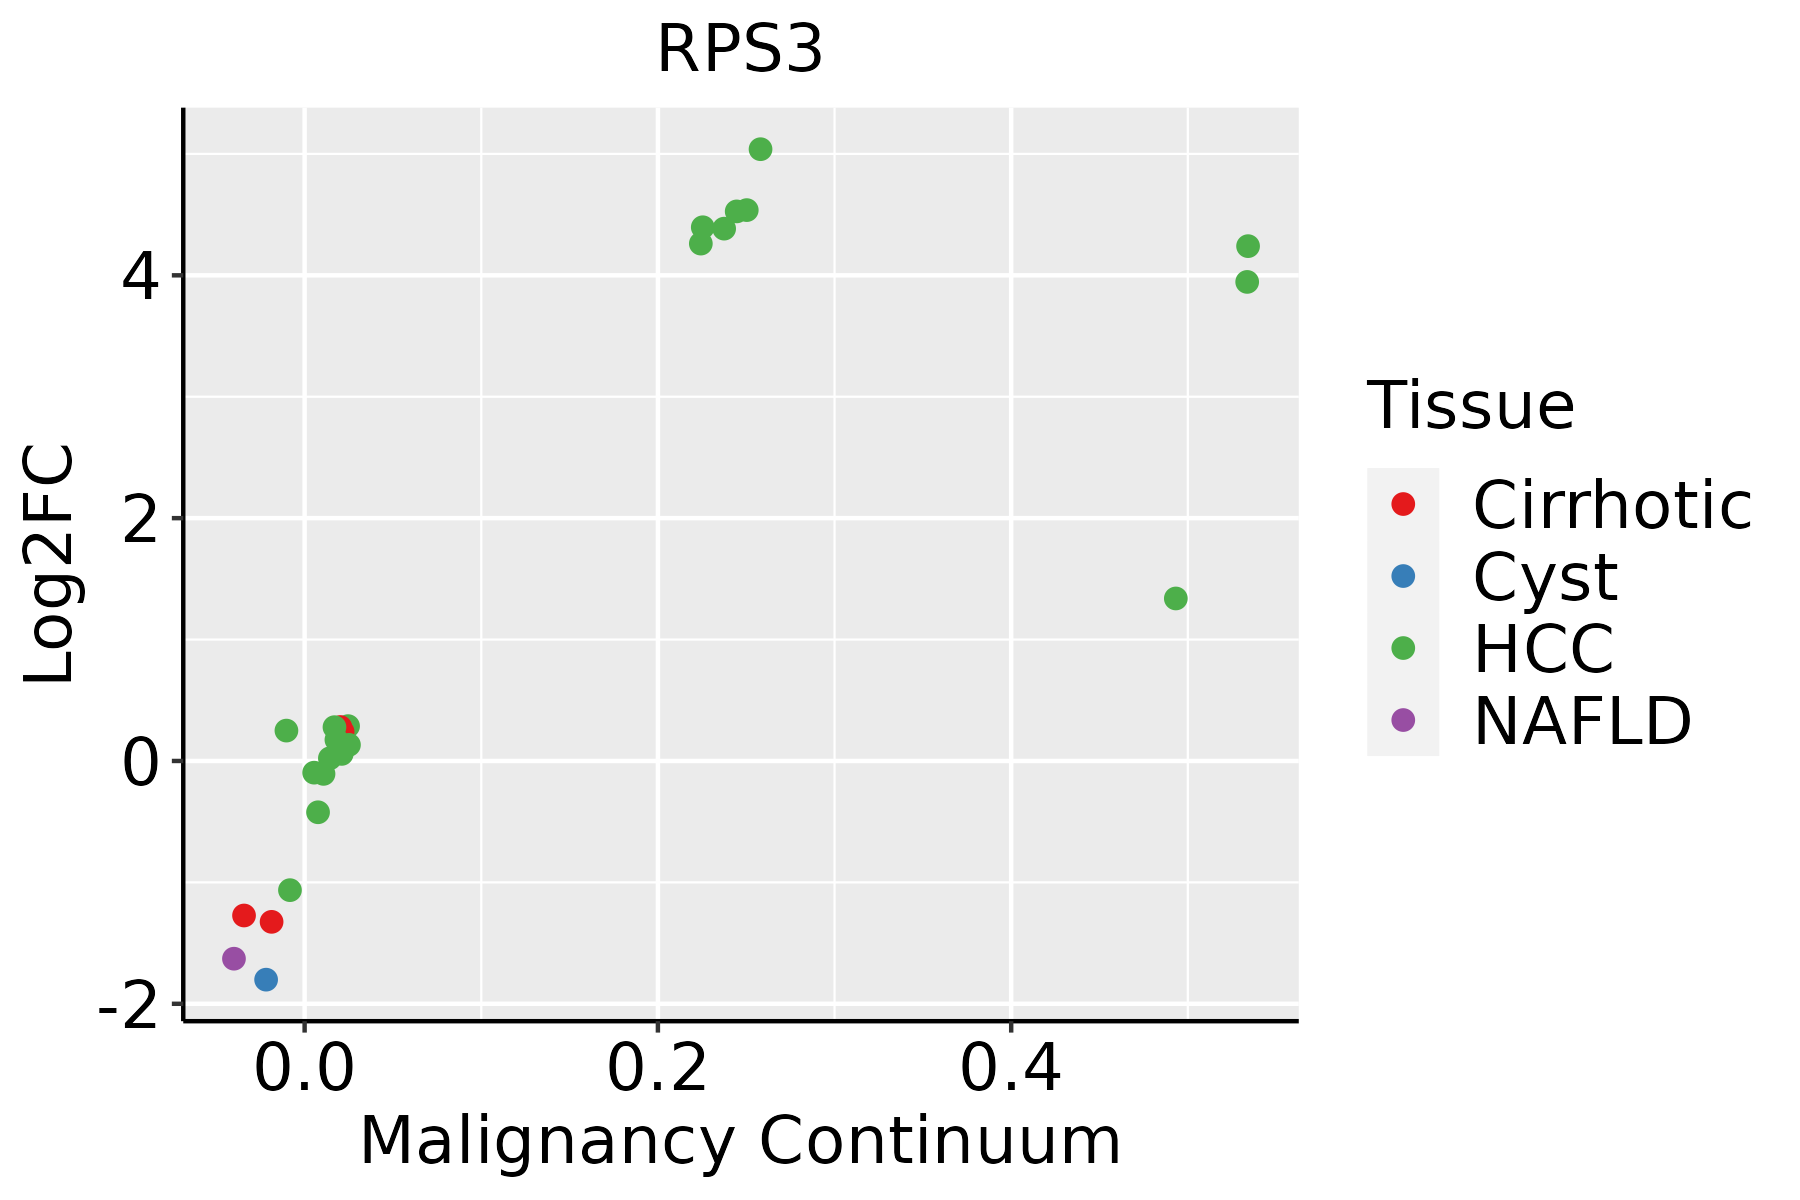 | HCC: Hepatocellular carcinoma |
| NAFLD: Non-alcoholic fatty liver disease | ||
| Lung | 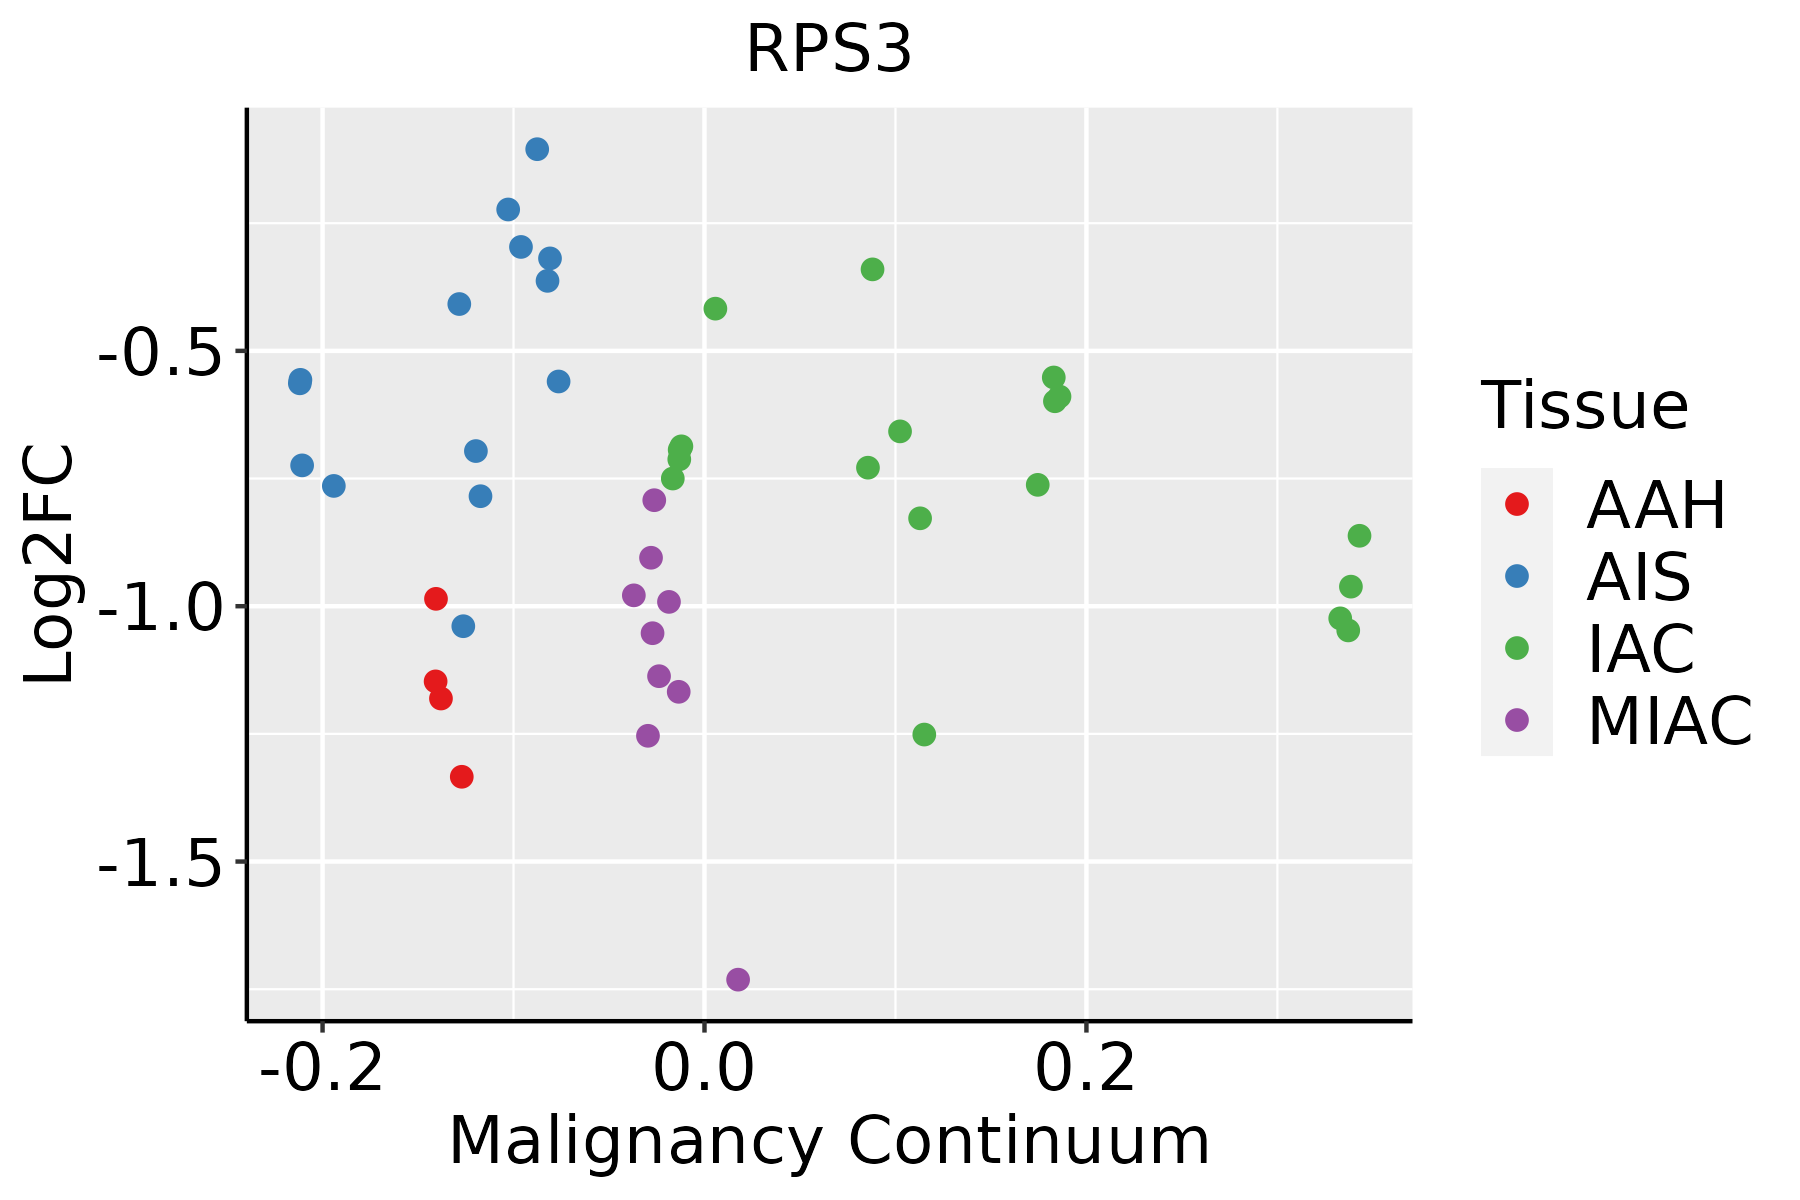 | AAH: Atypical adenomatous hyperplasia |
| AIS: Adenocarcinoma in situ | ||
| IAC: Invasive lung adenocarcinoma | ||
| MIA: Minimally invasive adenocarcinoma | ||
| Oral Cavity | 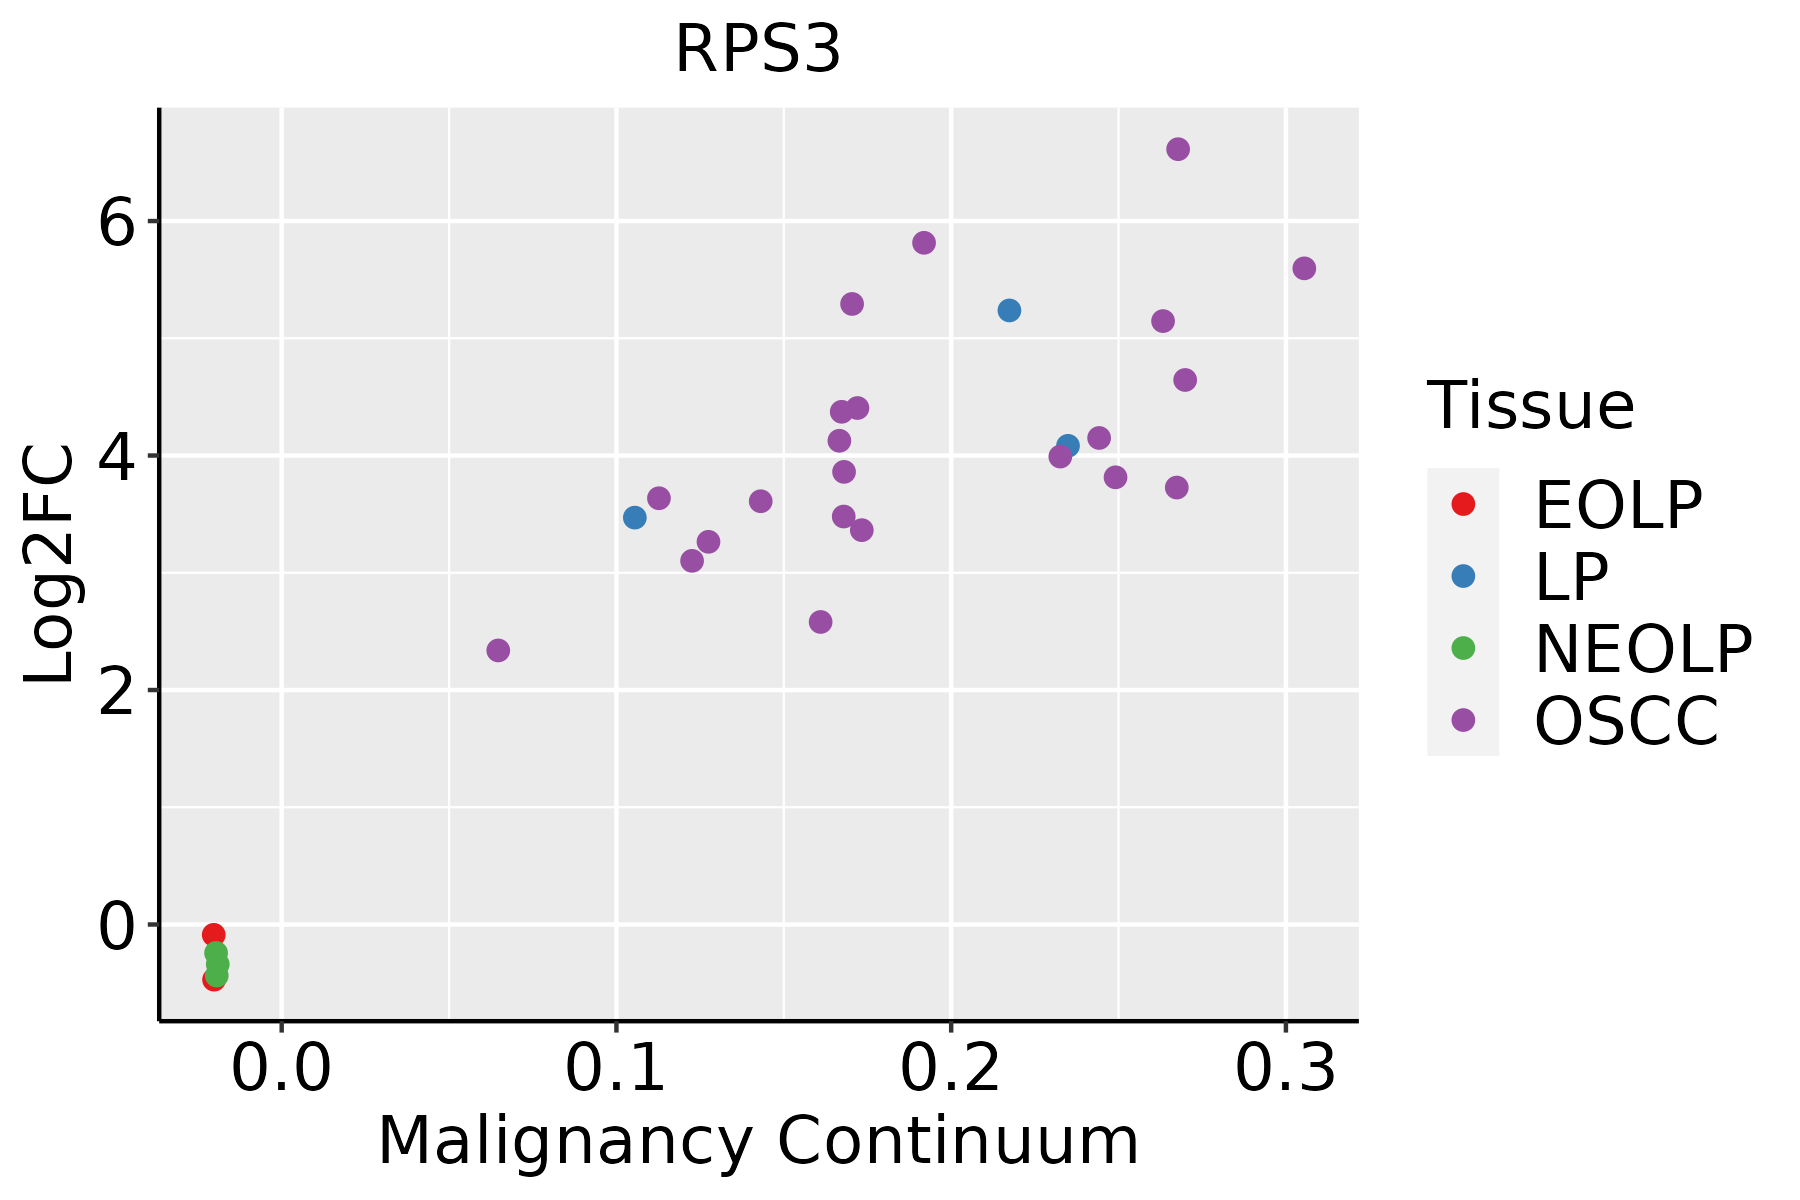 | EOLP: Erosive Oral lichen planus |
| LP: leukoplakia | ||
| NEOLP: Non-erosive oral lichen planus | ||
| OSCC: Oral squamous cell carcinoma | ||
| Prostate |  | BPH: Benign Prostatic Hyperplasia |
| Skin | 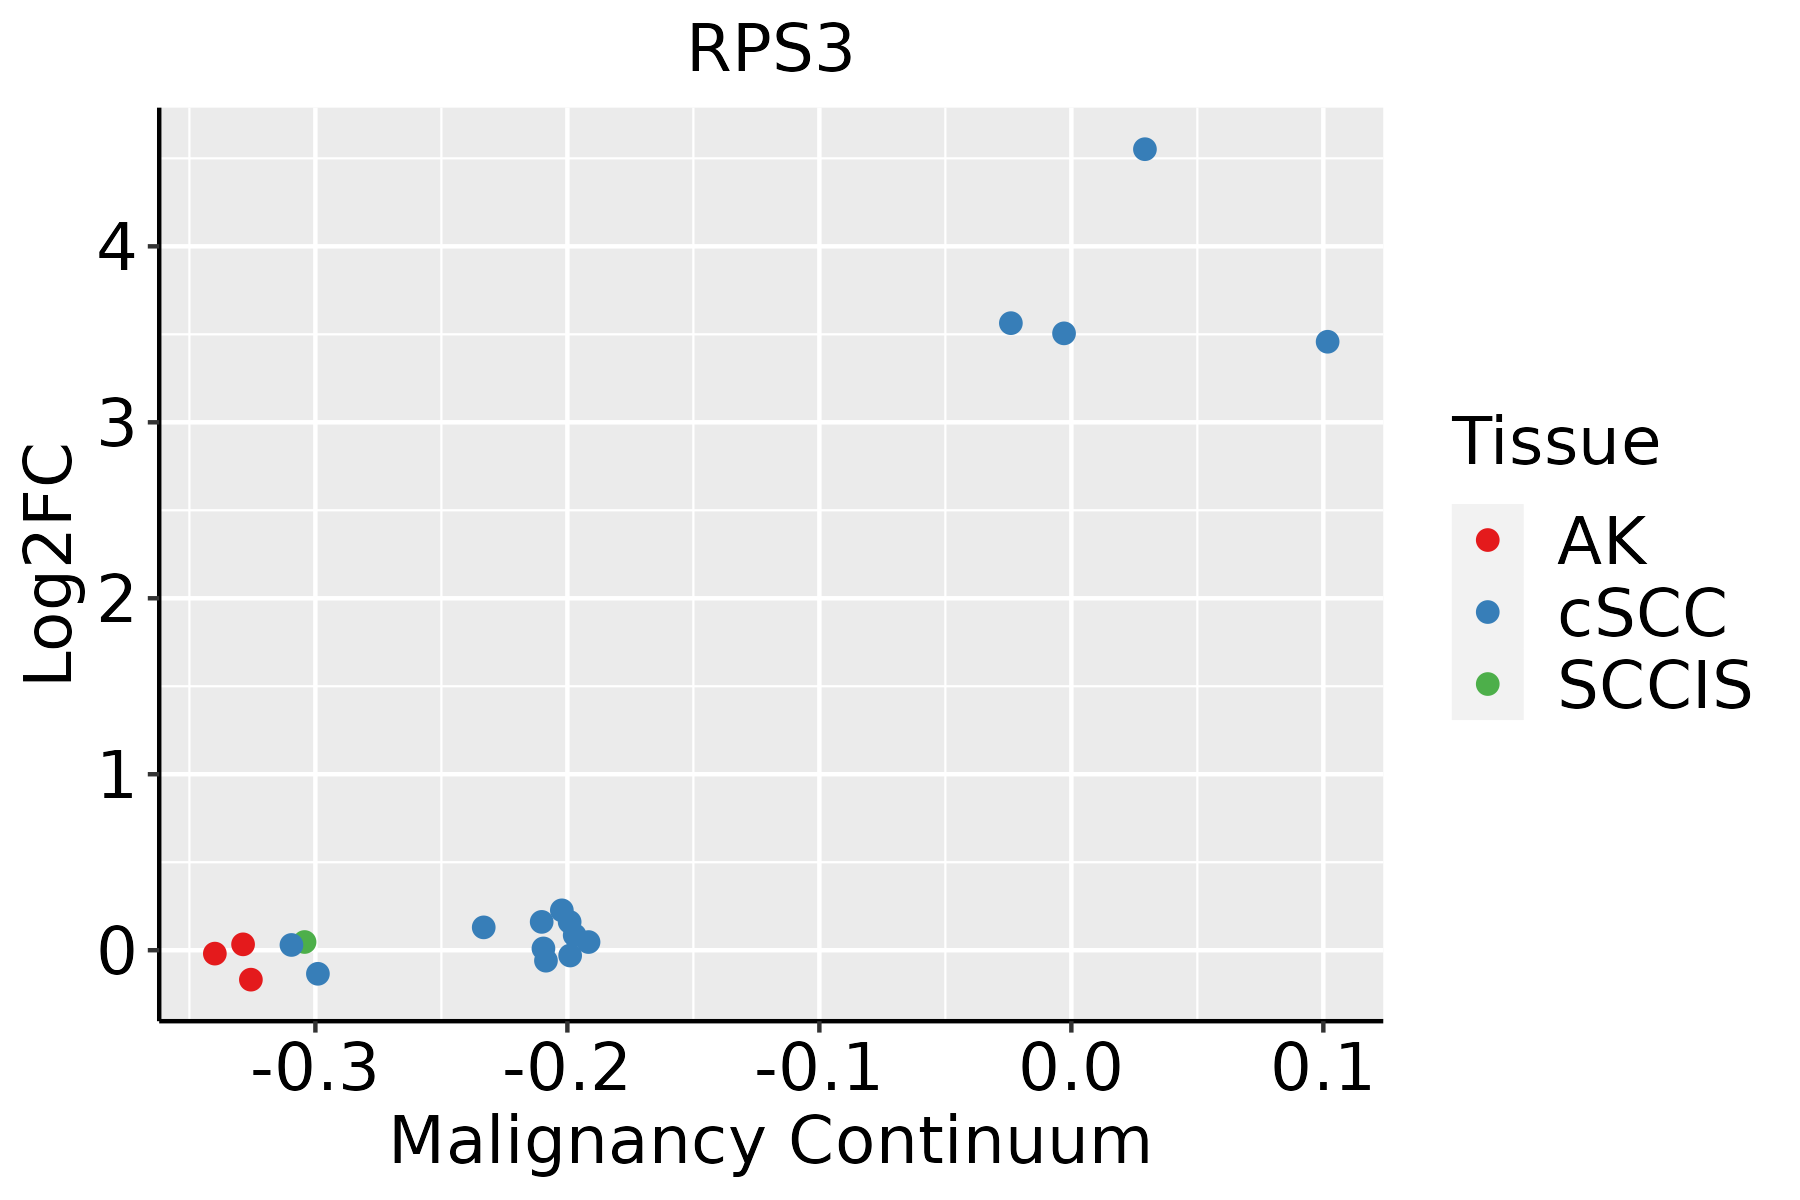 | AK: Actinic keratosis |
| cSCC: Cutaneous squamous cell carcinoma | ||
| SCCIS:squamous cell carcinoma in situ | ||
| Thyroid |  | ATC: Anaplastic thyroid cancer |
| HT: Hashimoto's thyroiditis | ||
| PTC: Papillary thyroid cancer |
| ∗log2FC in expression of this searched gene in stem-like cells from each diseased tissue sample relative to stem-like cells in normal samples in each tissue plotted against the malignancy continuum. Samples are colored based on if they are from different disease stage. |
Top |
Malignant transformation related pathway analysis |
| Find out the enriched GO biological processes and KEGG pathways involved in transition from healthy to precancer to cancer |
| Tissue | Disease Stage | Enriched GO biological Processes |
| Colorectum | AD |  |
| Colorectum | SER |  |
| Colorectum | MSS |  |
| Colorectum | MSI-H |  |
| Colorectum | FAP |  |
| ∗Top 15 enriched GO BP terms are showed in the bar plot of each disease state in each tissue. Each row represents a significant GO biological process which is colored according to the -log10(p.adjust). |
| Page: 1 2 3 4 5 6 7 8 9 |
| GO ID | Tissue | Disease Stage | Description | Gene Ratio | Bg Ratio | pvalue | p.adjust | Count |
| GO:000181919 | Thyroid | HT | positive regulation of cytokine production | 61/1272 | 467/18723 | 6.46e-07 | 2.68e-05 | 61 |
| GO:000269610 | Thyroid | HT | positive regulation of leukocyte activation | 55/1272 | 409/18723 | 9.17e-07 | 3.70e-05 | 55 |
| GO:190332130 | Thyroid | HT | negative regulation of protein modification by small protein conjugation or removal | 21/1272 | 95/18723 | 1.21e-06 | 4.73e-05 | 21 |
| GO:00508679 | Thyroid | HT | positive regulation of cell activation | 55/1272 | 420/18723 | 2.11e-06 | 7.61e-05 | 55 |
| GO:003139730 | Thyroid | HT | negative regulation of protein ubiquitination | 19/1272 | 83/18723 | 2.21e-06 | 7.82e-05 | 19 |
| GO:200011629 | Thyroid | HT | regulation of cysteine-type endopeptidase activity | 36/1272 | 235/18723 | 3.74e-06 | 1.23e-04 | 36 |
| GO:002240924 | Thyroid | HT | positive regulation of cell-cell adhesion | 41/1272 | 284/18723 | 3.80e-06 | 1.24e-04 | 41 |
| GO:004212917 | Thyroid | HT | regulation of T cell proliferation | 29/1272 | 171/18723 | 4.30e-06 | 1.39e-04 | 29 |
| GO:004209819 | Thyroid | HT | T cell proliferation | 32/1272 | 199/18723 | 4.53e-06 | 1.45e-04 | 32 |
| GO:200124420 | Thyroid | HT | positive regulation of intrinsic apoptotic signaling pathway | 15/1272 | 58/18723 | 5.16e-06 | 1.61e-04 | 15 |
| GO:007066110 | Thyroid | HT | leukocyte proliferation | 44/1272 | 318/18723 | 5.29e-06 | 1.64e-04 | 44 |
| GO:190303919 | Thyroid | HT | positive regulation of leukocyte cell-cell adhesion | 36/1272 | 239/18723 | 5.54e-06 | 1.68e-04 | 36 |
| GO:00342498 | Thyroid | HT | negative regulation of cellular amide metabolic process | 39/1272 | 273/18723 | 8.37e-06 | 2.34e-04 | 39 |
| GO:007066317 | Thyroid | HT | regulation of leukocyte proliferation | 36/1272 | 245/18723 | 9.78e-06 | 2.69e-04 | 36 |
| GO:200123527 | Thyroid | HT | positive regulation of apoptotic signaling pathway | 23/1272 | 126/18723 | 1.20e-05 | 3.15e-04 | 23 |
| GO:00466519 | Thyroid | HT | lymphocyte proliferation | 40/1272 | 288/18723 | 1.27e-05 | 3.30e-04 | 40 |
| GO:004328129 | Thyroid | HT | regulation of cysteine-type endopeptidase activity involved in apoptotic process | 32/1272 | 209/18723 | 1.29e-05 | 3.31e-04 | 32 |
| GO:00329438 | Thyroid | HT | mononuclear cell proliferation | 40/1272 | 291/18723 | 1.63e-05 | 3.95e-04 | 40 |
| GO:00506708 | Thyroid | HT | regulation of lymphocyte proliferation | 33/1272 | 225/18723 | 2.35e-05 | 5.25e-04 | 33 |
| GO:001095228 | Thyroid | HT | positive regulation of peptidase activity | 30/1272 | 197/18723 | 2.63e-05 | 5.84e-04 | 30 |
| Page: 1 2 3 4 5 6 7 8 9 10 11 12 13 14 15 16 17 18 19 20 21 22 23 24 25 26 27 28 29 30 31 32 33 34 35 36 37 38 39 40 41 42 43 44 45 46 47 48 49 50 51 52 53 54 55 56 57 58 59 60 61 62 63 64 65 66 67 68 69 70 71 72 73 74 75 76 77 78 79 80 81 82 83 84 85 86 87 88 89 90 91 92 93 94 95 96 97 98 99 100 101 102 103 104 105 106 107 108 109 110 111 112 113 |
| Pathway ID | Tissue | Disease Stage | Description | Gene Ratio | Bg Ratio | pvalue | p.adjust | qvalue | Count |
| hsa0301018 | Breast | Precancer | Ribosome | 80/684 | 167/8465 | 7.33e-44 | 2.32e-41 | 1.77e-41 | 80 |
| hsa0517118 | Breast | Precancer | Coronavirus disease - COVID-19 | 81/684 | 232/8465 | 3.74e-32 | 2.36e-30 | 1.81e-30 | 81 |
| hsa0513218 | Breast | Precancer | Salmonella infection | 49/684 | 249/8465 | 2.92e-09 | 6.15e-08 | 4.71e-08 | 49 |
| hsa0513018 | Breast | Precancer | Pathogenic Escherichia coli infection | 38/684 | 197/8465 | 3.12e-07 | 5.81e-06 | 4.45e-06 | 38 |
| hsa0301019 | Breast | Precancer | Ribosome | 80/684 | 167/8465 | 7.33e-44 | 2.32e-41 | 1.77e-41 | 80 |
| hsa0517119 | Breast | Precancer | Coronavirus disease - COVID-19 | 81/684 | 232/8465 | 3.74e-32 | 2.36e-30 | 1.81e-30 | 81 |
| hsa0513219 | Breast | Precancer | Salmonella infection | 49/684 | 249/8465 | 2.92e-09 | 6.15e-08 | 4.71e-08 | 49 |
| hsa0513019 | Breast | Precancer | Pathogenic Escherichia coli infection | 38/684 | 197/8465 | 3.12e-07 | 5.81e-06 | 4.45e-06 | 38 |
| hsa0301024 | Breast | IDC | Ribosome | 83/867 | 167/8465 | 6.07e-39 | 9.87e-37 | 7.38e-37 | 83 |
| hsa0517124 | Breast | IDC | Coronavirus disease - COVID-19 | 86/867 | 232/8465 | 1.50e-28 | 9.72e-27 | 7.27e-27 | 86 |
| hsa0513224 | Breast | IDC | Salmonella infection | 55/867 | 249/8465 | 2.07e-08 | 4.49e-07 | 3.36e-07 | 55 |
| hsa0513024 | Breast | IDC | Pathogenic Escherichia coli infection | 42/867 | 197/8465 | 2.66e-06 | 3.92e-05 | 2.94e-05 | 42 |
| hsa0301034 | Breast | IDC | Ribosome | 83/867 | 167/8465 | 6.07e-39 | 9.87e-37 | 7.38e-37 | 83 |
| hsa0517134 | Breast | IDC | Coronavirus disease - COVID-19 | 86/867 | 232/8465 | 1.50e-28 | 9.72e-27 | 7.27e-27 | 86 |
| hsa0513234 | Breast | IDC | Salmonella infection | 55/867 | 249/8465 | 2.07e-08 | 4.49e-07 | 3.36e-07 | 55 |
| hsa0513034 | Breast | IDC | Pathogenic Escherichia coli infection | 42/867 | 197/8465 | 2.66e-06 | 3.92e-05 | 2.94e-05 | 42 |
| hsa0301044 | Breast | DCIS | Ribosome | 82/846 | 167/8465 | 8.69e-39 | 1.40e-36 | 1.03e-36 | 82 |
| hsa0517144 | Breast | DCIS | Coronavirus disease - COVID-19 | 86/846 | 232/8465 | 2.42e-29 | 1.56e-27 | 1.15e-27 | 86 |
| hsa0513243 | Breast | DCIS | Salmonella infection | 55/846 | 249/8465 | 8.71e-09 | 1.87e-07 | 1.38e-07 | 55 |
| hsa0513043 | Breast | DCIS | Pathogenic Escherichia coli infection | 42/846 | 197/8465 | 1.40e-06 | 2.15e-05 | 1.59e-05 | 42 |
| Page: 1 2 3 4 5 6 7 8 9 10 11 12 |
Top |
Cell-cell communication analysis |
| Identification of potential cell-cell interactions between two cell types and their ligand-receptor pairs for different disease states |
| Ligand | Receptor | LRpair | Pathway | Tissue | Disease Stage |
| Page: 1 |
Top |
Single-cell gene regulatory network inference analysis |
| Find out the significant the regulons (TFs) and the target genes of each regulon across cell types for different disease states |
| TF | Cell Type | Tissue | Disease Stage | Target Gene | RSS | Regulon Activity |
| ∗The dot plots of a searched regulon are shown for all cell subpopulations in each disease state of each tissue based on the regulon specific score inferred using pySCENIC and by calculating the average expression. |
| Page: 1 |
Top |
Somatic mutation of malignant transformation related genes |
| Annotation of somatic variants for genes involved in malignant transformation |
| Hugo Symbol | Variant Class | Variant Classification | dbSNP RS | HGVSc | HGVSp | HGVSp Short | SWISSPROT | BIOTYPE | SIFT | PolyPhen | Tumor Sample Barcode | Tissue | Histology | Sex | Age | Stage | Therapy Types | Drugs | Outcome |
| RPS3 | SNV | Missense_Mutation | c.212N>A | p.Ala71Asp | p.A71D | P23396 | protein_coding | deleterious(0.01) | possibly_damaging(0.786) | TCGA-AA-3672-01 | Colorectum | colon adenocarcinoma | Female | >=65 | III/IV | Unknown | Unknown | SD | |
| RPS3 | SNV | Missense_Mutation | rs1802703 | c.376N>A | p.Leu126Ile | p.L126I | P23396 | protein_coding | tolerated(0.16) | benign(0.045) | TCGA-AD-6889-01 | Colorectum | colon adenocarcinoma | Male | >=65 | I/II | Chemotherapy | xeloda | PD |
| RPS3 | SNV | Missense_Mutation | c.43N>C | p.Gly15Arg | p.G15R | P23396 | protein_coding | deleterious(0) | probably_damaging(1) | TCGA-AG-A02X-01 | Colorectum | rectum adenocarcinoma | Male | >=65 | I/II | Unknown | Unknown | SD | |
| RPS3 | SNV | Missense_Mutation | c.419N>A | p.Arg140Gln | p.R140Q | P23396 | protein_coding | tolerated(0.1) | possibly_damaging(0.855) | TCGA-EF-5830-01 | Colorectum | rectum adenocarcinoma | Male | <65 | I/II | Unknown | Unknown | SD | |
| RPS3 | SNV | Missense_Mutation | c.89N>A | p.Ala30Asp | p.A30D | P23396 | protein_coding | deleterious(0.01) | probably_damaging(0.924) | TCGA-AX-A06D-01 | Endometrium | uterine corpus endometrioid carcinoma | Female | >=65 | III/IV | Chemotherapy | carboplatin | PD | |
| RPS3 | SNV | Missense_Mutation | c.89C>A | p.Ala30Asp | p.A30D | P23396 | protein_coding | deleterious(0.01) | probably_damaging(0.924) | TCGA-AX-A06H-01 | Endometrium | uterine corpus endometrioid carcinoma | Female | <65 | III/IV | Chemotherapy | paclitaxel | SD | |
| RPS3 | SNV | Missense_Mutation | rs747317928 | c.565N>T | p.Arg189Cys | p.R189C | P23396 | protein_coding | tolerated(0.12) | probably_damaging(1) | TCGA-B5-A11J-01 | Endometrium | uterine corpus endometrioid carcinoma | Female | <65 | I/II | Unknown | Unknown | SD |
| RPS3 | SNV | Missense_Mutation | c.664N>A | p.Asp222Asn | p.D222N | P23396 | protein_coding | deleterious(0.03) | benign(0.278) | TCGA-D1-A160-01 | Endometrium | uterine corpus endometrioid carcinoma | Female | >=65 | I/II | Unknown | Unknown | SD | |
| RPS3 | SNV | Missense_Mutation | novel | c.655C>T | p.Pro219Ser | p.P219S | P23396 | protein_coding | tolerated(0.1) | possibly_damaging(0.767) | TCGA-D1-A175-01 | Endometrium | uterine corpus endometrioid carcinoma | Female | <65 | I/II | Chemotherapy | paclitaxel | SD |
| RPS3 | SNV | Missense_Mutation | c.85N>A | p.Leu29Met | p.L29M | P23396 | protein_coding | deleterious(0) | probably_damaging(1) | TCGA-DF-A2KU-01 | Endometrium | uterine corpus endometrioid carcinoma | Female | Unknown | I/II | Unknown | Unknown | SD |
| Page: 1 2 |
Top |
Related drugs of malignant transformation related genes |
| Identification of chemicals and drugs interact with genes involved in malignant transfromation |
| (DGIdb 4.0) |
| Entrez ID | Symbol | Category | Interaction Types | Drug Claim Name | Drug Name | PMIDs |
| Page: 1 |

Copyright 2023-Present -The University of Texas Health Science Center at Houston |