
|
|||||
|
 | |
| |
| |
| |
| |
| |
|
Gene: WNT5A |
Gene summary for WNT5A |
| Gene information | Species | Human | Gene symbol | WNT5A | Gene ID | 7474 |
| Gene name | Wnt family member 5A | |
| Gene Alias | hWNT5A | |
| Cytomap | 3p14.3 | |
| Gene Type | protein-coding | GO ID | GO:0000003 | UniProtAcc | A0A024R316 |
Top |
Malignant transformation analysis |
| Identification of the aberrant gene expression in precancerous and cancerous lesions by comparing the gene expression of stem-like cells in diseased tissues with normal stem cells |
| Entrez ID | Symbol | Replicates | Species | Organ | Tissue | Adj P-value | Log2FC | Malignancy |
| 7474 | WNT5A | LZE4T | Human | Esophagus | ESCC | 1.47e-05 | 2.62e-01 | 0.0811 |
| 7474 | WNT5A | P4T-E | Human | Esophagus | ESCC | 1.29e-08 | 3.40e-01 | 0.1323 |
| 7474 | WNT5A | P8T-E | Human | Esophagus | ESCC | 9.35e-12 | 2.41e-01 | 0.0889 |
| 7474 | WNT5A | P9T-E | Human | Esophagus | ESCC | 7.73e-07 | 2.00e-01 | 0.1131 |
| 7474 | WNT5A | P10T-E | Human | Esophagus | ESCC | 7.80e-11 | 2.40e-01 | 0.116 |
| 7474 | WNT5A | P12T-E | Human | Esophagus | ESCC | 2.33e-33 | 6.94e-01 | 0.1122 |
| 7474 | WNT5A | P15T-E | Human | Esophagus | ESCC | 6.29e-13 | 3.25e-01 | 0.1149 |
| 7474 | WNT5A | P22T-E | Human | Esophagus | ESCC | 6.11e-04 | 1.56e-01 | 0.1236 |
| 7474 | WNT5A | P23T-E | Human | Esophagus | ESCC | 5.15e-05 | 3.79e-01 | 0.108 |
| 7474 | WNT5A | P24T-E | Human | Esophagus | ESCC | 7.66e-05 | 2.02e-01 | 0.1287 |
| 7474 | WNT5A | P26T-E | Human | Esophagus | ESCC | 1.93e-16 | 3.97e-01 | 0.1276 |
| 7474 | WNT5A | P27T-E | Human | Esophagus | ESCC | 6.39e-18 | 3.45e-01 | 0.1055 |
| 7474 | WNT5A | P28T-E | Human | Esophagus | ESCC | 4.38e-05 | 7.38e-02 | 0.1149 |
| 7474 | WNT5A | P30T-E | Human | Esophagus | ESCC | 3.26e-21 | 9.54e-01 | 0.137 |
| 7474 | WNT5A | P32T-E | Human | Esophagus | ESCC | 9.60e-09 | 2.51e-01 | 0.1666 |
| 7474 | WNT5A | P36T-E | Human | Esophagus | ESCC | 4.78e-07 | 3.85e-01 | 0.1187 |
| 7474 | WNT5A | P39T-E | Human | Esophagus | ESCC | 2.79e-12 | 2.82e-01 | 0.0894 |
| 7474 | WNT5A | P42T-E | Human | Esophagus | ESCC | 4.51e-07 | 4.71e-01 | 0.1175 |
| 7474 | WNT5A | P47T-E | Human | Esophagus | ESCC | 1.69e-02 | 2.39e-01 | 0.1067 |
| 7474 | WNT5A | P48T-E | Human | Esophagus | ESCC | 6.01e-11 | 2.86e-01 | 0.0959 |
| Page: 1 2 3 |
| Tissue | Expression Dynamics | Abbreviation |
| Esophagus | 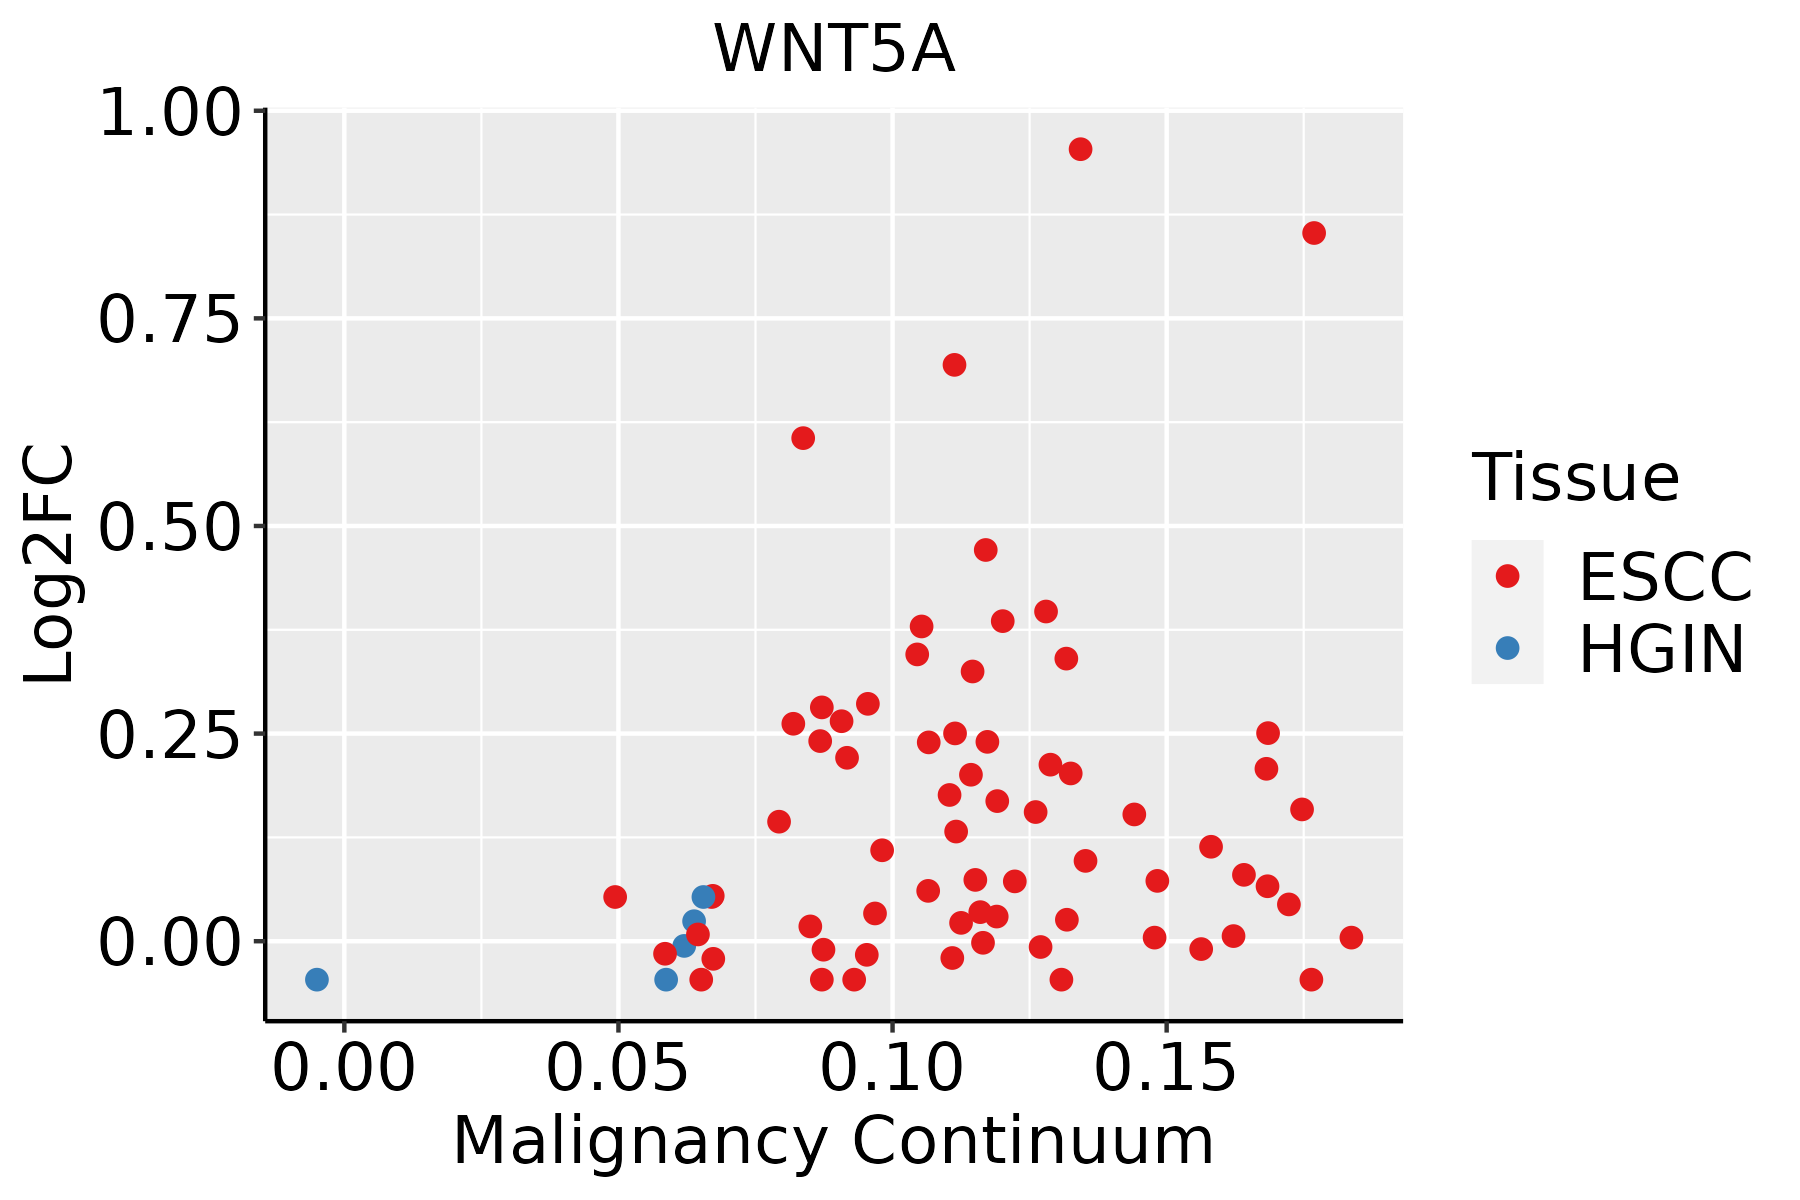 | ESCC: Esophageal squamous cell carcinoma |
| HGIN: High-grade intraepithelial neoplasias | ||
| LGIN: Low-grade intraepithelial neoplasias | ||
| Thyroid | 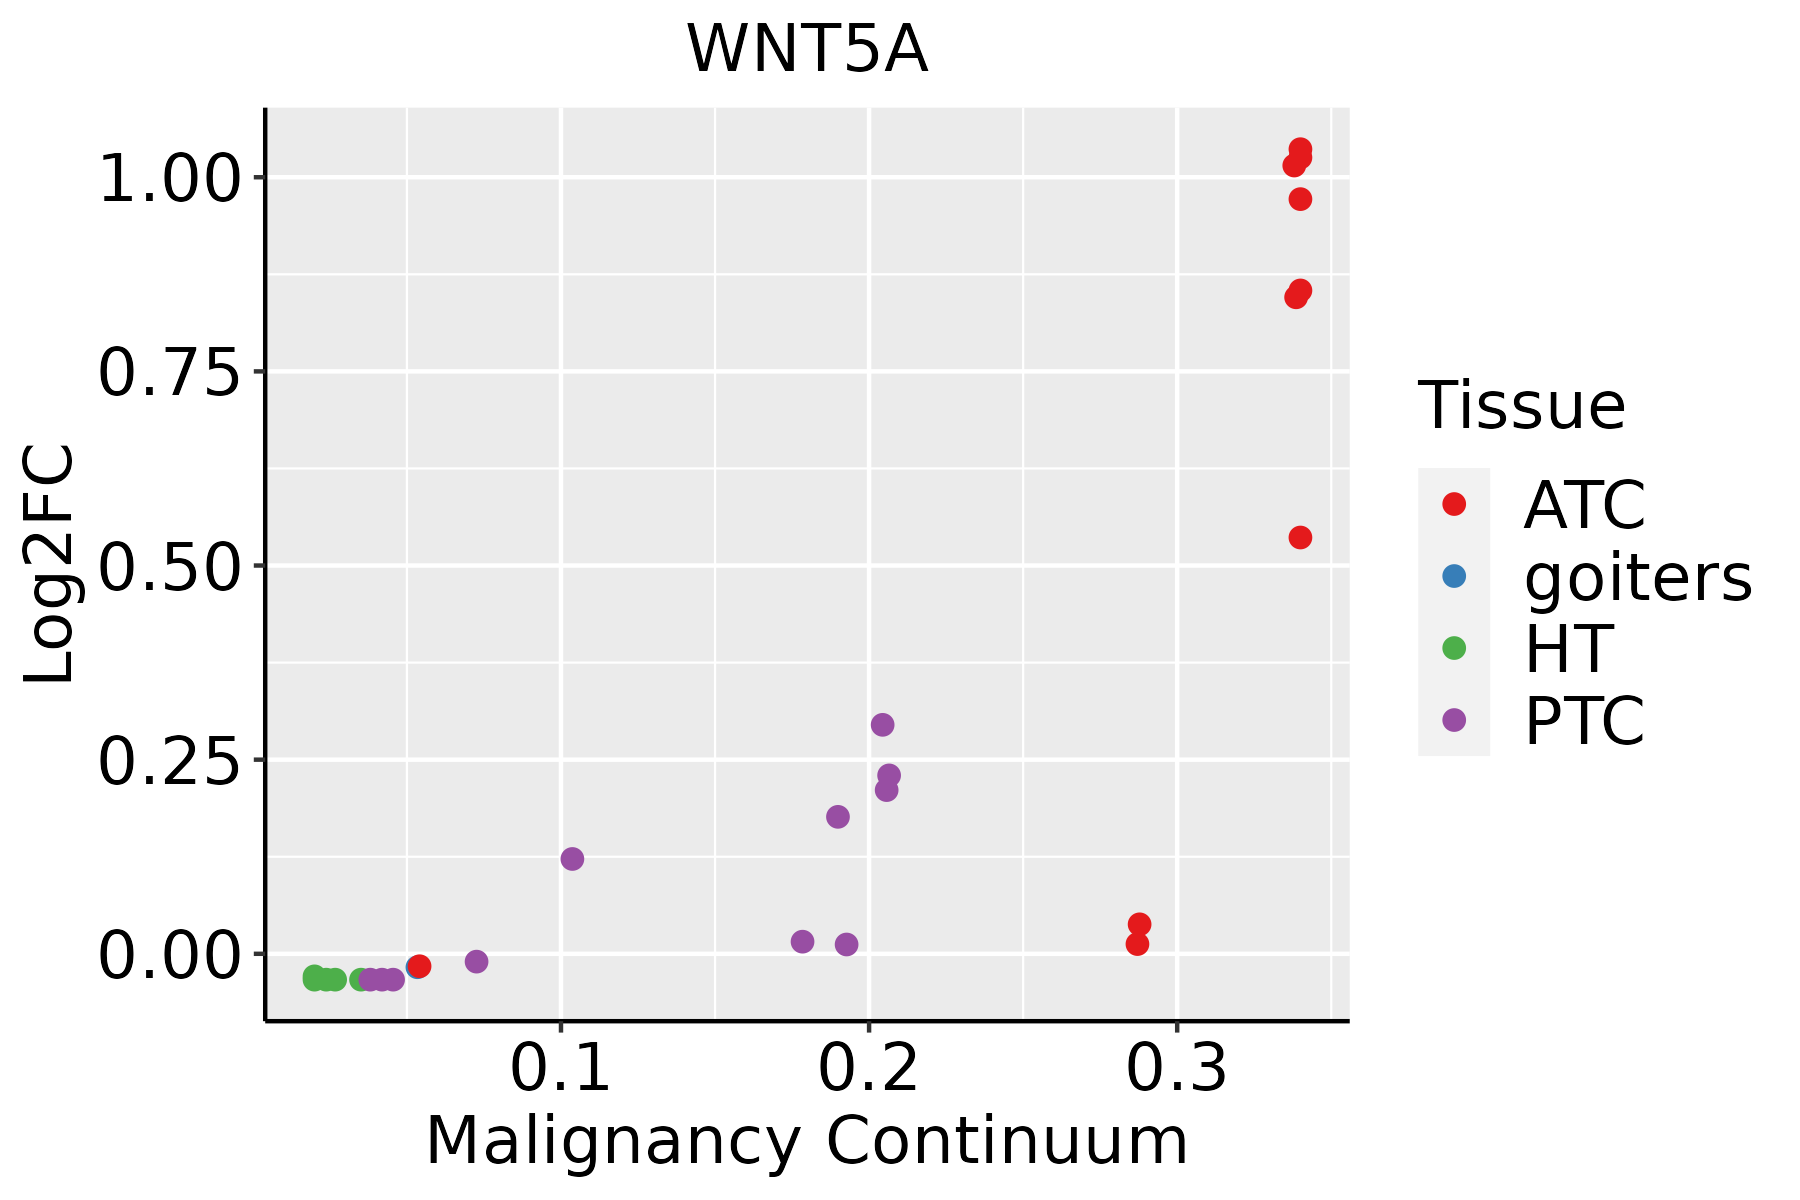 | ATC: Anaplastic thyroid cancer |
| HT: Hashimoto's thyroiditis | ||
| PTC: Papillary thyroid cancer |
| ∗log2FC in expression of this searched gene in stem-like cells from each diseased tissue sample relative to stem-like cells in normal samples in each tissue plotted against the malignancy continuum. Samples are colored based on if they are from different disease stage. |
Top |
Malignant transformation related pathway analysis |
| Find out the enriched GO biological processes and KEGG pathways involved in transition from healthy to precancer to cancer |
| Tissue | Disease Stage | Enriched GO biological Processes |
| Colorectum | AD |  |
| Colorectum | SER |  |
| Colorectum | MSS |  |
| Colorectum | MSI-H |  |
| Colorectum | FAP |  |
| ∗Top 15 enriched GO BP terms are showed in the bar plot of each disease state in each tissue. Each row represents a significant GO biological process which is colored according to the -log10(p.adjust). |
| Page: 1 2 3 4 5 6 7 8 9 |
| GO ID | Tissue | Disease Stage | Description | Gene Ratio | Bg Ratio | pvalue | p.adjust | Count |
| GO:004858810 | Esophagus | ESCC | developmental cell growth | 125/8552 | 234/18723 | 1.01e-02 | 3.46e-02 | 125 |
| GO:00463302 | Esophagus | ESCC | positive regulation of JNK cascade | 52/8552 | 89/18723 | 1.04e-02 | 3.56e-02 | 52 |
| GO:00017639 | Esophagus | ESCC | morphogenesis of a branching structure | 106/8552 | 196/18723 | 1.08e-02 | 3.66e-02 | 106 |
| GO:00512161 | Esophagus | ESCC | cartilage development | 103/8552 | 190/18723 | 1.08e-02 | 3.67e-02 | 103 |
| GO:001821010 | Esophagus | ESCC | peptidyl-threonine modification | 70/8552 | 125/18723 | 1.29e-02 | 4.25e-02 | 70 |
| GO:001470615 | Esophagus | ESCC | striated muscle tissue development | 197/8552 | 384/18723 | 1.46e-02 | 4.74e-02 | 197 |
| GO:0070231 | Esophagus | ESCC | T cell apoptotic process | 31/8552 | 50/18723 | 1.48e-02 | 4.79e-02 | 31 |
| GO:00104645 | Esophagus | ESCC | regulation of mesenchymal cell proliferation | 19/8552 | 28/18723 | 1.49e-02 | 4.84e-02 | 19 |
| GO:190188810 | Esophagus | ESCC | regulation of cell junction assembly | 109/8552 | 204/18723 | 1.53e-02 | 4.96e-02 | 109 |
| GO:00331383 | Esophagus | ESCC | positive regulation of peptidyl-serine phosphorylation | 61/8552 | 108/18723 | 1.54e-02 | 4.96e-02 | 61 |
| GO:0009896113 | Thyroid | PTC | positive regulation of catabolic process | 278/5968 | 492/18723 | 3.35e-30 | 2.64e-27 | 278 |
| GO:0042176113 | Thyroid | PTC | regulation of protein catabolic process | 231/5968 | 391/18723 | 4.76e-29 | 2.14e-26 | 231 |
| GO:0045732113 | Thyroid | PTC | positive regulation of protein catabolic process | 142/5968 | 231/18723 | 1.43e-20 | 2.38e-18 | 142 |
| GO:0051098113 | Thyroid | PTC | regulation of binding | 195/5968 | 363/18723 | 3.21e-18 | 3.37e-16 | 195 |
| GO:0022604112 | Thyroid | PTC | regulation of cell morphogenesis | 165/5968 | 309/18723 | 2.60e-15 | 1.82e-13 | 165 |
| GO:0016055110 | Thyroid | PTC | Wnt signaling pathway | 217/5968 | 444/18723 | 3.71e-14 | 2.30e-12 | 217 |
| GO:0198738110 | Thyroid | PTC | cell-cell signaling by wnt | 217/5968 | 446/18723 | 6.68e-14 | 3.73e-12 | 217 |
| GO:0051099113 | Thyroid | PTC | positive regulation of binding | 100/5968 | 173/18723 | 1.56e-12 | 6.96e-11 | 100 |
| GO:0016049112 | Thyroid | PTC | cell growth | 225/5968 | 482/18723 | 4.75e-12 | 2.07e-10 | 225 |
| GO:0030111110 | Thyroid | PTC | regulation of Wnt signaling pathway | 163/5968 | 328/18723 | 1.05e-11 | 4.29e-10 | 163 |
| Page: 1 2 3 4 5 6 7 8 9 10 11 12 13 14 15 16 17 18 19 20 21 22 23 24 25 26 27 28 29 30 31 |
| Pathway ID | Tissue | Disease Stage | Description | Gene Ratio | Bg Ratio | pvalue | p.adjust | qvalue | Count |
| hsa05022210 | Esophagus | ESCC | Pathways of neurodegeneration - multiple diseases | 318/4205 | 476/8465 | 6.10e-15 | 2.04e-13 | 1.05e-13 | 318 |
| hsa05010210 | Esophagus | ESCC | Alzheimer disease | 263/4205 | 384/8465 | 1.80e-14 | 5.47e-13 | 2.80e-13 | 263 |
| hsa0516510 | Esophagus | ESCC | Human papillomavirus infection | 215/4205 | 331/8465 | 7.86e-09 | 7.12e-08 | 3.65e-08 | 215 |
| hsa0520529 | Esophagus | ESCC | Proteoglycans in cancer | 138/4205 | 205/8465 | 1.79e-07 | 1.40e-06 | 7.15e-07 | 138 |
| hsa0522518 | Esophagus | ESCC | Hepatocellular carcinoma | 109/4205 | 168/8465 | 4.27e-05 | 1.88e-04 | 9.64e-05 | 109 |
| hsa041505 | Esophagus | ESCC | mTOR signaling pathway | 98/4205 | 156/8465 | 5.81e-04 | 1.95e-03 | 9.97e-04 | 98 |
| hsa0436016 | Esophagus | ESCC | Axon guidance | 108/4205 | 182/8465 | 5.13e-03 | 1.30e-02 | 6.67e-03 | 108 |
| hsa0439018 | Esophagus | ESCC | Hippo signaling pathway | 92/4205 | 157/8465 | 1.46e-02 | 3.31e-02 | 1.69e-02 | 92 |
| hsa0502238 | Esophagus | ESCC | Pathways of neurodegeneration - multiple diseases | 318/4205 | 476/8465 | 6.10e-15 | 2.04e-13 | 1.05e-13 | 318 |
| hsa0501038 | Esophagus | ESCC | Alzheimer disease | 263/4205 | 384/8465 | 1.80e-14 | 5.47e-13 | 2.80e-13 | 263 |
| hsa0516515 | Esophagus | ESCC | Human papillomavirus infection | 215/4205 | 331/8465 | 7.86e-09 | 7.12e-08 | 3.65e-08 | 215 |
| hsa0520537 | Esophagus | ESCC | Proteoglycans in cancer | 138/4205 | 205/8465 | 1.79e-07 | 1.40e-06 | 7.15e-07 | 138 |
| hsa0522519 | Esophagus | ESCC | Hepatocellular carcinoma | 109/4205 | 168/8465 | 4.27e-05 | 1.88e-04 | 9.64e-05 | 109 |
| hsa0415013 | Esophagus | ESCC | mTOR signaling pathway | 98/4205 | 156/8465 | 5.81e-04 | 1.95e-03 | 9.97e-04 | 98 |
| hsa0436017 | Esophagus | ESCC | Axon guidance | 108/4205 | 182/8465 | 5.13e-03 | 1.30e-02 | 6.67e-03 | 108 |
| hsa0439019 | Esophagus | ESCC | Hippo signaling pathway | 92/4205 | 157/8465 | 1.46e-02 | 3.31e-02 | 1.69e-02 | 92 |
| Page: 1 |
Top |
Cell-cell communication analysis |
| Identification of potential cell-cell interactions between two cell types and their ligand-receptor pairs for different disease states |
| Ligand | Receptor | LRpair | Pathway | Tissue | Disease Stage |
| WNT5A | FZD1 | WNT5A_FZD1 | ncWNT | Cervix | ADJ |
| WNT5A | FZD4 | WNT5A_FZD4 | ncWNT | Cervix | ADJ |
| WNT5A | FZD6 | WNT5A_FZD6 | ncWNT | Cervix | ADJ |
| WNT5A | FZD7 | WNT5A_FZD7 | ncWNT | Cervix | ADJ |
| WNT5A | MCAM | WNT5A_MCAM | ncWNT | Cervix | ADJ |
| WNT5A | FZD4 | WNT5A_FZD4 | ncWNT | Cervix | CC |
| WNT5A | FZD6 | WNT5A_FZD6 | ncWNT | Cervix | CC |
| WNT5A | MCAM | WNT5A_MCAM | ncWNT | Cervix | CC |
| WNT5A | MCAM | WNT5A_MCAM | ncWNT | Cervix | Precancer |
| WNT5A | FZD4 | WNT5A_FZD4 | ncWNT | Endometrium | ADJ |
| WNT5A | FZD6 | WNT5A_FZD6 | ncWNT | Endometrium | ADJ |
| WNT5A | MCAM | WNT5A_MCAM | ncWNT | Endometrium | ADJ |
| WNT5A | FZD4 | WNT5A_FZD4 | ncWNT | Endometrium | AEH |
| WNT5A | FZD7 | WNT5A_FZD7 | ncWNT | Endometrium | AEH |
| WNT5A | MCAM | WNT5A_MCAM | ncWNT | Endometrium | AEH |
| WNT5A | MCAM | WNT5A_MCAM | ncWNT | Endometrium | Healthy |
| WNT5A | FZD1 | WNT5A_FZD1 | ncWNT | Esophagus | ESCC |
| WNT5A | FZD10 | WNT5A_FZD10 | ncWNT | Esophagus | ESCC |
| WNT5A | FZD3 | WNT5A_FZD3 | ncWNT | Esophagus | ESCC |
| WNT5A | FZD4 | WNT5A_FZD4 | ncWNT | Esophagus | ESCC |
| Page: 1 2 3 |
Top |
Single-cell gene regulatory network inference analysis |
| Find out the significant the regulons (TFs) and the target genes of each regulon across cell types for different disease states |
| TF | Cell Type | Tissue | Disease Stage | Target Gene | RSS | Regulon Activity |
| ∗The dot plots of a searched regulon are shown for all cell subpopulations in each disease state of each tissue based on the regulon specific score inferred using pySCENIC and by calculating the average expression. |
| Page: 1 |
Top |
Somatic mutation of malignant transformation related genes |
| Annotation of somatic variants for genes involved in malignant transformation |
| Hugo Symbol | Variant Class | Variant Classification | dbSNP RS | HGVSc | HGVSp | HGVSp Short | SWISSPROT | BIOTYPE | SIFT | PolyPhen | Tumor Sample Barcode | Tissue | Histology | Sex | Age | Stage | Therapy Types | Drugs | Outcome |
| WNT5A | SNV | Missense_Mutation | rs369954366 | c.830G>A | p.Arg277Gln | p.R277Q | P41221 | protein_coding | tolerated(0.05) | possibly_damaging(0.65) | TCGA-2W-A8YY-01 | Cervix | cervical & endocervical cancer | Female | <65 | I/II | Chemotherapy | cisplatin | CR |
| WNT5A | SNV | Missense_Mutation | novel | c.947N>A | p.Gly316Asp | p.G316D | P41221 | protein_coding | deleterious(0) | probably_damaging(1) | TCGA-C5-A1M6-01 | Cervix | cervical & endocervical cancer | Female | <65 | I/II | Chemotherapy | cisplatin | PD |
| WNT5A | SNV | Missense_Mutation | rs755298573 | c.1055N>T | p.Thr352Met | p.T352M | P41221 | protein_coding | tolerated(0.09) | possibly_damaging(0.502) | TCGA-UC-A7PI-01 | Cervix | cervical & endocervical cancer | Female | <65 | I/II | Unknown | Unknown | PD |
| WNT5A | SNV | Missense_Mutation | c.758G>T | p.Trp253Leu | p.W253L | P41221 | protein_coding | deleterious(0) | probably_damaging(1) | TCGA-AA-3489-01 | Colorectum | colon adenocarcinoma | Male | >=65 | I/II | Unknown | Unknown | PD | |
| WNT5A | SNV | Missense_Mutation | c.442N>T | p.Asn148Tyr | p.N148Y | P41221 | protein_coding | tolerated(1) | possibly_damaging(0.629) | TCGA-AA-3492-01 | Colorectum | colon adenocarcinoma | Female | >=65 | I/II | Unknown | Unknown | SD | |
| WNT5A | SNV | Missense_Mutation | rs201975128 | c.983N>T | p.Thr328Met | p.T328M | P41221 | protein_coding | deleterious(0.01) | probably_damaging(1) | TCGA-AA-3947-01 | Colorectum | colon adenocarcinoma | Female | <65 | I/II | Unknown | Unknown | SD |
| WNT5A | SNV | Missense_Mutation | c.928N>A | p.Val310Met | p.V310M | P41221 | protein_coding | tolerated(0.13) | benign(0.051) | TCGA-AA-3984-01 | Colorectum | colon adenocarcinoma | Female | <65 | I/II | Unknown | Unknown | SD | |
| WNT5A | SNV | Missense_Mutation | c.306A>C | p.Lys102Asn | p.K102N | P41221 | protein_coding | tolerated(0.1) | possibly_damaging(0.529) | TCGA-AA-A010-01 | Colorectum | colon adenocarcinoma | Female | <65 | I/II | Chemotherapy | folinic | CR | |
| WNT5A | SNV | Missense_Mutation | c.1021N>T | p.Gly341Cys | p.G341C | P41221 | protein_coding | deleterious(0) | probably_damaging(1) | TCGA-AA-A02R-01 | Colorectum | colon adenocarcinoma | Female | >=65 | I/II | Unknown | Unknown | PD | |
| WNT5A | SNV | Missense_Mutation | c.928N>A | p.Val310Met | p.V310M | P41221 | protein_coding | tolerated(0.13) | benign(0.051) | TCGA-AM-5821-01 | Colorectum | colon adenocarcinoma | Female | >=65 | I/II | Unknown | Unknown | SD |
| Page: 1 2 3 4 5 6 |
Top |
Related drugs of malignant transformation related genes |
| Identification of chemicals and drugs interact with genes involved in malignant transfromation |
| (DGIdb 4.0) |
| Entrez ID | Symbol | Category | Interaction Types | Drug Claim Name | Drug Name | PMIDs |
| Page: 1 |

Copyright 2023-Present -The University of Texas Health Science Center at Houston |