
|
|||||
|
 | |
| |
| |
| |
| |
| |
|
Gene: VPS4A |
Gene summary for VPS4A |
| Gene information | Species | Human | Gene symbol | VPS4A | Gene ID | 27183 |
| Gene name | vacuolar protein sorting 4 homolog A | |
| Gene Alias | CIMDAG | |
| Cytomap | 16q22.1 | |
| Gene Type | protein-coding | GO ID | GO:0000070 | UniProtAcc | A0A024R705 |
Top |
Malignant transformation analysis |
| Identification of the aberrant gene expression in precancerous and cancerous lesions by comparing the gene expression of stem-like cells in diseased tissues with normal stem cells |
| Entrez ID | Symbol | Replicates | Species | Organ | Tissue | Adj P-value | Log2FC | Malignancy |
| 27183 | VPS4A | HTA11_2487_2000001011 | Human | Colorectum | SER | 1.12e-03 | 2.67e-01 | -0.1808 |
| 27183 | VPS4A | HTA11_1938_2000001011 | Human | Colorectum | AD | 4.54e-02 | 2.41e-01 | -0.0811 |
| 27183 | VPS4A | HTA11_347_2000001011 | Human | Colorectum | AD | 4.36e-09 | 2.67e-01 | -0.1954 |
| 27183 | VPS4A | HTA11_411_2000001011 | Human | Colorectum | SER | 3.82e-03 | 4.16e-01 | -0.2602 |
| 27183 | VPS4A | HTA11_83_2000001011 | Human | Colorectum | SER | 4.58e-03 | 2.58e-01 | -0.1526 |
| 27183 | VPS4A | HTA11_696_2000001011 | Human | Colorectum | AD | 3.80e-09 | 2.83e-01 | -0.1464 |
| 27183 | VPS4A | HTA11_866_2000001011 | Human | Colorectum | AD | 2.73e-03 | 1.43e-01 | -0.1001 |
| 27183 | VPS4A | HTA11_1391_2000001011 | Human | Colorectum | AD | 6.00e-06 | 2.82e-01 | -0.059 |
| 27183 | VPS4A | HTA11_2992_2000001011 | Human | Colorectum | SER | 5.34e-03 | 4.37e-01 | -0.1706 |
| 27183 | VPS4A | HTA11_7696_3000711011 | Human | Colorectum | AD | 3.33e-04 | 1.97e-01 | 0.0674 |
| 27183 | VPS4A | HTA11_99999970781_79442 | Human | Colorectum | MSS | 2.53e-02 | 1.71e-01 | 0.294 |
| 27183 | VPS4A | HTA11_99999971662_82457 | Human | Colorectum | MSS | 3.05e-18 | 5.40e-01 | 0.3859 |
| 27183 | VPS4A | HTA11_99999974143_84620 | Human | Colorectum | MSS | 7.27e-04 | 2.55e-01 | 0.3005 |
| 27183 | VPS4A | LZE4T | Human | Esophagus | ESCC | 2.21e-10 | 2.46e-01 | 0.0811 |
| 27183 | VPS4A | LZE7T | Human | Esophagus | ESCC | 8.08e-04 | 1.23e-01 | 0.0667 |
| 27183 | VPS4A | LZE8T | Human | Esophagus | ESCC | 3.82e-02 | -3.35e-02 | 0.067 |
| 27183 | VPS4A | LZE20T | Human | Esophagus | ESCC | 1.72e-03 | 2.75e-01 | 0.0662 |
| 27183 | VPS4A | LZE22D1 | Human | Esophagus | HGIN | 2.01e-04 | 1.48e-01 | 0.0595 |
| 27183 | VPS4A | LZE22T | Human | Esophagus | ESCC | 2.37e-07 | 6.93e-01 | 0.068 |
| 27183 | VPS4A | LZE24T | Human | Esophagus | ESCC | 7.00e-22 | 5.55e-01 | 0.0596 |
| Page: 1 2 3 4 5 6 7 |
| Tissue | Expression Dynamics | Abbreviation |
| Colorectum (GSE201348) |  | FAP: Familial adenomatous polyposis |
| CRC: Colorectal cancer | ||
| Colorectum (HTA11) |  | AD: Adenomas |
| SER: Sessile serrated lesions | ||
| MSI-H: Microsatellite-high colorectal cancer | ||
| MSS: Microsatellite stable colorectal cancer | ||
| Esophagus | 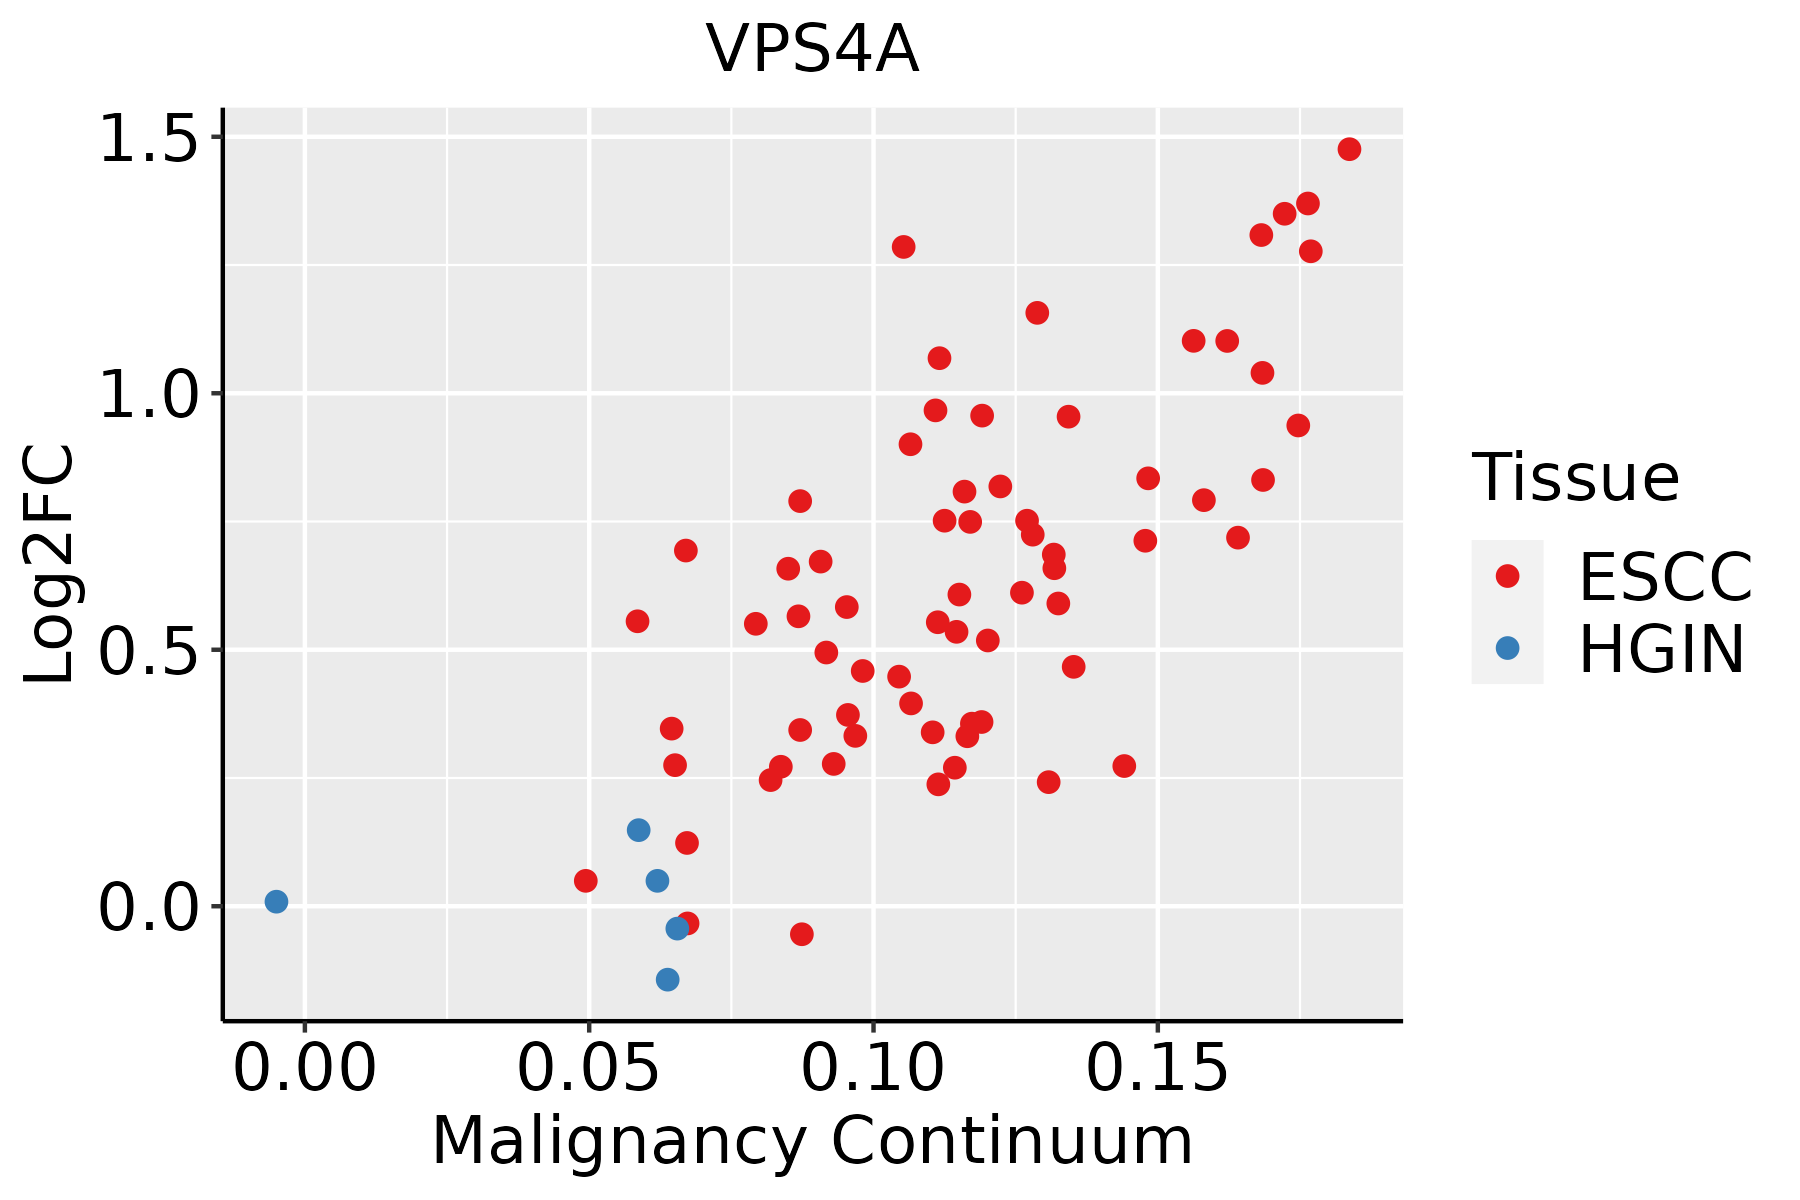 | ESCC: Esophageal squamous cell carcinoma |
| HGIN: High-grade intraepithelial neoplasias | ||
| LGIN: Low-grade intraepithelial neoplasias | ||
| Liver | 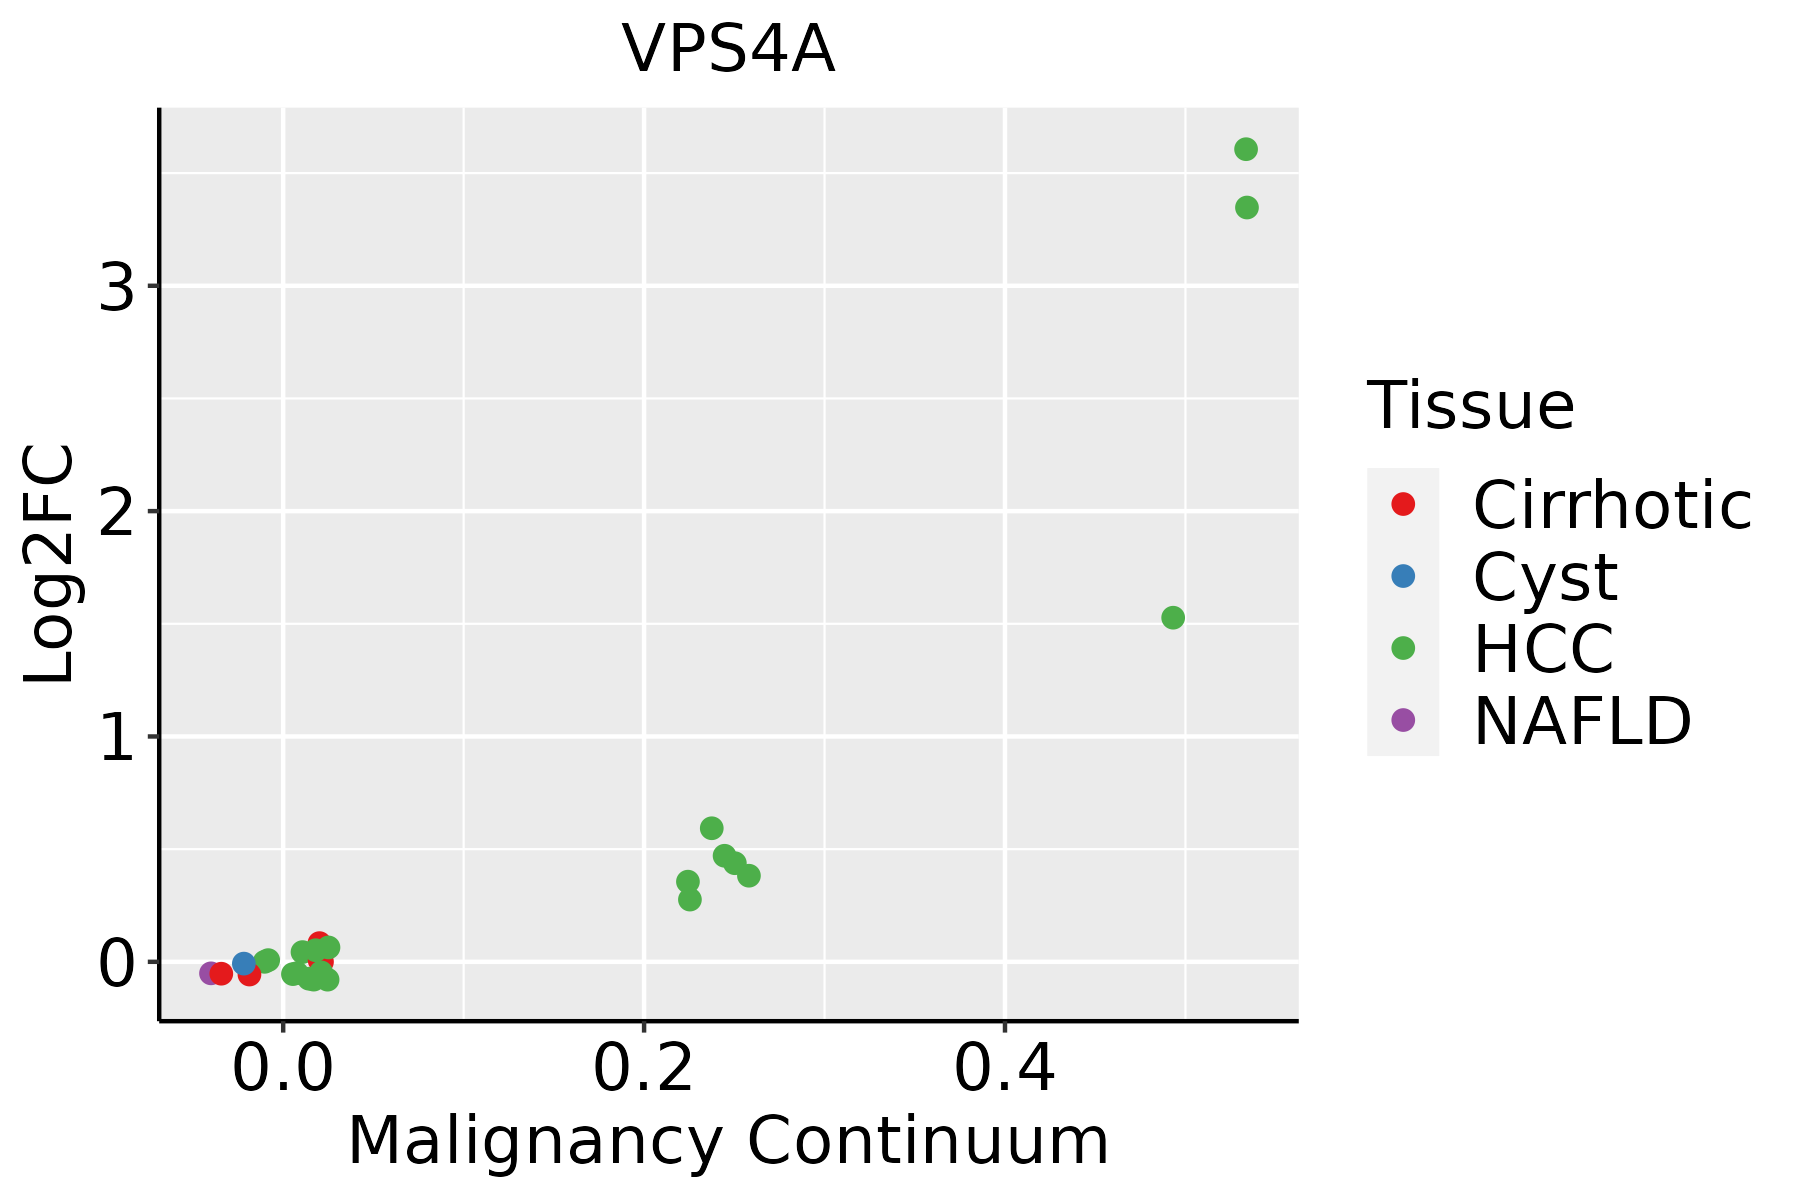 | HCC: Hepatocellular carcinoma |
| NAFLD: Non-alcoholic fatty liver disease | ||
| Oral Cavity | 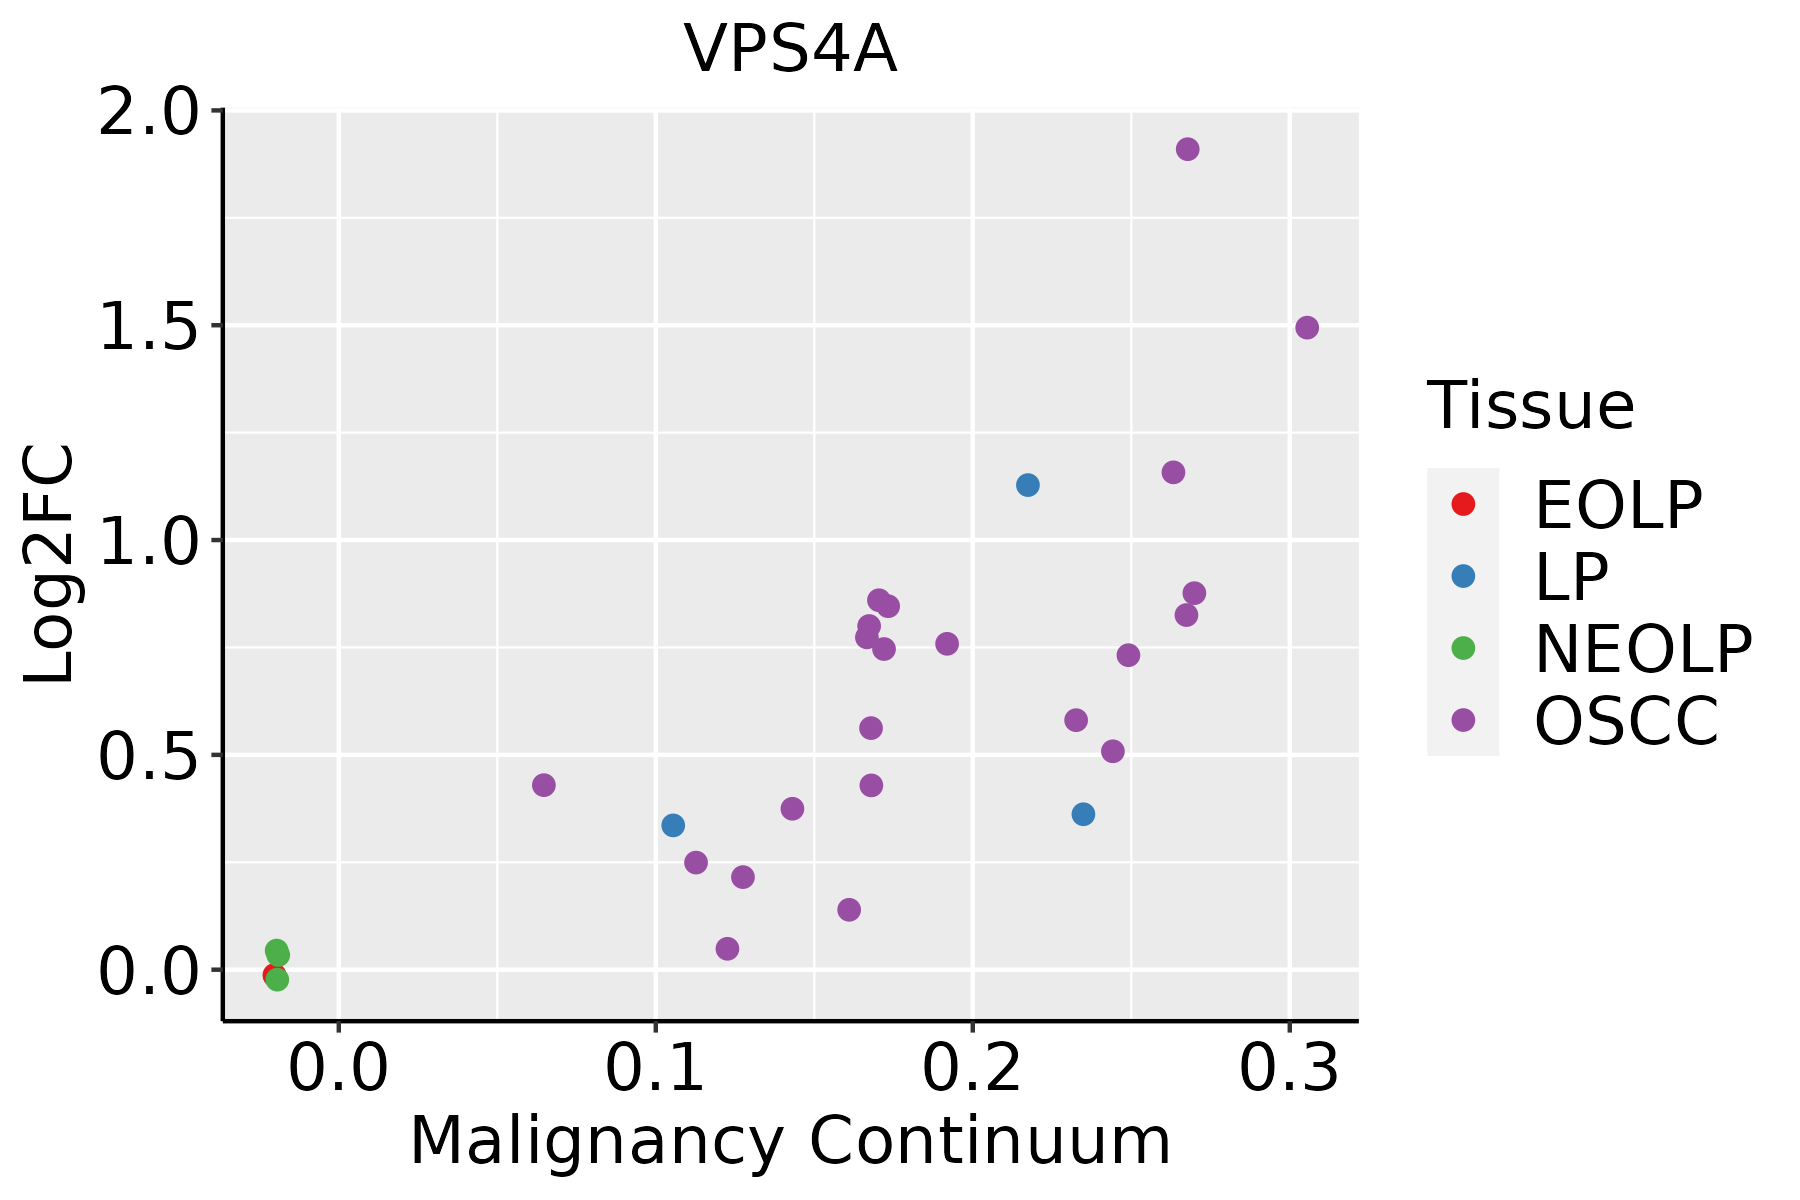 | EOLP: Erosive Oral lichen planus |
| LP: leukoplakia | ||
| NEOLP: Non-erosive oral lichen planus | ||
| OSCC: Oral squamous cell carcinoma | ||
| Skin | 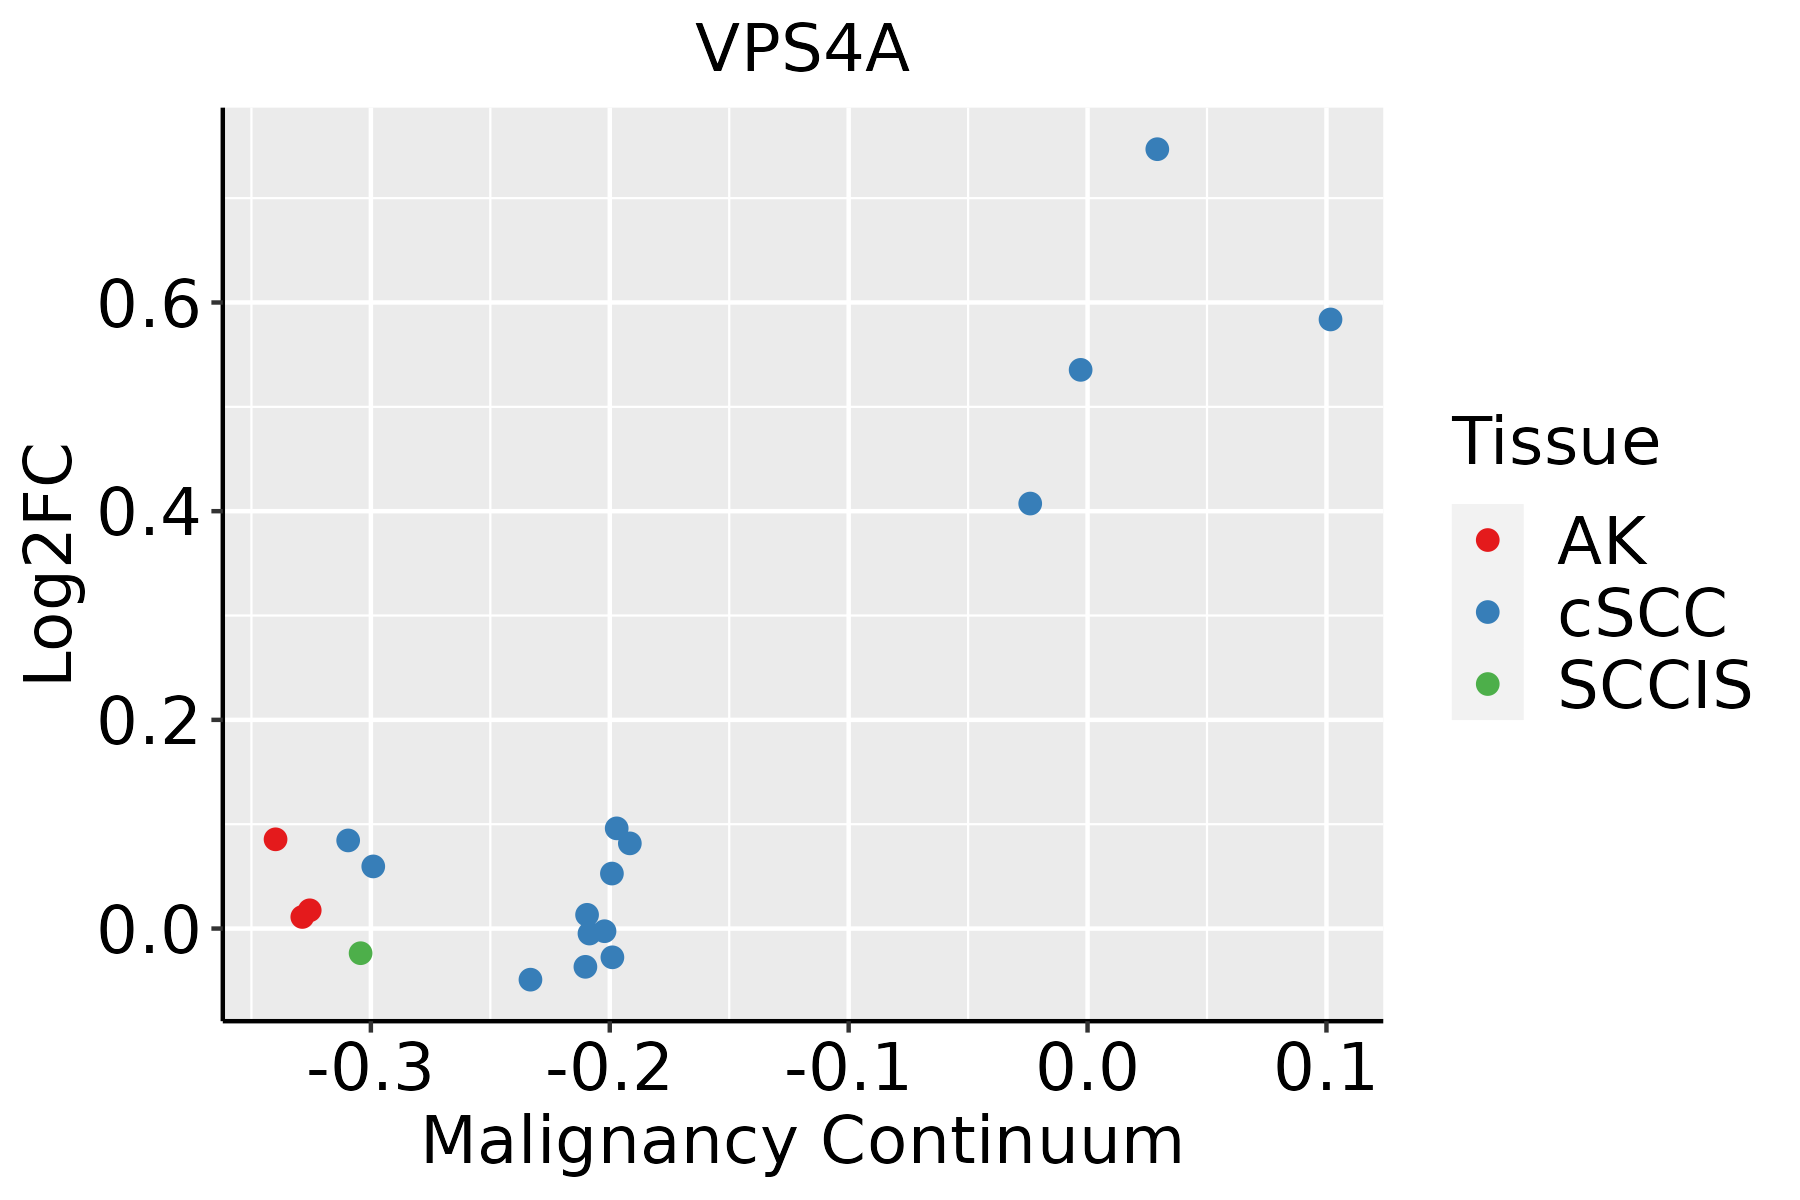 | AK: Actinic keratosis |
| cSCC: Cutaneous squamous cell carcinoma | ||
| SCCIS:squamous cell carcinoma in situ | ||
| Thyroid |  | ATC: Anaplastic thyroid cancer |
| HT: Hashimoto's thyroiditis | ||
| PTC: Papillary thyroid cancer |
| ∗log2FC in expression of this searched gene in stem-like cells from each diseased tissue sample relative to stem-like cells in normal samples in each tissue plotted against the malignancy continuum. Samples are colored based on if they are from different disease stage. |
Top |
Malignant transformation related pathway analysis |
| Find out the enriched GO biological processes and KEGG pathways involved in transition from healthy to precancer to cancer |
| Tissue | Disease Stage | Enriched GO biological Processes |
| Colorectum | AD |  |
| Colorectum | SER |  |
| Colorectum | MSS |  |
| Colorectum | MSI-H |  |
| Colorectum | FAP |  |
| ∗Top 15 enriched GO BP terms are showed in the bar plot of each disease state in each tissue. Each row represents a significant GO biological process which is colored according to the -log10(p.adjust). |
| Page: 1 2 3 4 5 6 7 8 9 |
| GO ID | Tissue | Disease Stage | Description | Gene Ratio | Bg Ratio | pvalue | p.adjust | Count |
| GO:00467552 | Colorectum | MSS | viral budding | 11/3467 | 26/18723 | 4.28e-03 | 3.05e-02 | 11 |
| GO:00070331 | Colorectum | MSS | vacuole organization | 48/3467 | 180/18723 | 4.32e-03 | 3.07e-02 | 48 |
| GO:00482841 | Colorectum | MSS | organelle fusion | 39/3467 | 141/18723 | 4.91e-03 | 3.42e-02 | 39 |
| GO:19024102 | Colorectum | MSS | mitotic cytokinetic process | 10/3467 | 23/18723 | 5.06e-03 | 3.47e-02 | 10 |
| GO:00108761 | Colorectum | MSS | lipid localization | 104/3467 | 448/18723 | 6.76e-03 | 4.38e-02 | 104 |
| GO:00190682 | Colorectum | MSS | virion assembly | 13/3467 | 35/18723 | 7.38e-03 | 4.68e-02 | 13 |
| GO:01400141 | Colorectum | MSS | mitotic nuclear division | 70/3467 | 287/18723 | 7.48e-03 | 4.72e-02 | 70 |
| GO:00325062 | Colorectum | MSS | cytokinetic process | 14/3467 | 39/18723 | 7.79e-03 | 4.84e-02 | 14 |
| GO:19021881 | Colorectum | MSS | positive regulation of viral release from host cell | 6/3467 | 11/18723 | 7.89e-03 | 4.84e-02 | 6 |
| GO:007259420 | Esophagus | HGIN | establishment of protein localization to organelle | 120/2587 | 422/18723 | 1.73e-15 | 4.00e-13 | 120 |
| GO:001603227 | Esophagus | HGIN | viral process | 118/2587 | 415/18723 | 3.01e-15 | 6.22e-13 | 118 |
| GO:001905827 | Esophagus | HGIN | viral life cycle | 93/2587 | 317/18723 | 3.66e-13 | 5.63e-11 | 93 |
| GO:001623616 | Esophagus | HGIN | macroautophagy | 77/2587 | 291/18723 | 7.15e-09 | 4.61e-07 | 77 |
| GO:005079225 | Esophagus | HGIN | regulation of viral process | 50/2587 | 164/18723 | 2.53e-08 | 1.49e-06 | 50 |
| GO:002241120 | Esophagus | HGIN | cellular component disassembly | 102/2587 | 443/18723 | 8.31e-08 | 4.33e-06 | 102 |
| GO:000660525 | Esophagus | HGIN | protein targeting | 78/2587 | 314/18723 | 1.08e-07 | 5.47e-06 | 78 |
| GO:190390025 | Esophagus | HGIN | regulation of viral life cycle | 45/2587 | 148/18723 | 1.36e-07 | 6.78e-06 | 45 |
| GO:005165616 | Esophagus | HGIN | establishment of organelle localization | 90/2587 | 390/18723 | 4.27e-07 | 1.94e-05 | 90 |
| GO:004852419 | Esophagus | HGIN | positive regulation of viral process | 25/2587 | 65/18723 | 6.88e-07 | 2.95e-05 | 25 |
| GO:004440326 | Esophagus | HGIN | biological process involved in symbiotic interaction | 71/2587 | 290/18723 | 7.09e-07 | 3.00e-05 | 71 |
| Page: 1 2 3 4 5 6 7 8 9 10 11 12 13 14 15 16 17 18 19 20 21 22 23 24 25 26 27 28 29 30 31 32 33 34 35 36 37 38 39 40 41 42 43 44 45 46 47 |
| Pathway ID | Tissue | Disease Stage | Description | Gene Ratio | Bg Ratio | pvalue | p.adjust | qvalue | Count |
| hsa04144 | Colorectum | AD | Endocytosis | 111/2092 | 251/8465 | 5.95e-12 | 1.42e-10 | 9.08e-11 | 111 |
| hsa041441 | Colorectum | AD | Endocytosis | 111/2092 | 251/8465 | 5.95e-12 | 1.42e-10 | 9.08e-11 | 111 |
| hsa041442 | Colorectum | SER | Endocytosis | 81/1580 | 251/8465 | 1.14e-07 | 2.36e-06 | 1.71e-06 | 81 |
| hsa04217 | Colorectum | SER | Necroptosis | 47/1580 | 159/8465 | 5.21e-04 | 4.44e-03 | 3.22e-03 | 47 |
| hsa041443 | Colorectum | SER | Endocytosis | 81/1580 | 251/8465 | 1.14e-07 | 2.36e-06 | 1.71e-06 | 81 |
| hsa042171 | Colorectum | SER | Necroptosis | 47/1580 | 159/8465 | 5.21e-04 | 4.44e-03 | 3.22e-03 | 47 |
| hsa041444 | Colorectum | MSS | Endocytosis | 102/1875 | 251/8465 | 1.85e-11 | 4.43e-10 | 2.71e-10 | 102 |
| hsa03250 | Colorectum | MSS | Viral life cycle - HIV-1 | 23/1875 | 63/8465 | 6.55e-03 | 2.64e-02 | 1.62e-02 | 23 |
| hsa041445 | Colorectum | MSS | Endocytosis | 102/1875 | 251/8465 | 1.85e-11 | 4.43e-10 | 2.71e-10 | 102 |
| hsa032501 | Colorectum | MSS | Viral life cycle - HIV-1 | 23/1875 | 63/8465 | 6.55e-03 | 2.64e-02 | 1.62e-02 | 23 |
| hsa0414429 | Esophagus | HGIN | Endocytosis | 76/1383 | 251/8465 | 1.74e-08 | 3.34e-07 | 2.65e-07 | 76 |
| hsa04144113 | Esophagus | HGIN | Endocytosis | 76/1383 | 251/8465 | 1.74e-08 | 3.34e-07 | 2.65e-07 | 76 |
| hsa04144210 | Esophagus | ESCC | Endocytosis | 186/4205 | 251/8465 | 9.74e-16 | 4.66e-14 | 2.39e-14 | 186 |
| hsa032509 | Esophagus | ESCC | Viral life cycle - HIV-1 | 54/4205 | 63/8465 | 2.01e-09 | 2.17e-08 | 1.11e-08 | 54 |
| hsa0414437 | Esophagus | ESCC | Endocytosis | 186/4205 | 251/8465 | 9.74e-16 | 4.66e-14 | 2.39e-14 | 186 |
| hsa0325014 | Esophagus | ESCC | Viral life cycle - HIV-1 | 54/4205 | 63/8465 | 2.01e-09 | 2.17e-08 | 1.11e-08 | 54 |
| hsa0414422 | Liver | HCC | Endocytosis | 178/4020 | 251/8465 | 2.03e-14 | 5.22e-13 | 2.91e-13 | 178 |
| hsa032502 | Liver | HCC | Viral life cycle - HIV-1 | 46/4020 | 63/8465 | 3.25e-05 | 1.88e-04 | 1.04e-04 | 46 |
| hsa0414432 | Liver | HCC | Endocytosis | 178/4020 | 251/8465 | 2.03e-14 | 5.22e-13 | 2.91e-13 | 178 |
| hsa0325011 | Liver | HCC | Viral life cycle - HIV-1 | 46/4020 | 63/8465 | 3.25e-05 | 1.88e-04 | 1.04e-04 | 46 |
| Page: 1 2 |
Top |
Cell-cell communication analysis |
| Identification of potential cell-cell interactions between two cell types and their ligand-receptor pairs for different disease states |
| Ligand | Receptor | LRpair | Pathway | Tissue | Disease Stage |
| Page: 1 |
Top |
Single-cell gene regulatory network inference analysis |
| Find out the significant the regulons (TFs) and the target genes of each regulon across cell types for different disease states |
| TF | Cell Type | Tissue | Disease Stage | Target Gene | RSS | Regulon Activity |
| ∗The dot plots of a searched regulon are shown for all cell subpopulations in each disease state of each tissue based on the regulon specific score inferred using pySCENIC and by calculating the average expression. |
| Page: 1 |
Top |
Somatic mutation of malignant transformation related genes |
| Annotation of somatic variants for genes involved in malignant transformation |
| Hugo Symbol | Variant Class | Variant Classification | dbSNP RS | HGVSc | HGVSp | HGVSp Short | SWISSPROT | BIOTYPE | SIFT | PolyPhen | Tumor Sample Barcode | Tissue | Histology | Sex | Age | Stage | Therapy Types | Drugs | Outcome |
| VPS4A | SNV | Missense_Mutation | novel | c.940C>G | p.Leu314Val | p.L314V | Q9UN37 | protein_coding | deleterious(0) | benign(0.076) | TCGA-3C-AALI-01 | Breast | breast invasive carcinoma | Female | <65 | I/II | Unspecific | Poly E | Complete Response |
| VPS4A | SNV | Missense_Mutation | rs757227102 | c.52G>A | p.Glu18Lys | p.E18K | Q9UN37 | protein_coding | tolerated(0.11) | possibly_damaging(0.595) | TCGA-A2-A0YD-01 | Breast | breast invasive carcinoma | Female | <65 | I/II | Chemotherapy | cytoxan | SD |
| VPS4A | SNV | Missense_Mutation | c.1135N>G | p.Pro379Ala | p.P379A | Q9UN37 | protein_coding | deleterious(0.03) | possibly_damaging(0.839) | TCGA-E2-A1B6-01 | Breast | breast invasive carcinoma | Female | <65 | I/II | Unspecific | Adriamycin | SD | |
| VPS4A | insertion | Nonsense_Mutation | novel | c.158_159insCATGGTGAAACTCTGTCTGCACTAAAAATACAAAAATTAGCC | p.Lys53delinsAsnMetValLysLeuCysLeuHisTerLysTyrLysAsnTerPro | p.K53delinsNMVKLCLH*KYKN*P | Q9UN37 | protein_coding | TCGA-AQ-A04J-01 | Breast | breast invasive carcinoma | Female | <65 | I/II | Chemotherapy | cytoxan | SD | ||
| VPS4A | insertion | Nonsense_Mutation | novel | c.476_477insAGGCTGAAGGGCCAGCTTGTGACTTTCCGTCT | p.Trp160GlyfsTer2 | p.W160Gfs*2 | Q9UN37 | protein_coding | TCGA-AR-A0TY-01 | Breast | breast invasive carcinoma | Female | <65 | I/II | Unspecific | Paclitaxel | PD | ||
| VPS4A | SNV | Missense_Mutation | novel | c.733C>T | p.Arg245Trp | p.R245W | Q9UN37 | protein_coding | deleterious(0) | probably_damaging(1) | TCGA-2W-A8YY-01 | Cervix | cervical & endocervical cancer | Female | <65 | I/II | Chemotherapy | cisplatin | CR |
| VPS4A | SNV | Missense_Mutation | novel | c.944C>T | p.Thr315Met | p.T315M | Q9UN37 | protein_coding | deleterious(0) | benign(0.276) | TCGA-2W-A8YY-01 | Cervix | cervical & endocervical cancer | Female | <65 | I/II | Chemotherapy | cisplatin | CR |
| VPS4A | SNV | Missense_Mutation | c.802N>T | p.Leu268Phe | p.L268F | Q9UN37 | protein_coding | deleterious(0) | probably_damaging(0.996) | TCGA-IR-A3LL-01 | Cervix | cervical & endocervical cancer | Female | <65 | I/II | Chemotherapy | cisplatin | CR | |
| VPS4A | SNV | Missense_Mutation | c.441N>G | p.Ile147Met | p.I147M | Q9UN37 | protein_coding | tolerated(0.09) | benign(0.097) | TCGA-JX-A3Q0-01 | Cervix | cervical & endocervical cancer | Female | <65 | III/IV | Unknown | Unknown | SD | |
| VPS4A | SNV | Missense_Mutation | c.632N>G | p.Asn211Ser | p.N211S | Q9UN37 | protein_coding | tolerated(0.26) | benign(0.005) | TCGA-AA-3663-01 | Colorectum | colon adenocarcinoma | Male | <65 | I/II | Unknown | Unknown | SD |
| Page: 1 2 3 4 5 |
Top |
Related drugs of malignant transformation related genes |
| Identification of chemicals and drugs interact with genes involved in malignant transfromation |
| (DGIdb 4.0) |
| Entrez ID | Symbol | Category | Interaction Types | Drug Claim Name | Drug Name | PMIDs |
| Page: 1 |

Copyright 2023-Present -The University of Texas Health Science Center at Houston |