
|
|||||
|
 | |
| |
| |
| |
| |
| |
|
Gene: VAMP8 |
Gene summary for VAMP8 |
| Gene information | Species | Human | Gene symbol | VAMP8 | Gene ID | 8673 |
| Gene name | vesicle associated membrane protein 8 | |
| Gene Alias | EDB | |
| Cytomap | 2p11.2 | |
| Gene Type | protein-coding | GO ID | GO:0001775 | UniProtAcc | Q9BV40 |
Top |
Malignant transformation analysis |
| Identification of the aberrant gene expression in precancerous and cancerous lesions by comparing the gene expression of stem-like cells in diseased tissues with normal stem cells |
| Entrez ID | Symbol | Replicates | Species | Organ | Tissue | Adj P-value | Log2FC | Malignancy |
| 8673 | VAMP8 | CA_HPV_1 | Human | Cervix | CC | 2.02e-09 | 1.13e-01 | 0.0264 |
| 8673 | VAMP8 | CA_HPV_3 | Human | Cervix | CC | 1.90e-04 | 4.12e-02 | 0.0414 |
| 8673 | VAMP8 | CCI_1 | Human | Cervix | CC | 1.49e-11 | -9.00e-01 | 0.528 |
| 8673 | VAMP8 | CCI_3 | Human | Cervix | CC | 8.00e-16 | -9.31e-01 | 0.516 |
| 8673 | VAMP8 | CCII_1 | Human | Cervix | CC | 3.12e-24 | -9.71e-01 | 0.3249 |
| 8673 | VAMP8 | sample1 | Human | Cervix | CC | 4.83e-04 | -5.50e-01 | 0.0959 |
| 8673 | VAMP8 | sample3 | Human | Cervix | CC | 1.02e-05 | 1.36e-01 | 0.1387 |
| 8673 | VAMP8 | T1 | Human | Cervix | CC | 1.44e-14 | -6.21e-01 | 0.0918 |
| 8673 | VAMP8 | T3 | Human | Cervix | CC | 1.89e-02 | 1.42e-01 | 0.1389 |
| 8673 | VAMP8 | HTA11_3410_2000001011 | Human | Colorectum | AD | 3.13e-09 | 2.62e-01 | 0.0155 |
| 8673 | VAMP8 | HTA11_2487_2000001011 | Human | Colorectum | SER | 2.87e-37 | 1.57e+00 | -0.1808 |
| 8673 | VAMP8 | HTA11_2951_2000001011 | Human | Colorectum | AD | 3.40e-03 | 4.09e-01 | 0.0216 |
| 8673 | VAMP8 | HTA11_1938_2000001011 | Human | Colorectum | AD | 3.85e-21 | 9.68e-01 | -0.0811 |
| 8673 | VAMP8 | HTA11_78_2000001011 | Human | Colorectum | AD | 9.21e-05 | 2.84e-01 | -0.1088 |
| 8673 | VAMP8 | HTA11_347_2000001011 | Human | Colorectum | AD | 5.43e-36 | 9.15e-01 | -0.1954 |
| 8673 | VAMP8 | HTA11_411_2000001011 | Human | Colorectum | SER | 4.64e-20 | 2.26e+00 | -0.2602 |
| 8673 | VAMP8 | HTA11_2112_2000001011 | Human | Colorectum | SER | 2.76e-16 | 1.68e+00 | -0.2196 |
| 8673 | VAMP8 | HTA11_3361_2000001011 | Human | Colorectum | AD | 1.32e-16 | 7.48e-01 | -0.1207 |
| 8673 | VAMP8 | HTA11_83_2000001011 | Human | Colorectum | SER | 4.59e-20 | 1.04e+00 | -0.1526 |
| 8673 | VAMP8 | HTA11_696_2000001011 | Human | Colorectum | AD | 1.24e-43 | 1.16e+00 | -0.1464 |
| Page: 1 2 3 4 5 6 7 8 9 10 11 |
| Tissue | Expression Dynamics | Abbreviation |
| Cervix | 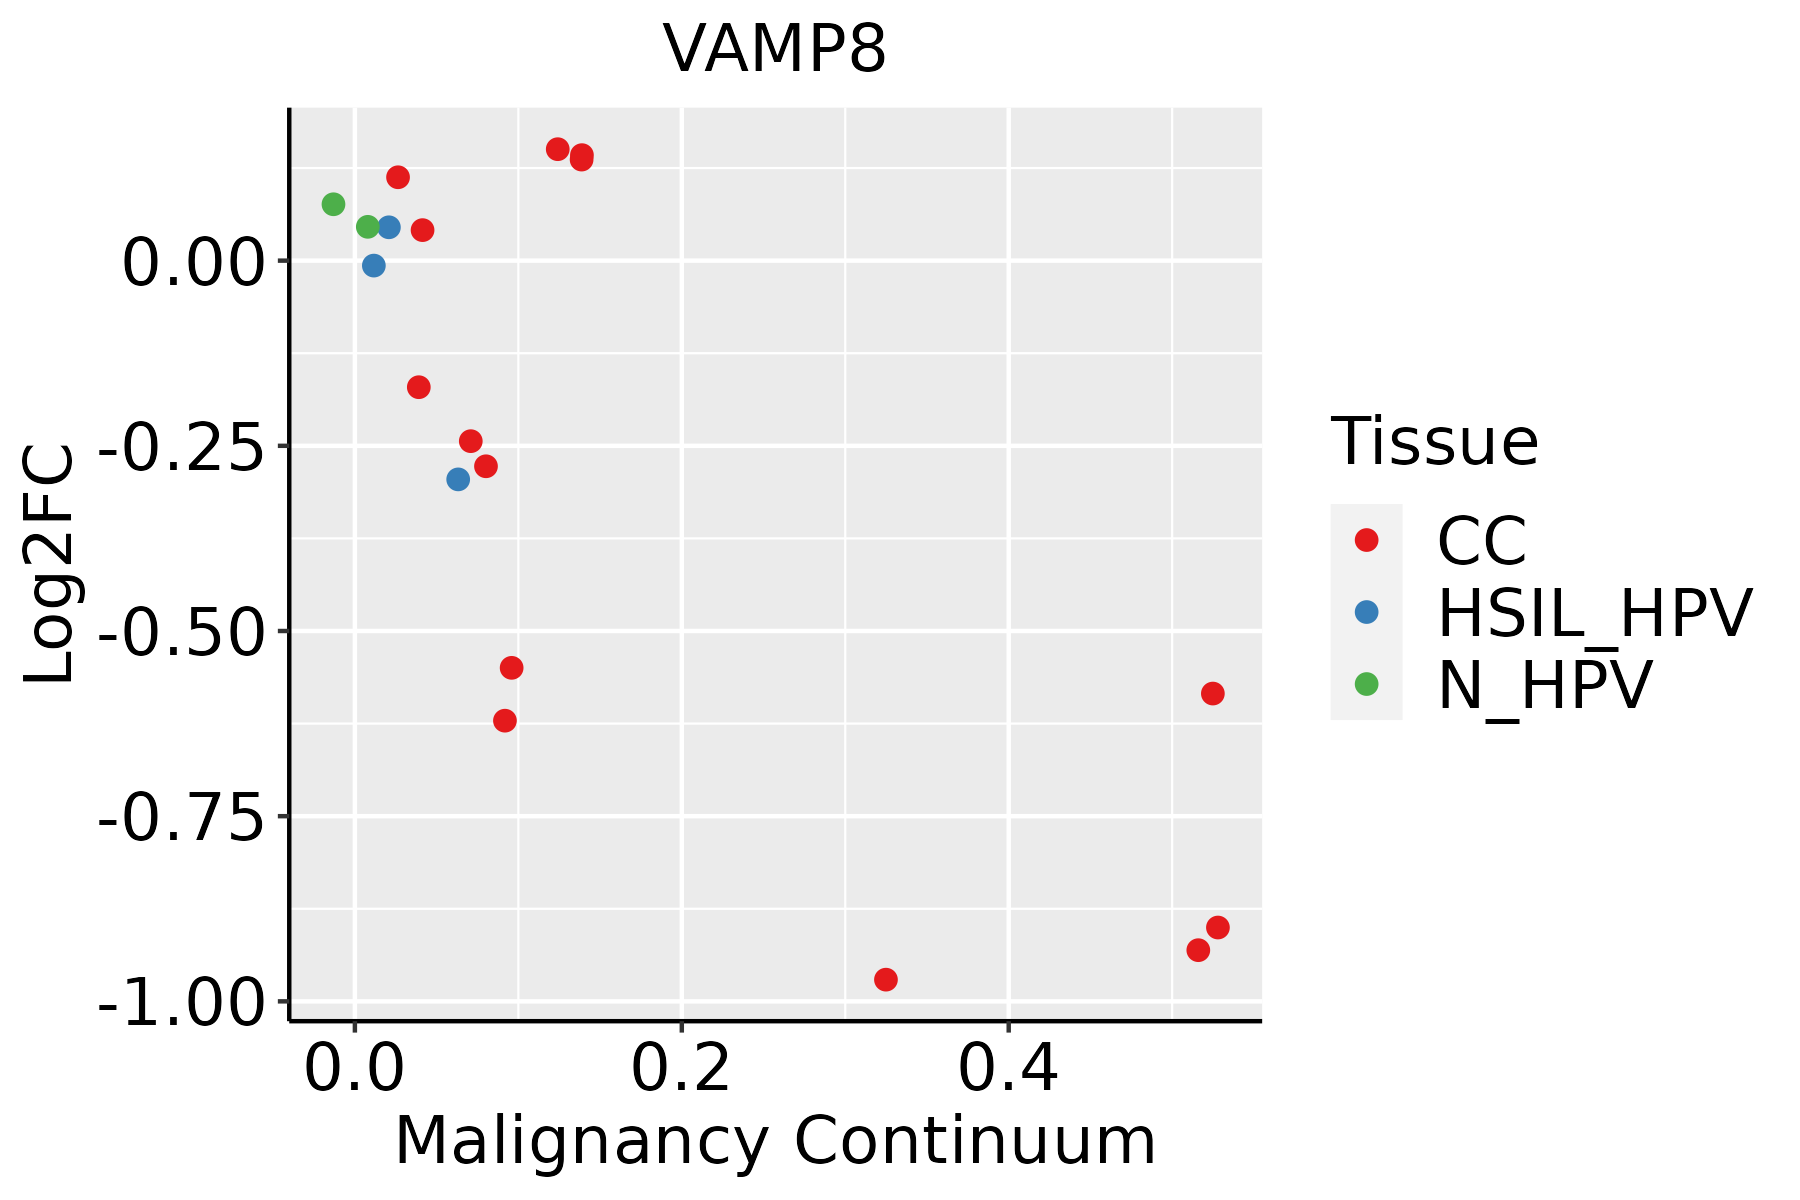 | CC: Cervix cancer |
| HSIL_HPV: HPV-infected high-grade squamous intraepithelial lesions | ||
| N_HPV: HPV-infected normal cervix | ||
| Colorectum (GSE201348) |  | FAP: Familial adenomatous polyposis |
| CRC: Colorectal cancer | ||
| Colorectum (HTA11) | 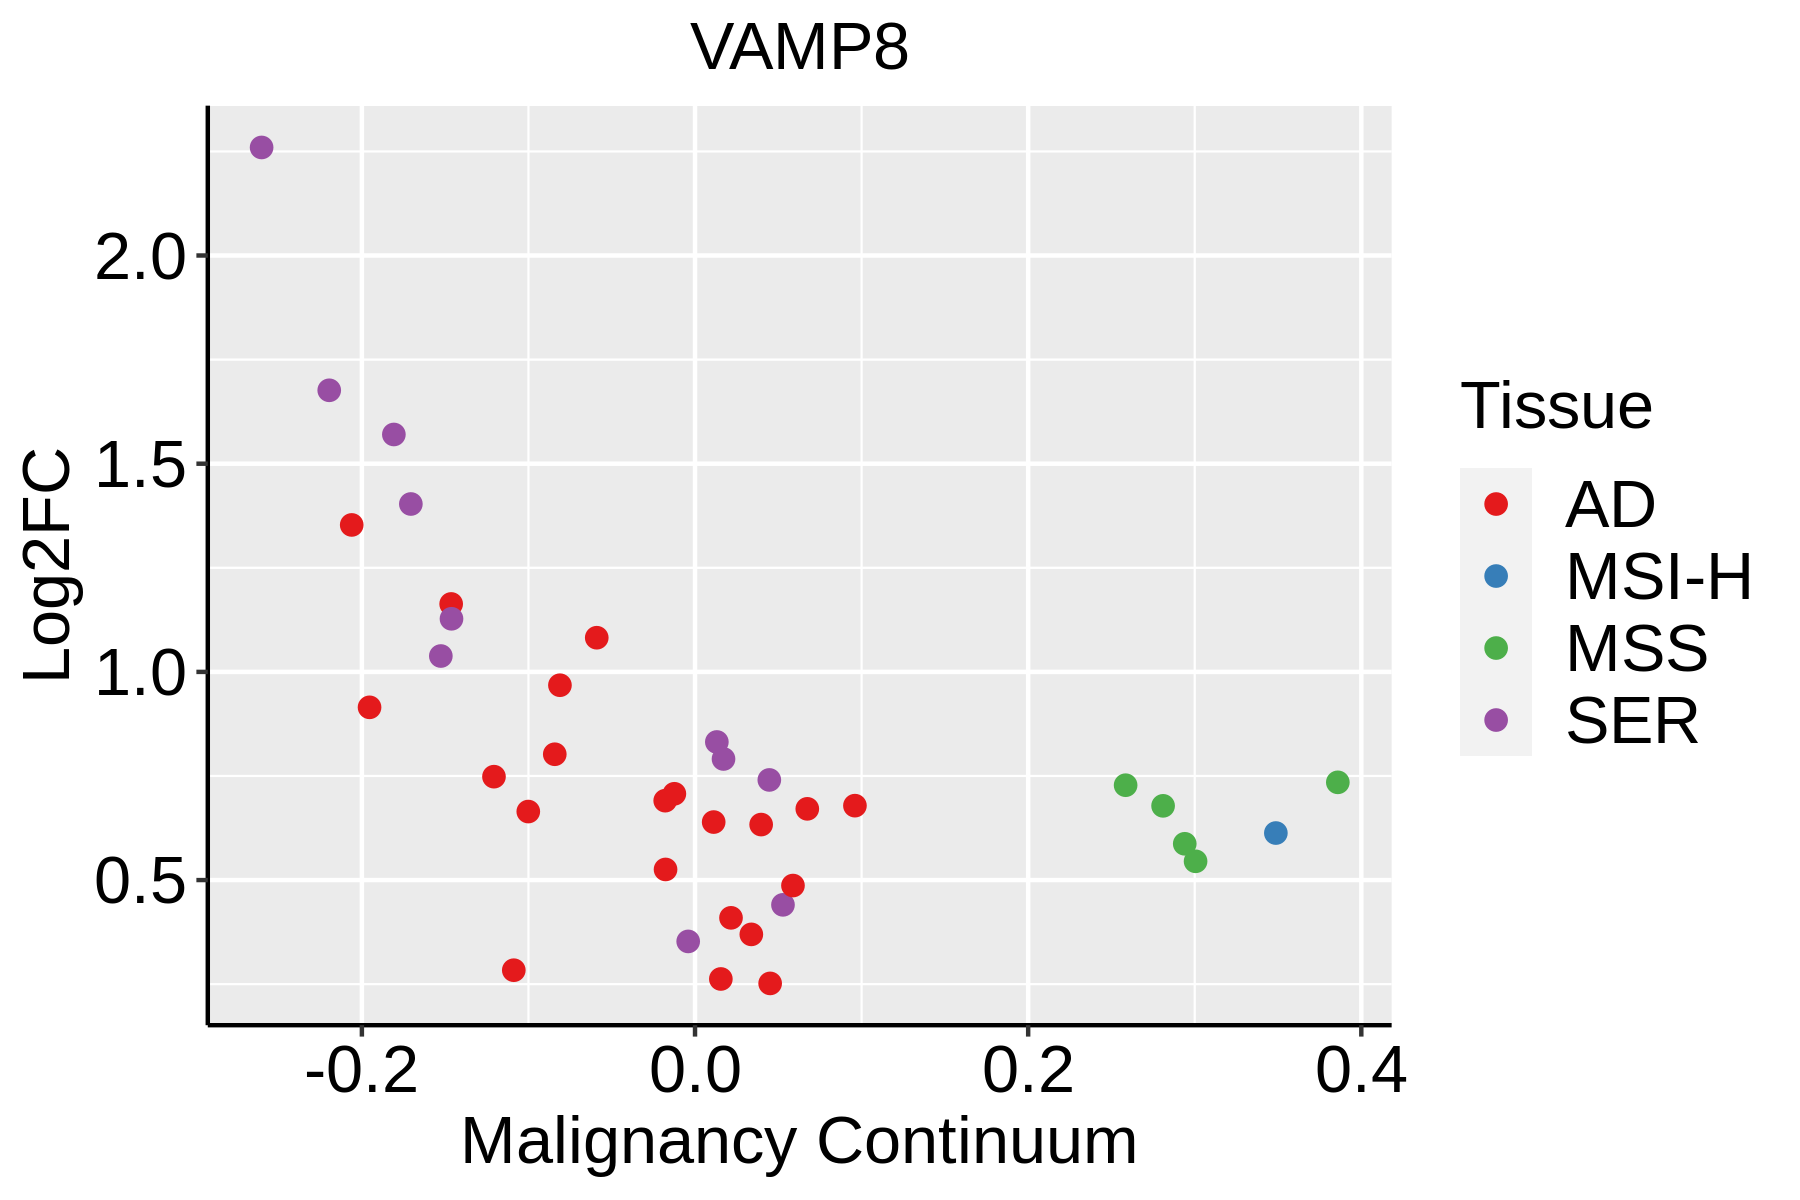 | AD: Adenomas |
| SER: Sessile serrated lesions | ||
| MSI-H: Microsatellite-high colorectal cancer | ||
| MSS: Microsatellite stable colorectal cancer | ||
| Esophagus | 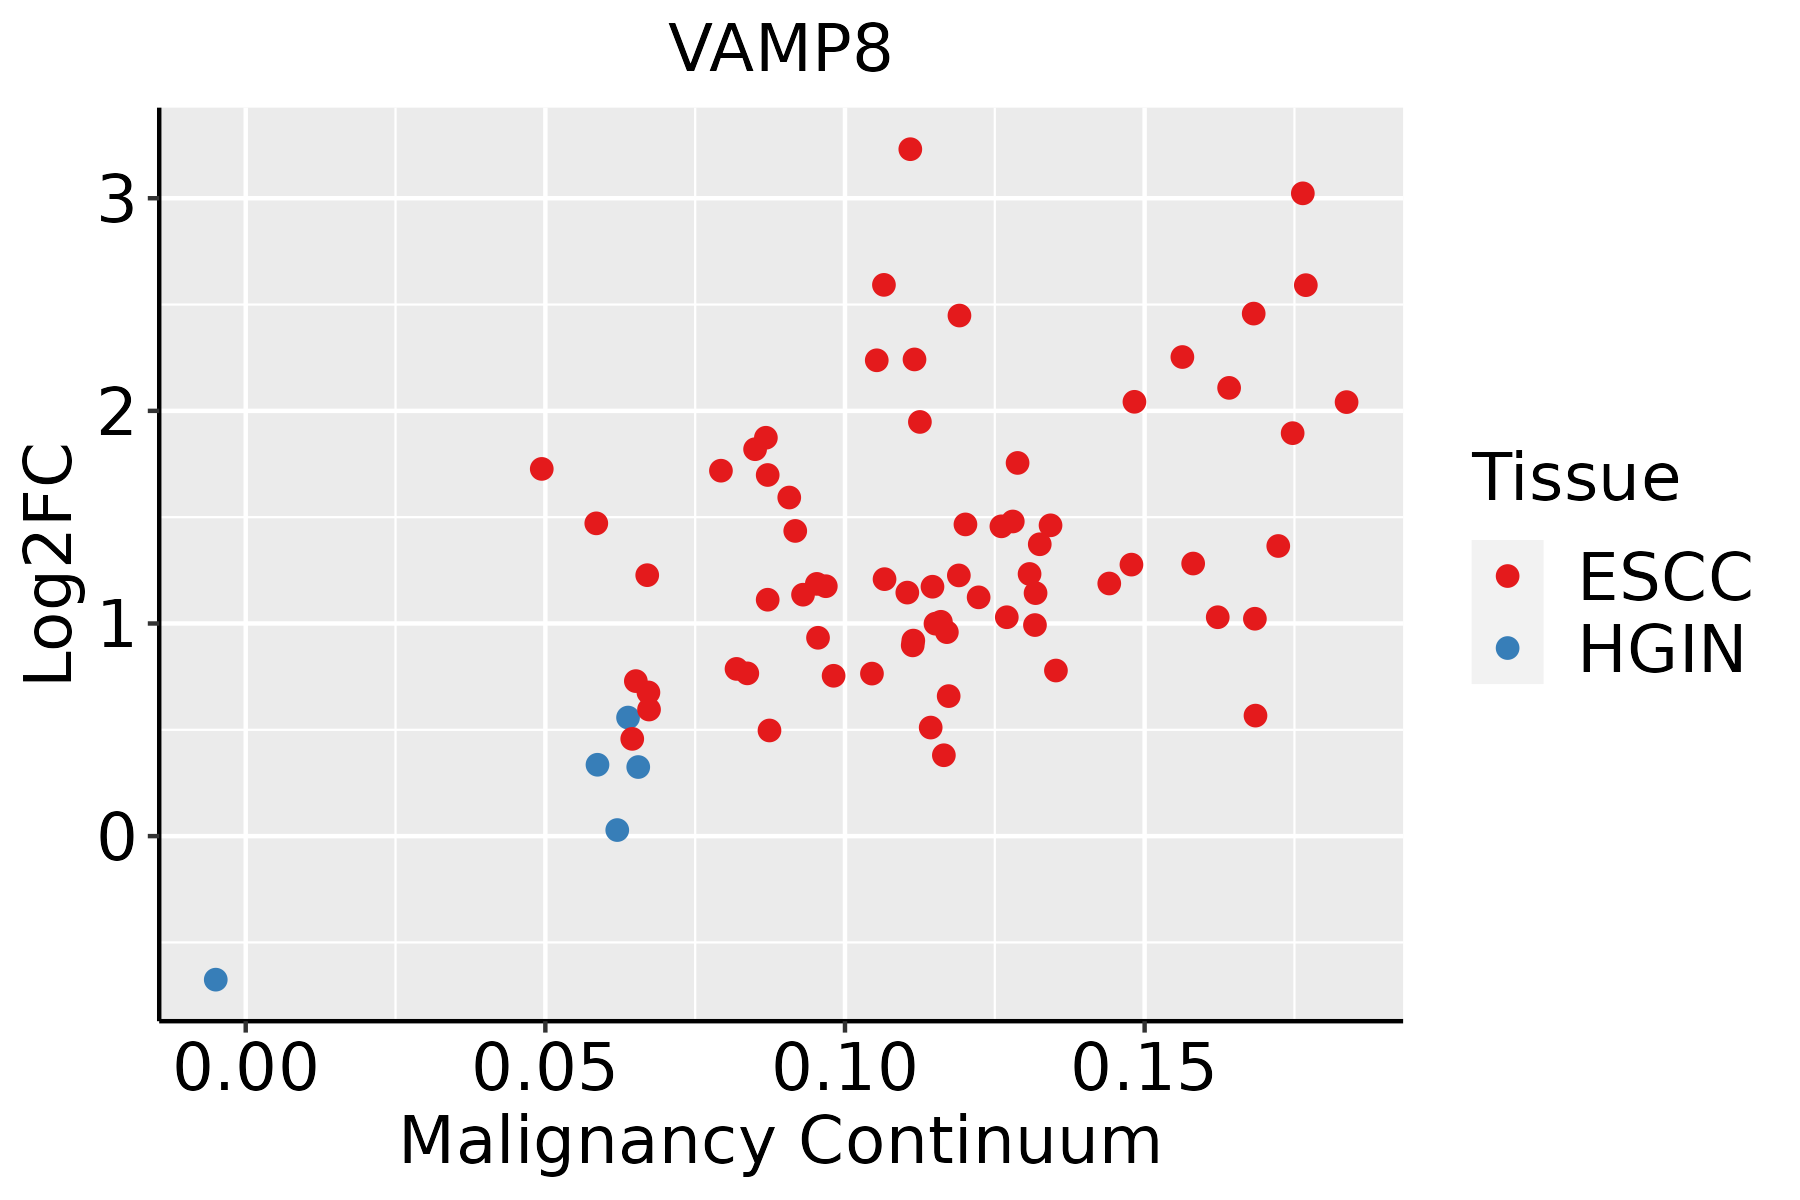 | ESCC: Esophageal squamous cell carcinoma |
| HGIN: High-grade intraepithelial neoplasias | ||
| LGIN: Low-grade intraepithelial neoplasias | ||
| Liver | 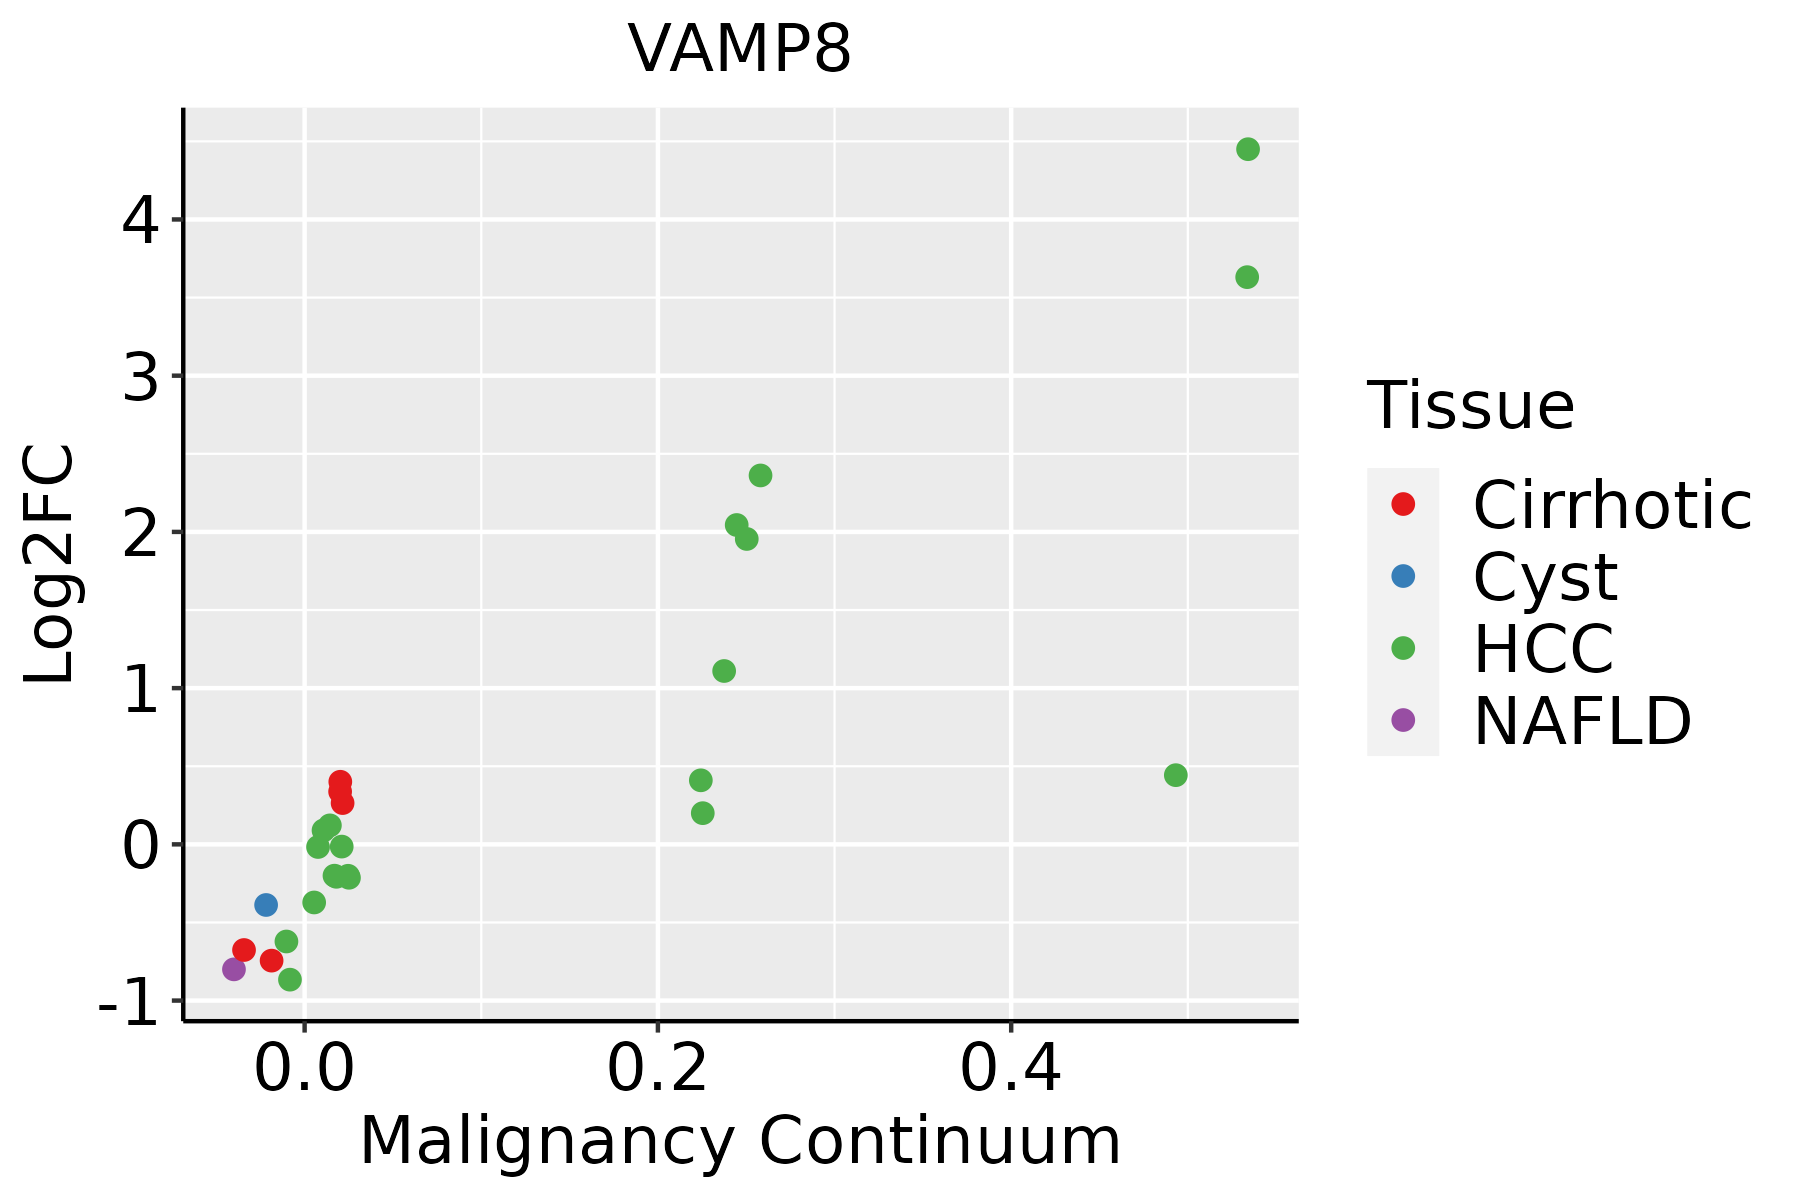 | HCC: Hepatocellular carcinoma |
| NAFLD: Non-alcoholic fatty liver disease | ||
| Oral Cavity | 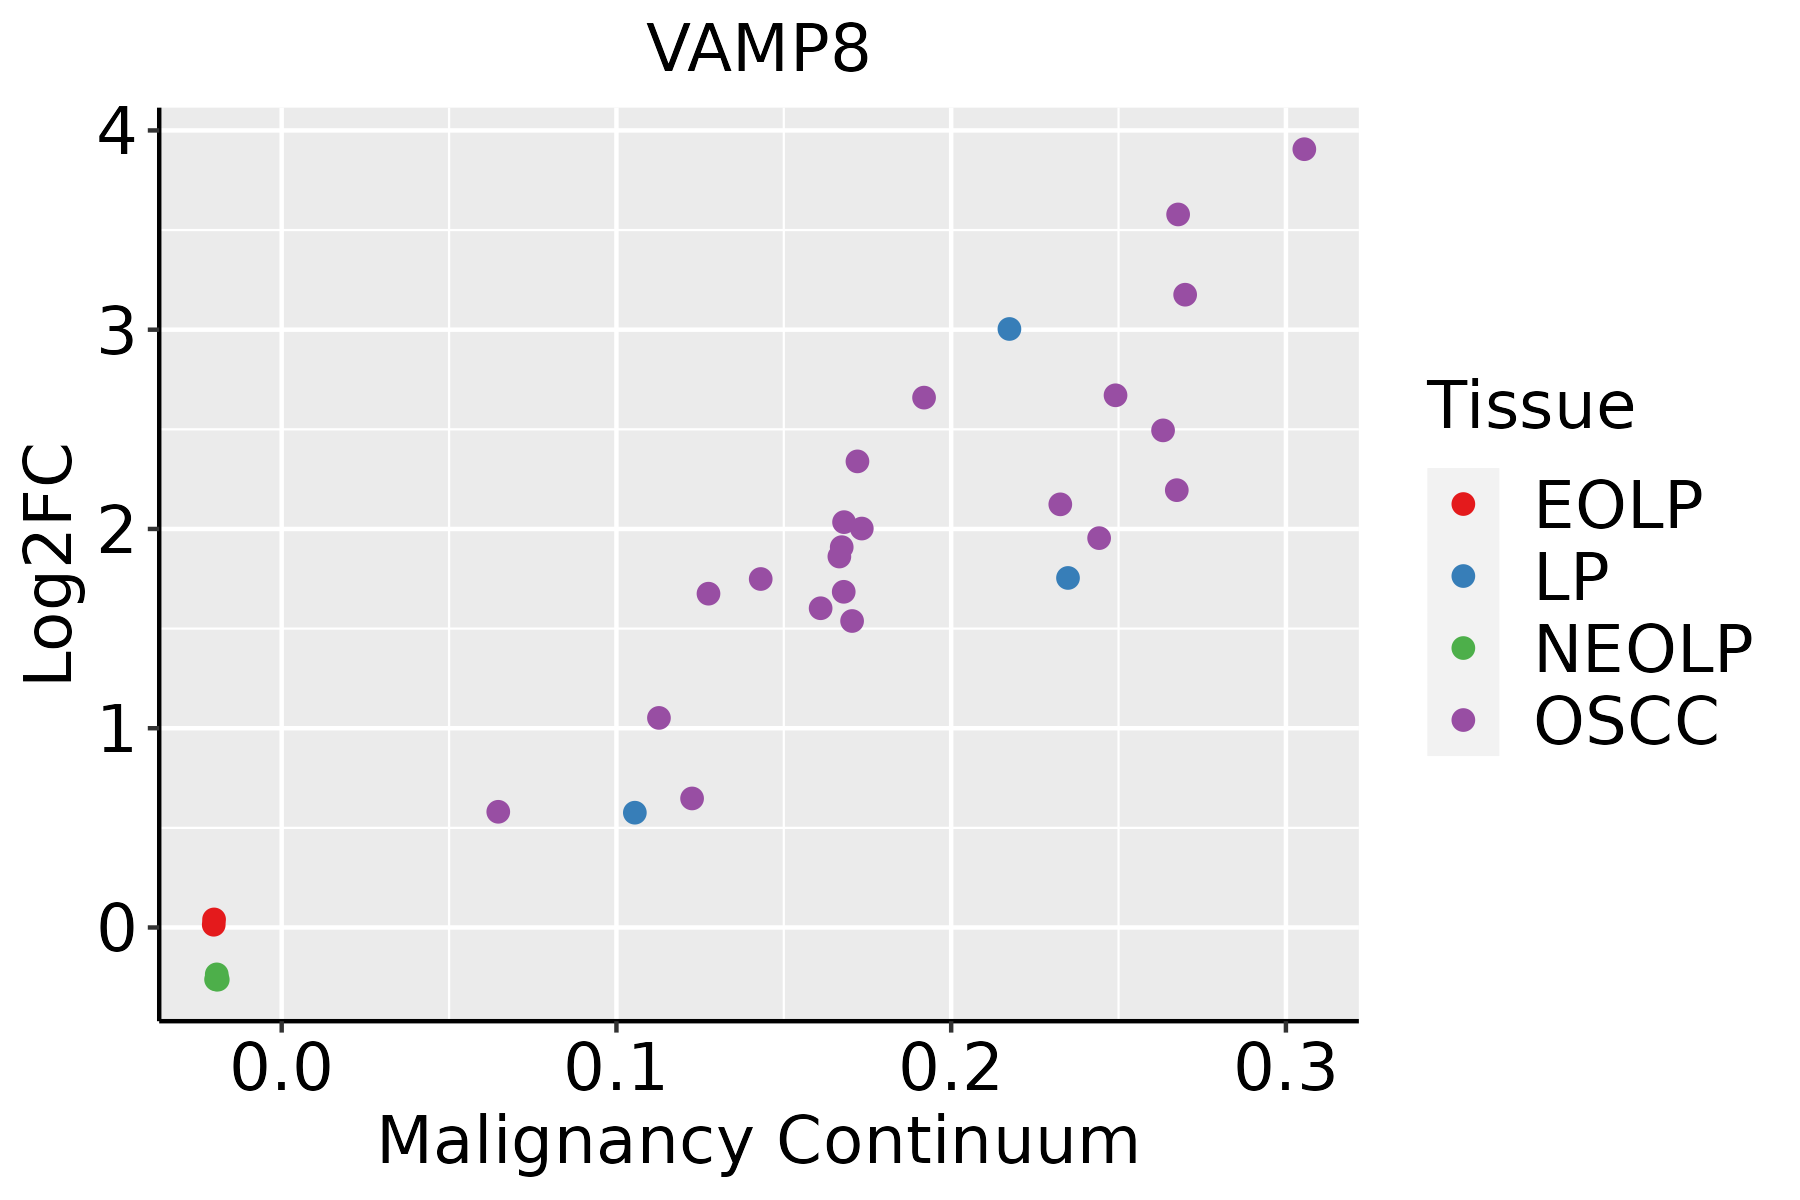 | EOLP: Erosive Oral lichen planus |
| LP: leukoplakia | ||
| NEOLP: Non-erosive oral lichen planus | ||
| OSCC: Oral squamous cell carcinoma | ||
| Prostate | 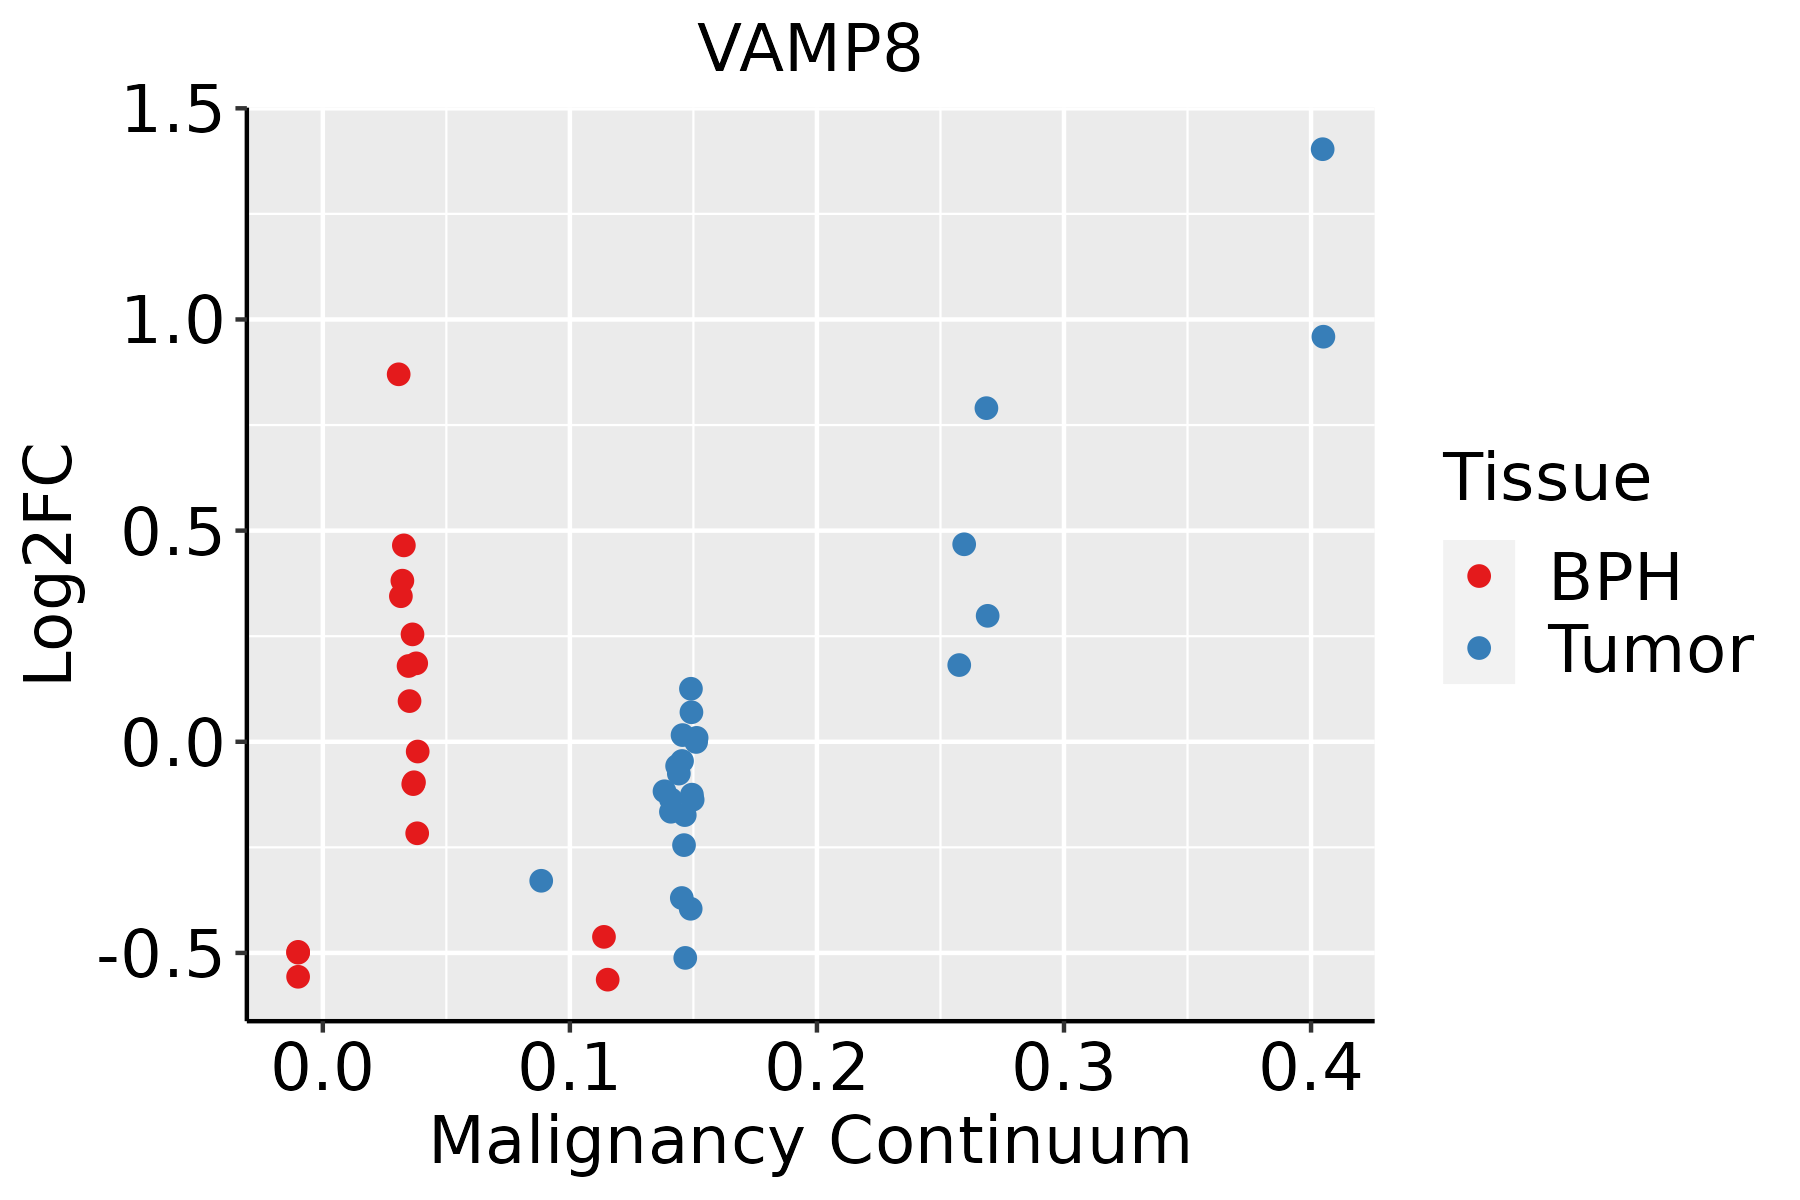 | BPH: Benign Prostatic Hyperplasia |
| Skin | 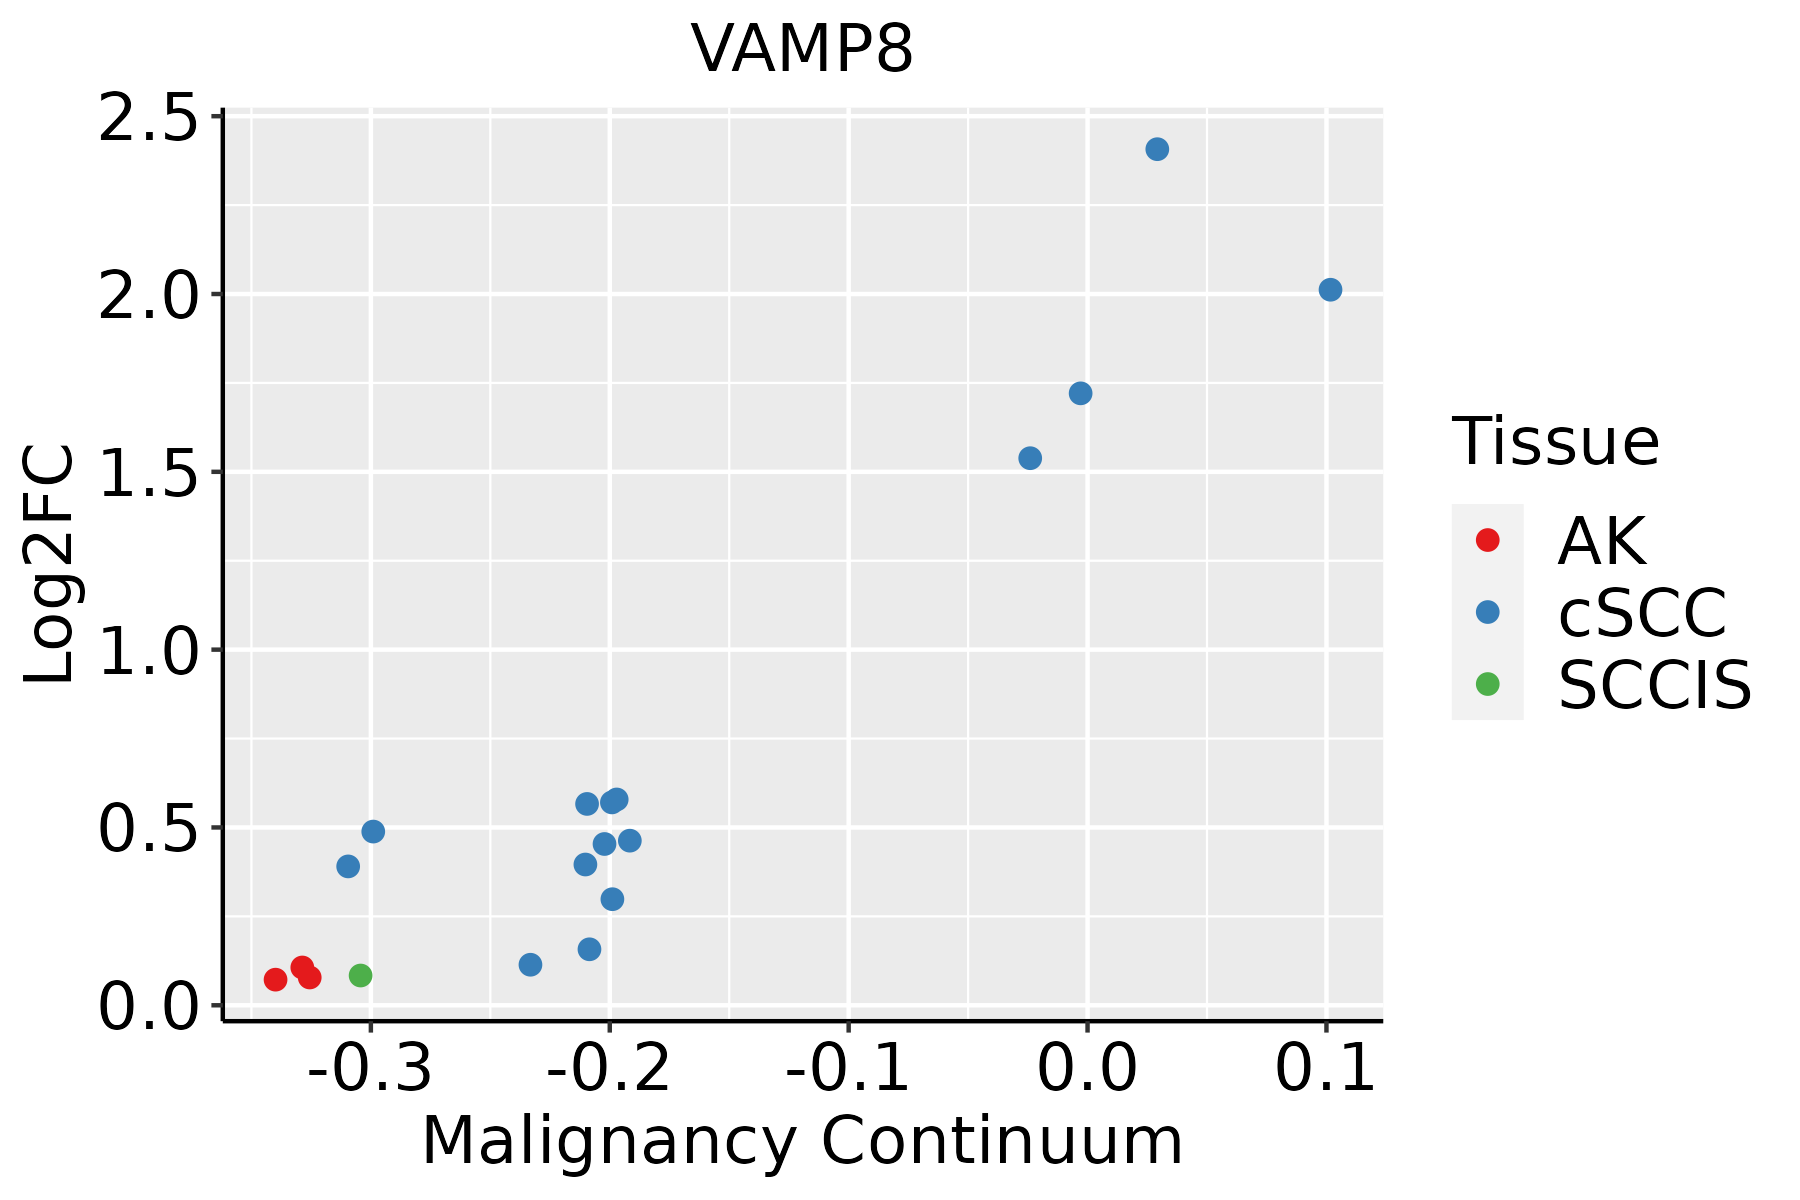 | AK: Actinic keratosis |
| cSCC: Cutaneous squamous cell carcinoma | ||
| SCCIS:squamous cell carcinoma in situ | ||
| Thyroid | 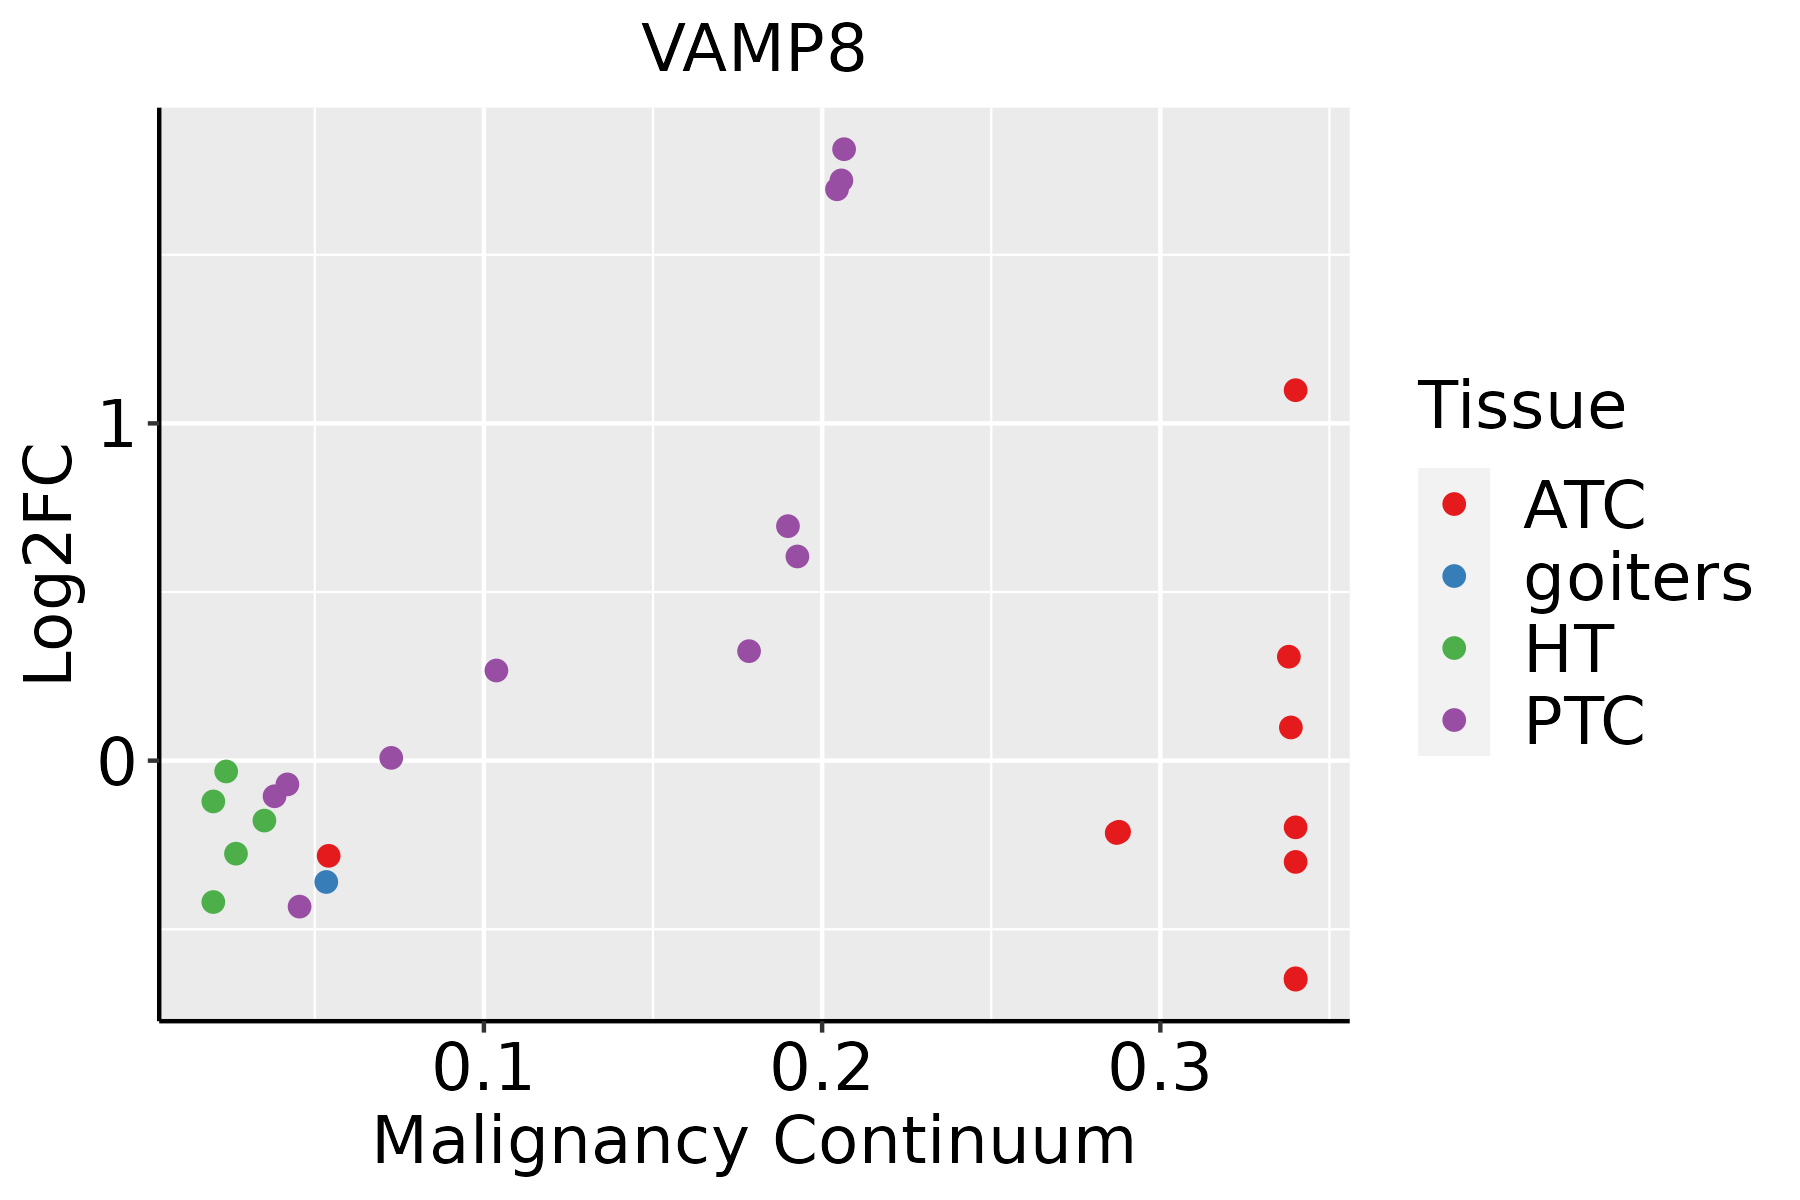 | ATC: Anaplastic thyroid cancer |
| HT: Hashimoto's thyroiditis | ||
| PTC: Papillary thyroid cancer |
| ∗log2FC in expression of this searched gene in stem-like cells from each diseased tissue sample relative to stem-like cells in normal samples in each tissue plotted against the malignancy continuum. Samples are colored based on if they are from different disease stage. |
Top |
Malignant transformation related pathway analysis |
| Find out the enriched GO biological processes and KEGG pathways involved in transition from healthy to precancer to cancer |
| Tissue | Disease Stage | Enriched GO biological Processes |
| Colorectum | AD |  |
| Colorectum | SER |  |
| Colorectum | MSS |  |
| Colorectum | MSI-H |  |
| Colorectum | FAP |  |
| ∗Top 15 enriched GO BP terms are showed in the bar plot of each disease state in each tissue. Each row represents a significant GO biological process which is colored according to the -log10(p.adjust). |
| Page: 1 2 3 4 5 6 7 8 9 |
| GO ID | Tissue | Disease Stage | Description | Gene Ratio | Bg Ratio | pvalue | p.adjust | Count |
| GO:199077821 | Liver | HCC | protein localization to cell periphery | 200/7958 | 333/18723 | 6.07e-11 | 2.23e-09 | 200 |
| GO:005165621 | Liver | HCC | establishment of organelle localization | 226/7958 | 390/18723 | 4.15e-10 | 1.34e-08 | 226 |
| GO:005170122 | Liver | HCC | biological process involved in interaction with host | 128/7958 | 203/18723 | 2.51e-09 | 6.91e-08 | 128 |
| GO:190547511 | Liver | HCC | regulation of protein localization to membrane | 113/7958 | 175/18723 | 2.90e-09 | 7.78e-08 | 113 |
| GO:003298411 | Liver | HCC | protein-containing complex disassembly | 138/7958 | 224/18723 | 5.59e-09 | 1.46e-07 | 138 |
| GO:000961511 | Liver | HCC | response to virus | 210/7958 | 367/18723 | 7.32e-09 | 1.86e-07 | 210 |
| GO:190437521 | Liver | HCC | regulation of protein localization to cell periphery | 83/7958 | 125/18723 | 5.60e-08 | 1.19e-06 | 83 |
| GO:005212612 | Liver | HCC | movement in host environment | 109/7958 | 175/18723 | 9.58e-08 | 1.89e-06 | 109 |
| GO:190307621 | Liver | HCC | regulation of protein localization to plasma membrane | 69/7958 | 104/18723 | 7.58e-07 | 1.17e-05 | 69 |
| GO:00516071 | Liver | HCC | defense response to virus | 151/7958 | 265/18723 | 1.27e-06 | 1.85e-05 | 151 |
| GO:01405461 | Liver | HCC | defense response to symbiont | 151/7958 | 265/18723 | 1.27e-06 | 1.85e-05 | 151 |
| GO:002240611 | Liver | HCC | membrane docking | 57/7958 | 86/18723 | 7.14e-06 | 8.47e-05 | 57 |
| GO:00973521 | Liver | HCC | autophagosome maturation | 30/7958 | 40/18723 | 3.04e-05 | 3.12e-04 | 30 |
| GO:004828411 | Liver | HCC | organelle fusion | 84/7958 | 141/18723 | 3.13e-05 | 3.20e-04 | 84 |
| GO:004440912 | Liver | HCC | entry into host | 88/7958 | 151/18723 | 6.47e-05 | 5.91e-04 | 88 |
| GO:014005611 | Liver | HCC | organelle localization by membrane tethering | 49/7958 | 77/18723 | 1.46e-04 | 1.18e-03 | 49 |
| GO:004671812 | Liver | HCC | viral entry into host cell | 83/7958 | 144/18723 | 1.73e-04 | 1.36e-03 | 83 |
| GO:005087822 | Liver | HCC | regulation of body fluid levels | 191/7958 | 379/18723 | 1.06e-03 | 6.11e-03 | 191 |
| GO:00901741 | Liver | HCC | organelle membrane fusion | 63/7958 | 110/18723 | 1.24e-03 | 6.85e-03 | 63 |
| GO:00069061 | Liver | HCC | vesicle fusion | 61/7958 | 106/18723 | 1.25e-03 | 6.90e-03 | 61 |
| Page: 1 2 3 4 5 6 7 8 9 10 11 12 13 14 15 16 17 18 19 20 21 |
| Pathway ID | Tissue | Disease Stage | Description | Gene Ratio | Bg Ratio | pvalue | p.adjust | qvalue | Count |
| hsa046115 | Cervix | CC | Platelet activation | 28/1267 | 124/8465 | 1.50e-02 | 4.45e-02 | 2.63e-02 | 28 |
| hsa0461113 | Cervix | CC | Platelet activation | 28/1267 | 124/8465 | 1.50e-02 | 4.45e-02 | 2.63e-02 | 28 |
| hsa04140 | Colorectum | AD | Autophagy - animal | 49/2092 | 141/8465 | 4.58e-03 | 2.20e-02 | 1.40e-02 | 49 |
| hsa041401 | Colorectum | AD | Autophagy - animal | 49/2092 | 141/8465 | 4.58e-03 | 2.20e-02 | 1.40e-02 | 49 |
| hsa041402 | Colorectum | SER | Autophagy - animal | 39/1580 | 141/8465 | 5.43e-03 | 3.28e-02 | 2.38e-02 | 39 |
| hsa041403 | Colorectum | SER | Autophagy - animal | 39/1580 | 141/8465 | 5.43e-03 | 3.28e-02 | 2.38e-02 | 39 |
| hsa041404 | Colorectum | MSS | Autophagy - animal | 45/1875 | 141/8465 | 4.42e-03 | 1.90e-02 | 1.16e-02 | 45 |
| hsa041405 | Colorectum | MSS | Autophagy - animal | 45/1875 | 141/8465 | 4.42e-03 | 1.90e-02 | 1.16e-02 | 45 |
| hsa0414010 | Esophagus | ESCC | Autophagy - animal | 101/4205 | 141/8465 | 7.60e-08 | 6.21e-07 | 3.18e-07 | 101 |
| hsa041305 | Esophagus | ESCC | SNARE interactions in vesicular transport | 28/4205 | 33/8465 | 2.75e-05 | 1.32e-04 | 6.75e-05 | 28 |
| hsa0414015 | Esophagus | ESCC | Autophagy - animal | 101/4205 | 141/8465 | 7.60e-08 | 6.21e-07 | 3.18e-07 | 101 |
| hsa0413012 | Esophagus | ESCC | SNARE interactions in vesicular transport | 28/4205 | 33/8465 | 2.75e-05 | 1.32e-04 | 6.75e-05 | 28 |
| hsa041406 | Liver | Cirrhotic | Autophagy - animal | 65/2530 | 141/8465 | 3.10e-05 | 2.47e-04 | 1.52e-04 | 65 |
| hsa04130 | Liver | Cirrhotic | SNARE interactions in vesicular transport | 18/2530 | 33/8465 | 2.64e-03 | 1.10e-02 | 6.76e-03 | 18 |
| hsa0414011 | Liver | Cirrhotic | Autophagy - animal | 65/2530 | 141/8465 | 3.10e-05 | 2.47e-04 | 1.52e-04 | 65 |
| hsa041301 | Liver | Cirrhotic | SNARE interactions in vesicular transport | 18/2530 | 33/8465 | 2.64e-03 | 1.10e-02 | 6.76e-03 | 18 |
| hsa0414021 | Liver | HCC | Autophagy - animal | 99/4020 | 141/8465 | 3.08e-08 | 4.70e-07 | 2.61e-07 | 99 |
| hsa046112 | Liver | HCC | Platelet activation | 71/4020 | 124/8465 | 1.77e-02 | 4.15e-02 | 2.31e-02 | 71 |
| hsa0414031 | Liver | HCC | Autophagy - animal | 99/4020 | 141/8465 | 3.08e-08 | 4.70e-07 | 2.61e-07 | 99 |
| hsa0461111 | Liver | HCC | Platelet activation | 71/4020 | 124/8465 | 1.77e-02 | 4.15e-02 | 2.31e-02 | 71 |
| Page: 1 2 |
Top |
Cell-cell communication analysis |
| Identification of potential cell-cell interactions between two cell types and their ligand-receptor pairs for different disease states |
| Ligand | Receptor | LRpair | Pathway | Tissue | Disease Stage |
| Page: 1 |
Top |
Single-cell gene regulatory network inference analysis |
| Find out the significant the regulons (TFs) and the target genes of each regulon across cell types for different disease states |
| TF | Cell Type | Tissue | Disease Stage | Target Gene | RSS | Regulon Activity |
| ∗The dot plots of a searched regulon are shown for all cell subpopulations in each disease state of each tissue based on the regulon specific score inferred using pySCENIC and by calculating the average expression. |
| Page: 1 |
Top |
Somatic mutation of malignant transformation related genes |
| Annotation of somatic variants for genes involved in malignant transformation |
| Hugo Symbol | Variant Class | Variant Classification | dbSNP RS | HGVSc | HGVSp | HGVSp Short | SWISSPROT | BIOTYPE | SIFT | PolyPhen | Tumor Sample Barcode | Tissue | Histology | Sex | Age | Stage | Therapy Types | Drugs | Outcome |
| VAMP8 | SNV | Missense_Mutation | c.68N>A | p.Val23Asp | p.V23D | Q9BV40 | protein_coding | deleterious(0) | probably_damaging(1) | TCGA-AA-3994-01 | Colorectum | colon adenocarcinoma | Male | >=65 | III/IV | Chemotherapy | capecitabine | CR | |
| VAMP8 | SNV | Missense_Mutation | c.286N>G | p.Thr96Ala | p.T96A | Q9BV40 | protein_coding | deleterious(0.02) | benign(0.18) | TCGA-AZ-4615-01 | Colorectum | colon adenocarcinoma | Male | >=65 | III/IV | Chemotherapy | xeloda | PD | |
| VAMP8 | SNV | Missense_Mutation | novel | c.233T>C | p.Val78Ala | p.V78A | Q9BV40 | protein_coding | tolerated(0.13) | benign(0.207) | TCGA-AG-A014-01 | Colorectum | rectum adenocarcinoma | Male | >=65 | I/II | Unknown | Unknown | SD |
| VAMP8 | SNV | Missense_Mutation | novel | c.235N>A | p.Leu79Ile | p.L79I | Q9BV40 | protein_coding | tolerated(0.91) | benign(0.003) | TCGA-A5-A0G2-01 | Endometrium | uterine corpus endometrioid carcinoma | Female | <65 | III/IV | Unknown | Unknown | SD |
| VAMP8 | SNV | Missense_Mutation | c.71A>C | p.Lys24Thr | p.K24T | Q9BV40 | protein_coding | tolerated(0.09) | possibly_damaging(0.721) | TCGA-AP-A0L9-01 | Endometrium | uterine corpus endometrioid carcinoma | Female | >=65 | I/II | Unknown | Unknown | SD | |
| VAMP8 | SNV | Missense_Mutation | novel | c.287C>T | p.Thr96Ile | p.T96I | Q9BV40 | protein_coding | deleterious(0) | possibly_damaging(0.792) | TCGA-AX-A0J1-01 | Endometrium | uterine corpus endometrioid carcinoma | Female | >=65 | I/II | Unknown | Unknown | SD |
| VAMP8 | SNV | Missense_Mutation | c.224N>T | p.Lys75Met | p.K75M | Q9BV40 | protein_coding | deleterious(0) | probably_damaging(0.992) | TCGA-BG-A0LX-01 | Endometrium | uterine corpus endometrioid carcinoma | Female | <65 | I/II | Unknown | Unknown | SD | |
| VAMP8 | SNV | Missense_Mutation | rs766364692 | c.220N>A | p.Val74Met | p.V74M | Q9BV40 | protein_coding | tolerated(0.08) | benign(0.053) | TCGA-EO-A22U-01 | Endometrium | uterine corpus endometrioid carcinoma | Female | >=65 | I/II | Unknown | Unknown | SD |
| VAMP8 | SNV | Missense_Mutation | novel | c.101T>C | p.Ile34Thr | p.I34T | Q9BV40 | protein_coding | tolerated(0.08) | benign(0.425) | TCGA-EY-A1GI-01 | Endometrium | uterine corpus endometrioid carcinoma | Female | <65 | I/II | Unknown | Unknown | SD |
| VAMP8 | deletion | Frame_Shift_Del | rs774807701 | c.110delN | p.Glu39LysfsTer36 | p.E39Kfs*36 | Q9BV40 | protein_coding | TCGA-D1-A1NZ-01 | Endometrium | uterine corpus endometrioid carcinoma | Female | <65 | I/II | Unknown | Unknown | SD |
| Page: 1 2 |
Top |
Related drugs of malignant transformation related genes |
| Identification of chemicals and drugs interact with genes involved in malignant transfromation |
| (DGIdb 4.0) |
| Entrez ID | Symbol | Category | Interaction Types | Drug Claim Name | Drug Name | PMIDs |
| Page: 1 |

Copyright 2023-Present -The University of Texas Health Science Center at Houston |