
|
|||||
|
 | |
| |
| |
| |
| |
| |
|
Gene: UFM1 |
Gene summary for UFM1 |
| Gene information | Species | Human | Gene symbol | UFM1 | Gene ID | 51569 |
| Gene name | ubiquitin fold modifier 1 | |
| Gene Alias | BM-002 | |
| Cytomap | 13q13.3 | |
| Gene Type | protein-coding | GO ID | GO:0006464 | UniProtAcc | P61960 |
Top |
Malignant transformation analysis |
| Identification of the aberrant gene expression in precancerous and cancerous lesions by comparing the gene expression of stem-like cells in diseased tissues with normal stem cells |
| Entrez ID | Symbol | Replicates | Species | Organ | Tissue | Adj P-value | Log2FC | Malignancy |
| 51569 | UFM1 | HTA11_99999970781_79442 | Human | Colorectum | MSS | 1.34e-04 | 4.54e-01 | 0.294 |
| 51569 | UFM1 | HTA11_99999965104_69814 | Human | Colorectum | MSS | 6.48e-07 | 7.02e-01 | 0.281 |
| 51569 | UFM1 | HTA11_99999971662_82457 | Human | Colorectum | MSS | 9.76e-15 | 7.50e-01 | 0.3859 |
| 51569 | UFM1 | A015-C-203 | Human | Colorectum | FAP | 3.31e-10 | -2.32e-01 | -0.1294 |
| 51569 | UFM1 | A015-C-204 | Human | Colorectum | FAP | 6.04e-04 | -2.34e-01 | -0.0228 |
| 51569 | UFM1 | A002-C-201 | Human | Colorectum | FAP | 7.45e-09 | -2.51e-01 | 0.0324 |
| 51569 | UFM1 | A001-C-119 | Human | Colorectum | FAP | 1.85e-07 | -2.85e-01 | -0.1557 |
| 51569 | UFM1 | A001-C-108 | Human | Colorectum | FAP | 3.72e-07 | -2.18e-01 | -0.0272 |
| 51569 | UFM1 | A002-C-205 | Human | Colorectum | FAP | 3.98e-13 | -2.85e-01 | -0.1236 |
| 51569 | UFM1 | A001-C-104 | Human | Colorectum | FAP | 9.39e-05 | -2.17e-01 | 0.0184 |
| 51569 | UFM1 | A015-C-006 | Human | Colorectum | FAP | 2.70e-06 | -2.64e-01 | -0.0994 |
| 51569 | UFM1 | A015-C-106 | Human | Colorectum | FAP | 1.07e-05 | -2.10e-01 | -0.0511 |
| 51569 | UFM1 | A002-C-114 | Human | Colorectum | FAP | 4.69e-07 | -2.32e-01 | -0.1561 |
| 51569 | UFM1 | A015-C-104 | Human | Colorectum | FAP | 1.30e-08 | -2.23e-01 | -0.1899 |
| 51569 | UFM1 | A001-C-014 | Human | Colorectum | FAP | 3.77e-05 | -2.05e-01 | 0.0135 |
| 51569 | UFM1 | A002-C-016 | Human | Colorectum | FAP | 1.59e-06 | -2.25e-01 | 0.0521 |
| 51569 | UFM1 | A015-C-002 | Human | Colorectum | FAP | 1.53e-04 | -2.61e-01 | -0.0763 |
| 51569 | UFM1 | A001-C-203 | Human | Colorectum | FAP | 9.16e-07 | -2.35e-01 | -0.0481 |
| 51569 | UFM1 | A002-C-116 | Human | Colorectum | FAP | 1.07e-07 | -2.43e-01 | -0.0452 |
| 51569 | UFM1 | A014-C-008 | Human | Colorectum | FAP | 1.40e-05 | -2.63e-01 | -0.191 |
| Page: 1 2 3 4 5 6 7 8 9 |
| Tissue | Expression Dynamics | Abbreviation |
| Colorectum (GSE201348) |  | FAP: Familial adenomatous polyposis |
| CRC: Colorectal cancer | ||
| Colorectum (HTA11) |  | AD: Adenomas |
| SER: Sessile serrated lesions | ||
| MSI-H: Microsatellite-high colorectal cancer | ||
| MSS: Microsatellite stable colorectal cancer | ||
| Endometrium | 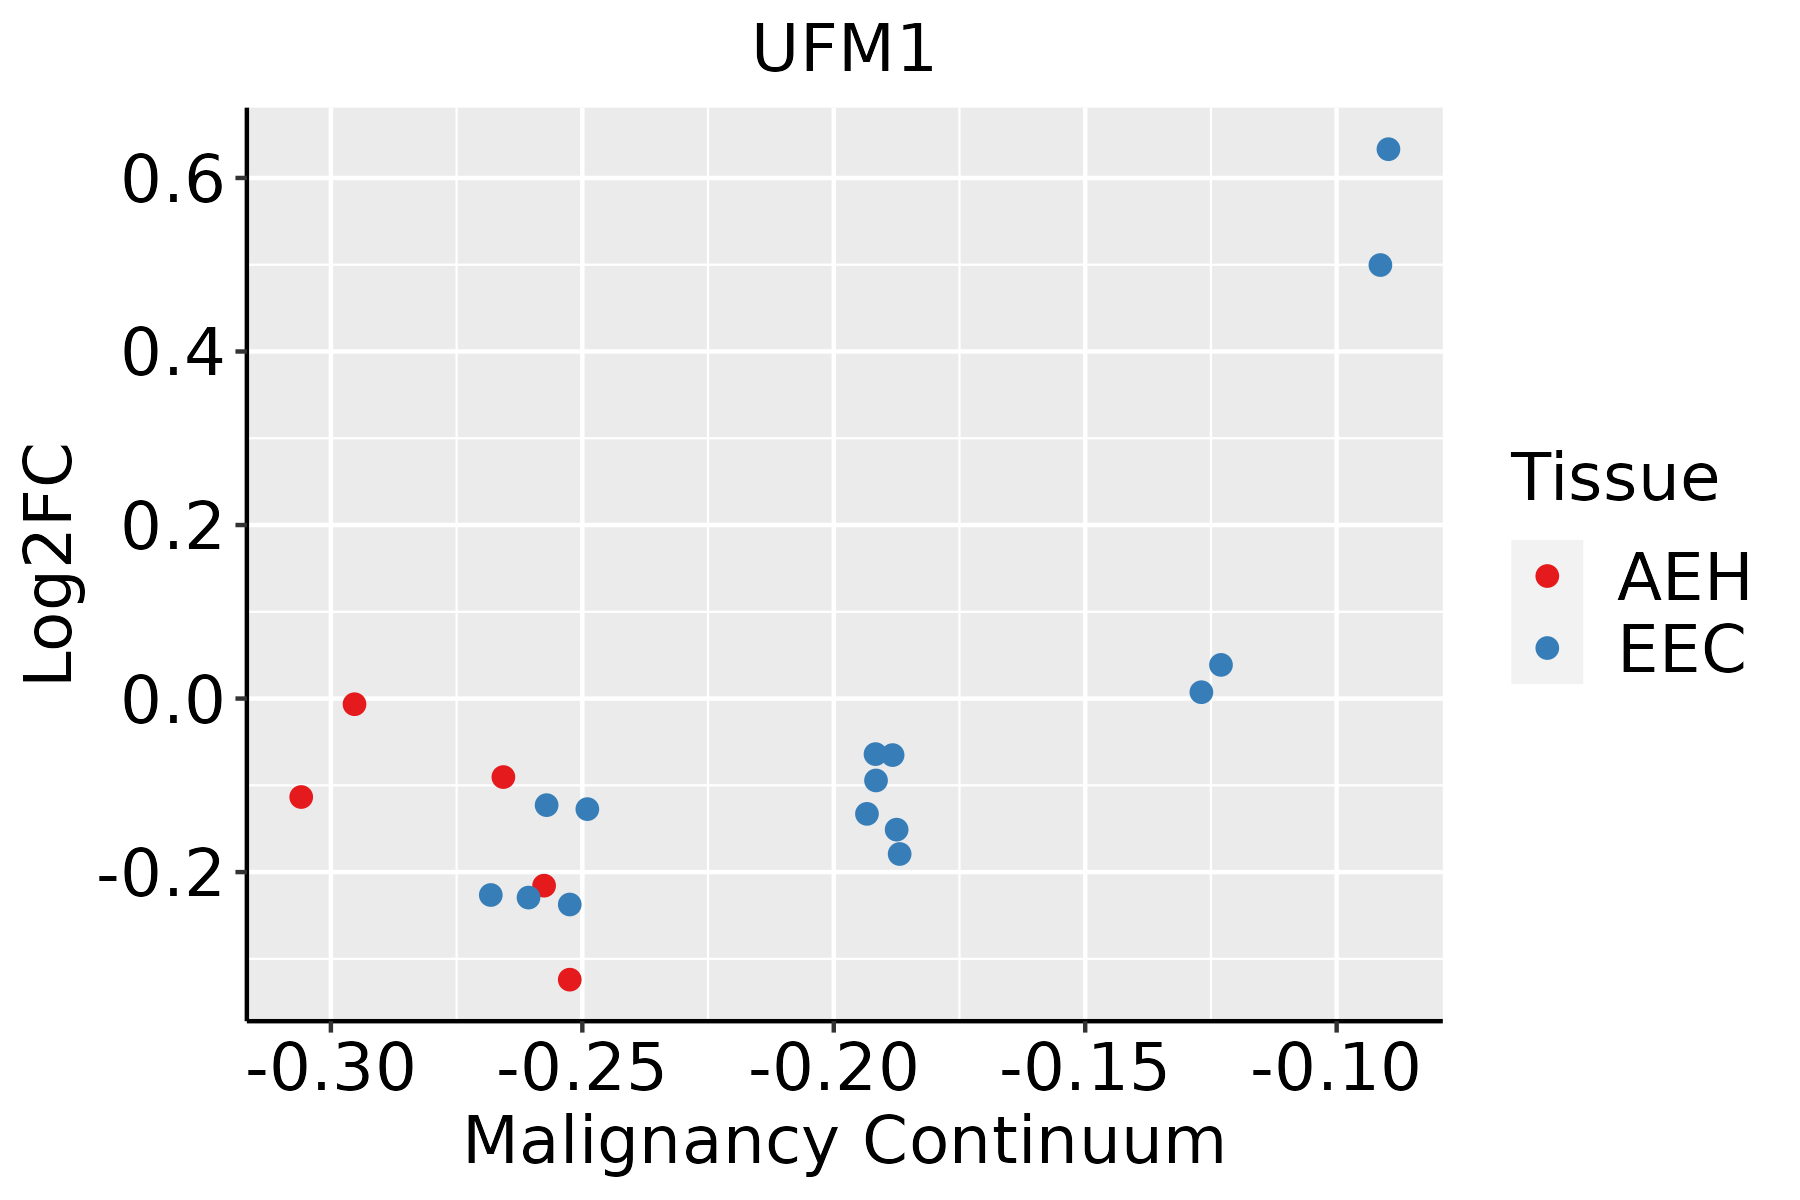 | AEH: Atypical endometrial hyperplasia |
| EEC: Endometrioid Cancer | ||
| Esophagus |  | ESCC: Esophageal squamous cell carcinoma |
| HGIN: High-grade intraepithelial neoplasias | ||
| LGIN: Low-grade intraepithelial neoplasias | ||
| Liver | 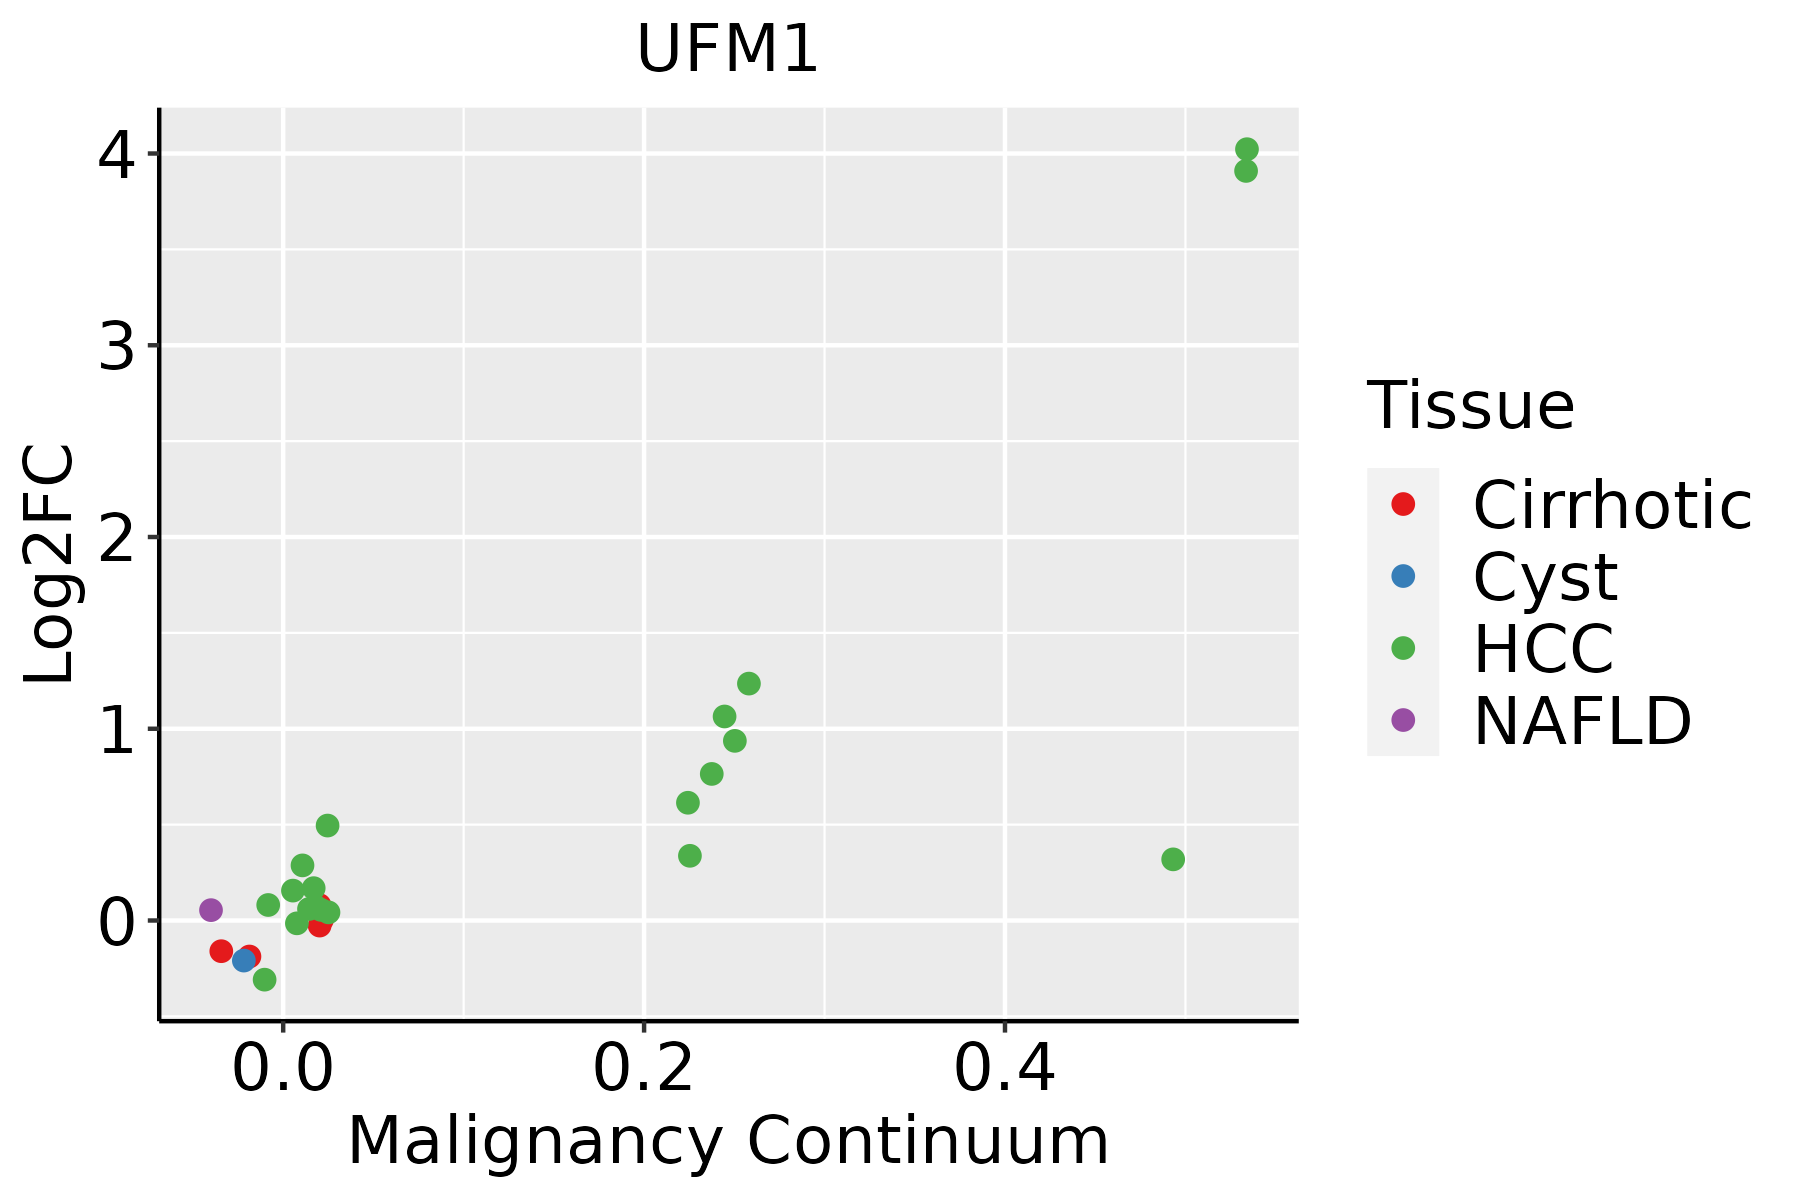 | HCC: Hepatocellular carcinoma |
| NAFLD: Non-alcoholic fatty liver disease | ||
| Oral Cavity | 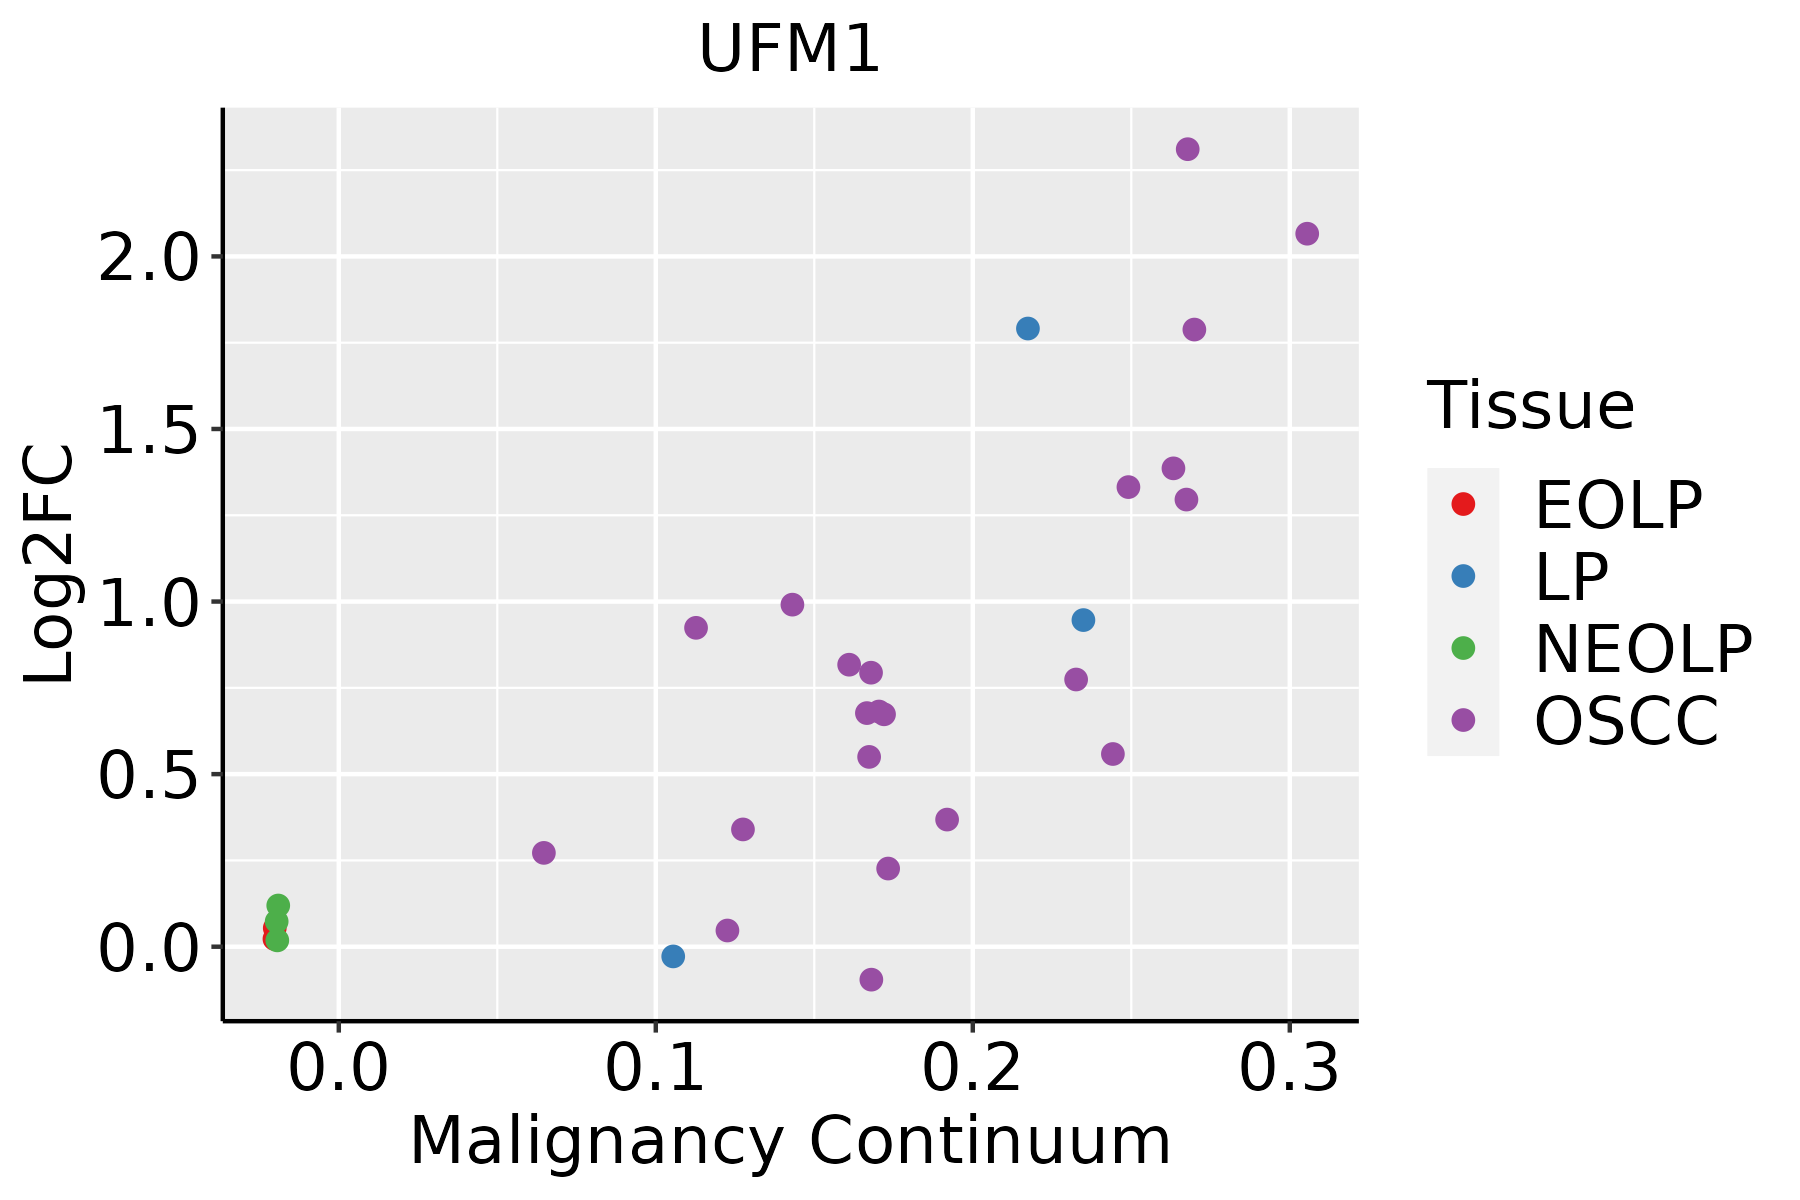 | EOLP: Erosive Oral lichen planus |
| LP: leukoplakia | ||
| NEOLP: Non-erosive oral lichen planus | ||
| OSCC: Oral squamous cell carcinoma | ||
| Skin | 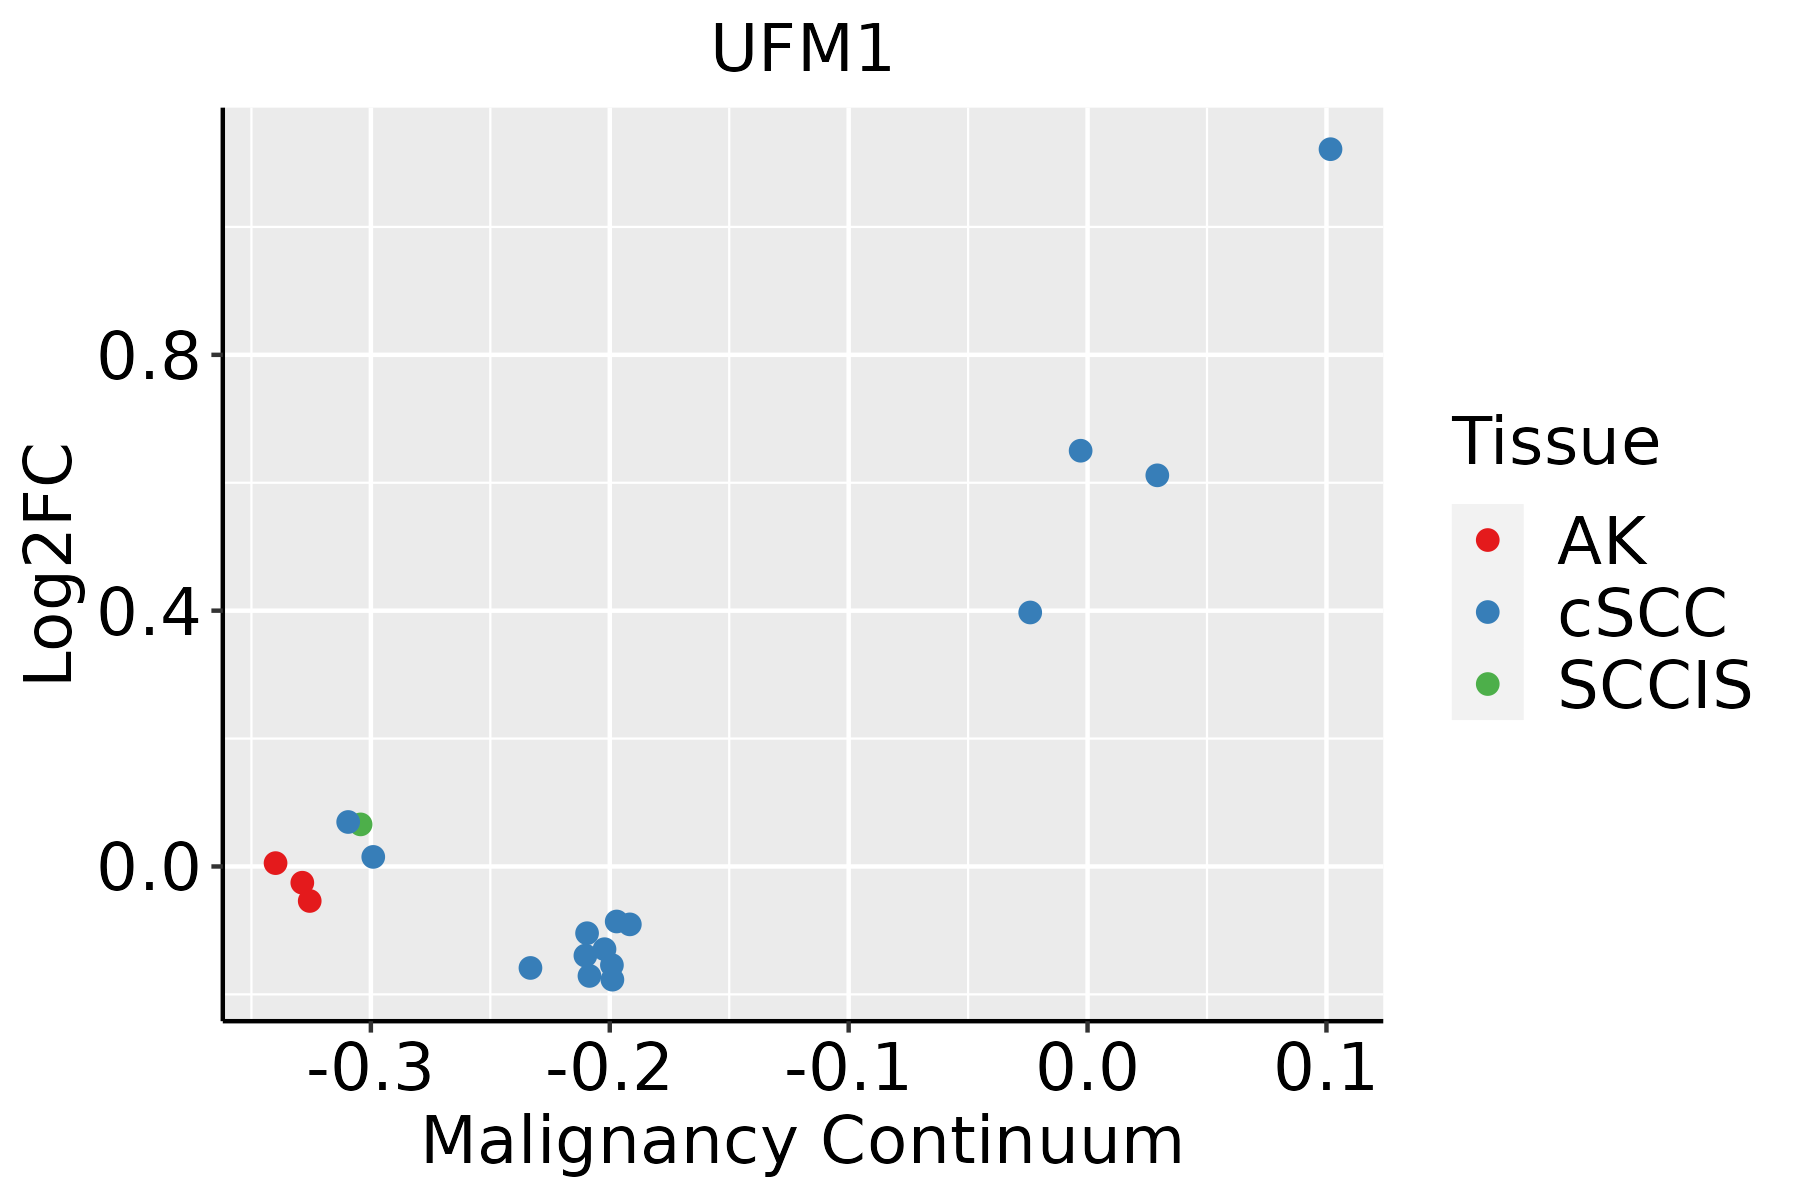 | AK: Actinic keratosis |
| cSCC: Cutaneous squamous cell carcinoma | ||
| SCCIS:squamous cell carcinoma in situ | ||
| Thyroid | 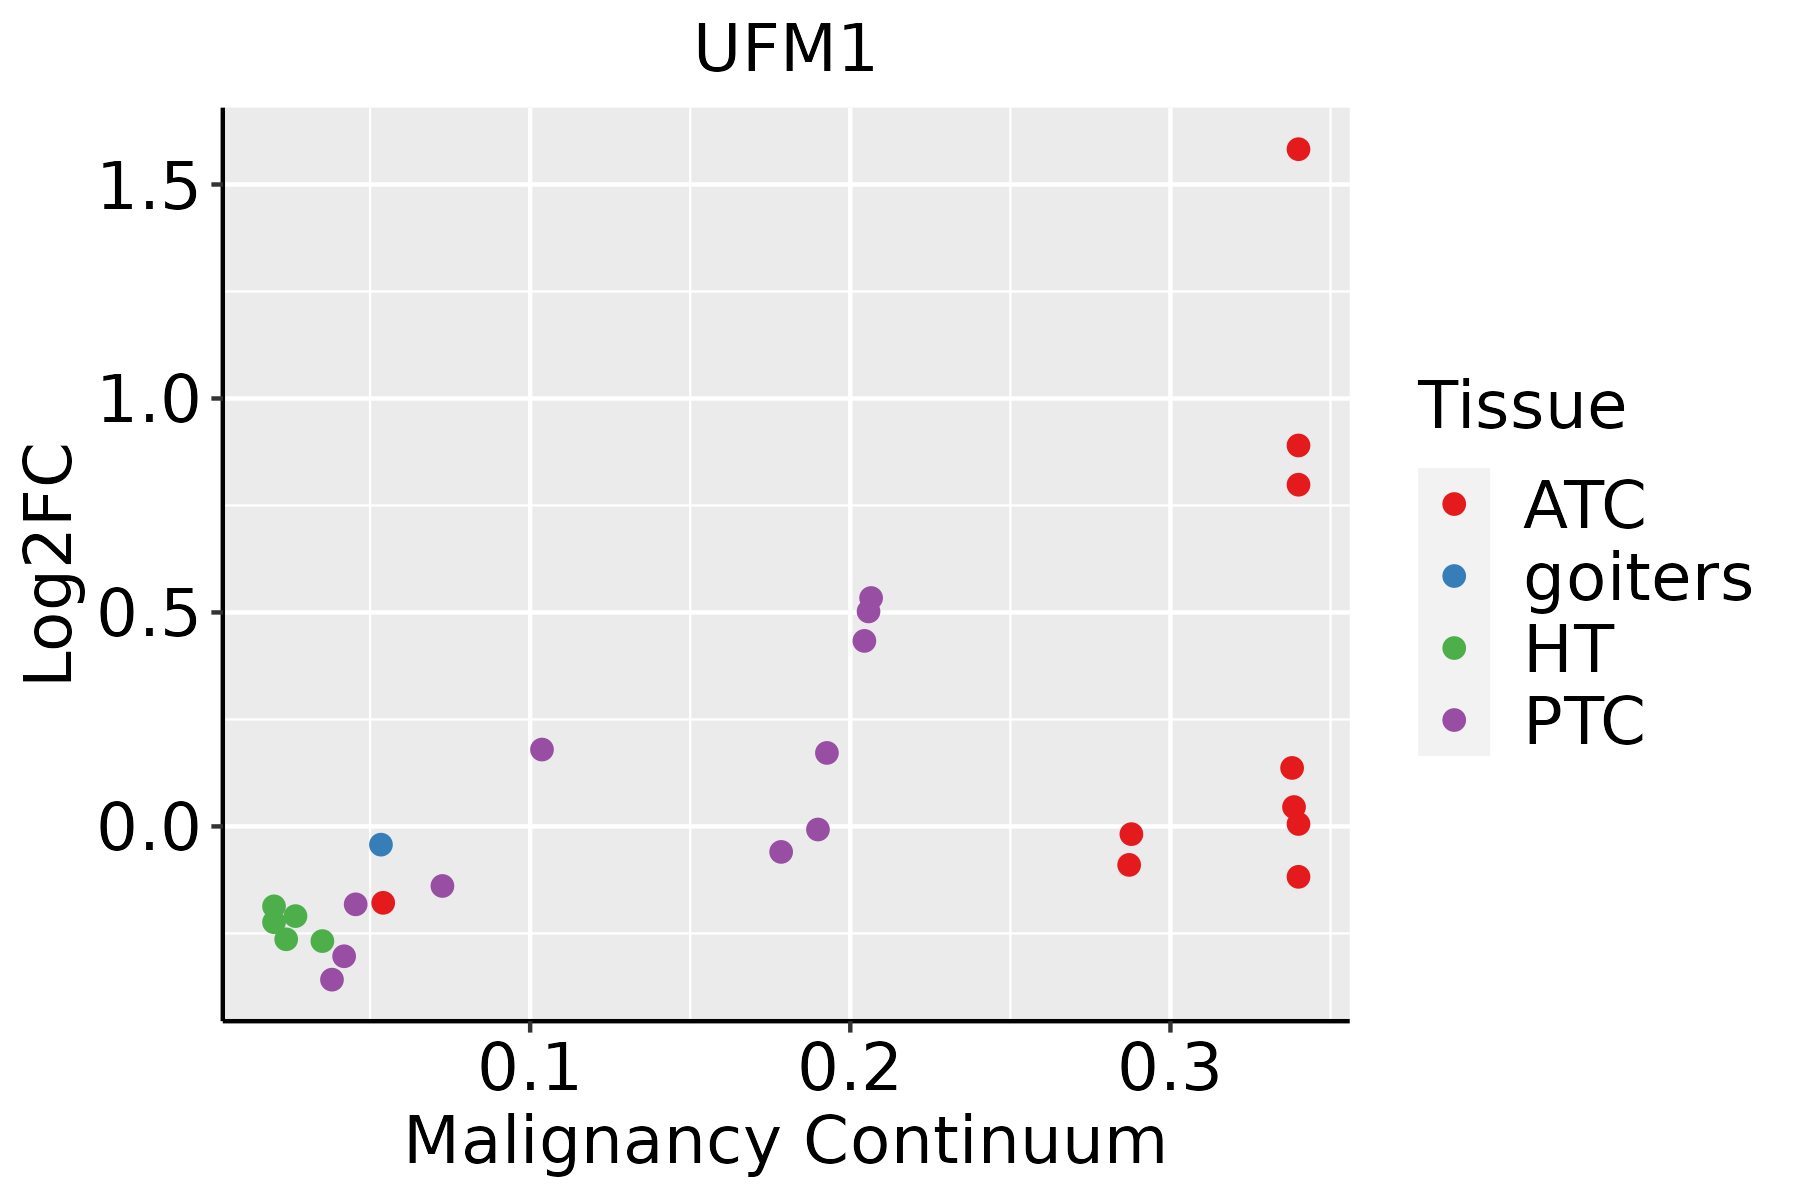 | ATC: Anaplastic thyroid cancer |
| HT: Hashimoto's thyroiditis | ||
| PTC: Papillary thyroid cancer |
| ∗log2FC in expression of this searched gene in stem-like cells from each diseased tissue sample relative to stem-like cells in normal samples in each tissue plotted against the malignancy continuum. Samples are colored based on if they are from different disease stage. |
Top |
Malignant transformation related pathway analysis |
| Find out the enriched GO biological processes and KEGG pathways involved in transition from healthy to precancer to cancer |
| Tissue | Disease Stage | Enriched GO biological Processes |
| Colorectum | AD |  |
| Colorectum | SER |  |
| Colorectum | MSS |  |
| Colorectum | MSI-H |  |
| Colorectum | FAP |  |
| ∗Top 15 enriched GO BP terms are showed in the bar plot of each disease state in each tissue. Each row represents a significant GO biological process which is colored according to the -log10(p.adjust). |
| Page: 1 2 3 4 5 6 7 8 9 |
| GO ID | Tissue | Disease Stage | Description | Gene Ratio | Bg Ratio | pvalue | p.adjust | Count |
| GO:00349767 | Liver | Cirrhotic | response to endoplasmic reticulum stress | 130/4634 | 256/18723 | 1.72e-19 | 3.86e-17 | 130 |
| GO:00224117 | Liver | Cirrhotic | cellular component disassembly | 182/4634 | 443/18723 | 1.59e-14 | 1.54e-12 | 182 |
| GO:003238611 | Liver | Cirrhotic | regulation of intracellular transport | 147/4634 | 337/18723 | 1.84e-14 | 1.72e-12 | 147 |
| GO:004854512 | Liver | Cirrhotic | response to steroid hormone | 146/4634 | 339/18723 | 7.87e-14 | 6.76e-12 | 146 |
| GO:003315711 | Liver | Cirrhotic | regulation of intracellular protein transport | 108/4634 | 229/18723 | 1.23e-13 | 1.04e-11 | 108 |
| GO:001623611 | Liver | Cirrhotic | macroautophagy | 129/4634 | 291/18723 | 1.75e-13 | 1.41e-11 | 129 |
| GO:19030084 | Liver | Cirrhotic | organelle disassembly | 59/4634 | 114/18723 | 4.82e-10 | 2.27e-08 | 59 |
| GO:007138312 | Liver | Cirrhotic | cellular response to steroid hormone stimulus | 90/4634 | 204/18723 | 1.04e-09 | 4.70e-08 | 90 |
| GO:000691312 | Liver | Cirrhotic | nucleocytoplasmic transport | 118/4634 | 301/18723 | 1.71e-08 | 6.27e-07 | 118 |
| GO:005116912 | Liver | Cirrhotic | nuclear transport | 118/4634 | 301/18723 | 1.71e-08 | 6.27e-07 | 118 |
| GO:003450411 | Liver | Cirrhotic | protein localization to nucleus | 113/4634 | 290/18723 | 5.00e-08 | 1.58e-06 | 113 |
| GO:003052212 | Liver | Cirrhotic | intracellular receptor signaling pathway | 105/4634 | 265/18723 | 5.44e-08 | 1.69e-06 | 105 |
| GO:004682211 | Liver | Cirrhotic | regulation of nucleocytoplasmic transport | 51/4634 | 106/18723 | 1.54e-07 | 4.12e-06 | 51 |
| GO:19001807 | Liver | Cirrhotic | regulation of protein localization to nucleus | 61/4634 | 136/18723 | 2.39e-07 | 6.06e-06 | 61 |
| GO:004340111 | Liver | Cirrhotic | steroid hormone mediated signaling pathway | 58/4634 | 136/18723 | 3.44e-06 | 5.95e-05 | 58 |
| GO:003051811 | Liver | Cirrhotic | intracellular steroid hormone receptor signaling pathway | 50/4634 | 116/18723 | 1.11e-05 | 1.59e-04 | 50 |
| GO:00170387 | Liver | Cirrhotic | protein import | 77/4634 | 206/18723 | 3.56e-05 | 4.32e-04 | 77 |
| GO:000975511 | Liver | Cirrhotic | hormone-mediated signaling pathway | 71/4634 | 190/18723 | 7.09e-05 | 7.98e-04 | 71 |
| GO:19038285 | Liver | Cirrhotic | negative regulation of cellular protein localization | 48/4634 | 117/18723 | 7.59e-05 | 8.41e-04 | 48 |
| GO:00619124 | Liver | Cirrhotic | selective autophagy | 30/4634 | 68/18723 | 3.72e-04 | 3.12e-03 | 30 |
| Page: 1 2 3 4 5 6 7 8 9 10 11 12 13 14 15 16 17 18 19 20 21 22 |
| Pathway ID | Tissue | Disease Stage | Description | Gene Ratio | Bg Ratio | pvalue | p.adjust | qvalue | Count |
| Page: 1 |
Top |
Cell-cell communication analysis |
| Identification of potential cell-cell interactions between two cell types and their ligand-receptor pairs for different disease states |
| Ligand | Receptor | LRpair | Pathway | Tissue | Disease Stage |
| Page: 1 |
Top |
Single-cell gene regulatory network inference analysis |
| Find out the significant the regulons (TFs) and the target genes of each regulon across cell types for different disease states |
| TF | Cell Type | Tissue | Disease Stage | Target Gene | RSS | Regulon Activity |
| ∗The dot plots of a searched regulon are shown for all cell subpopulations in each disease state of each tissue based on the regulon specific score inferred using pySCENIC and by calculating the average expression. |
| Page: 1 |
Top |
Somatic mutation of malignant transformation related genes |
| Annotation of somatic variants for genes involved in malignant transformation |
| Hugo Symbol | Variant Class | Variant Classification | dbSNP RS | HGVSc | HGVSp | HGVSp Short | SWISSPROT | BIOTYPE | SIFT | PolyPhen | Tumor Sample Barcode | Tissue | Histology | Sex | Age | Stage | Therapy Types | Drugs | Outcome |
| UFM1 | SNV | Missense_Mutation | c.68N>T | p.Ala23Val | p.A23V | P61960 | protein_coding | deleterious_low_confidence(0.03) | possibly_damaging(0.691) | TCGA-AA-A01P-01 | Colorectum | colon adenocarcinoma | Female | >=65 | III/IV | Unknown | Unknown | PD | |
| UFM1 | SNV | Missense_Mutation | novel | c.253N>G | p.Phe85Val | p.F85V | P61960 | protein_coding | deleterious_low_confidence(0) | possibly_damaging(0.804) | TCGA-AJ-A3EK-01 | Endometrium | uterine corpus endometrioid carcinoma | Female | <65 | I/II | Chemotherapy | carboplatin | CR |
| UFM1 | SNV | Missense_Mutation | novel | c.278N>T | p.Arg93Leu | p.R93L | P61960 | protein_coding | deleterious_low_confidence(0.02) | possibly_damaging(0.875) | TCGA-EY-A1GK-01 | Endometrium | uterine corpus endometrioid carcinoma | Female | >=65 | I/II | Unknown | Unknown | SD |
| UFM1 | SNV | Missense_Mutation | rs368429371 | c.277N>T | p.Arg93Trp | p.R93W | P61960 | protein_coding | deleterious_low_confidence(0.01) | probably_damaging(0.988) | TCGA-FI-A2D5-01 | Endometrium | uterine corpus endometrioid carcinoma | Female | <65 | III/IV | Chemotherapy | carboplatinum | PD |
| UFM1 | SNV | Missense_Mutation | novel | c.191N>A | p.Thr64Lys | p.T64K | P61960 | protein_coding | deleterious_low_confidence(0) | probably_damaging(1) | TCGA-ZQ-A9CR-01 | Stomach | stomach adenocarcinoma | Female | >=65 | III/IV | Unknown | Unknown | SD |
| Page: 1 |
Top |
Related drugs of malignant transformation related genes |
| Identification of chemicals and drugs interact with genes involved in malignant transfromation |
| (DGIdb 4.0) |
| Entrez ID | Symbol | Category | Interaction Types | Drug Claim Name | Drug Name | PMIDs |
| Page: 1 |

Copyright 2023-Present -The University of Texas Health Science Center at Houston |