
|
|||||
|
 | |
| |
| |
| |
| |
| |
|
Gene: TRIM25 |
Gene summary for TRIM25 |
| Gene information | Species | Human | Gene symbol | TRIM25 | Gene ID | 7706 |
| Gene name | tripartite motif containing 25 | |
| Gene Alias | EFP | |
| Cytomap | 17q22 | |
| Gene Type | protein-coding | GO ID | GO:0002376 | UniProtAcc | Q14258 |
Top |
Malignant transformation analysis |
| Identification of the aberrant gene expression in precancerous and cancerous lesions by comparing the gene expression of stem-like cells in diseased tissues with normal stem cells |
| Entrez ID | Symbol | Replicates | Species | Organ | Tissue | Adj P-value | Log2FC | Malignancy |
| 7706 | TRIM25 | HTA11_2487_2000001011 | Human | Colorectum | SER | 1.99e-03 | 3.73e-01 | -0.1808 |
| 7706 | TRIM25 | HTA11_347_2000001011 | Human | Colorectum | AD | 3.83e-11 | 4.73e-01 | -0.1954 |
| 7706 | TRIM25 | HTA11_411_2000001011 | Human | Colorectum | SER | 1.67e-08 | 9.17e-01 | -0.2602 |
| 7706 | TRIM25 | HTA11_83_2000001011 | Human | Colorectum | SER | 4.11e-04 | 4.81e-01 | -0.1526 |
| 7706 | TRIM25 | HTA11_696_2000001011 | Human | Colorectum | AD | 3.98e-04 | 3.71e-01 | -0.1464 |
| 7706 | TRIM25 | HTA11_1391_2000001011 | Human | Colorectum | AD | 3.51e-09 | 5.29e-01 | -0.059 |
| 7706 | TRIM25 | HTA11_546_2000001011 | Human | Colorectum | AD | 7.29e-03 | 3.96e-01 | -0.0842 |
| 7706 | TRIM25 | HTA11_866_3004761011 | Human | Colorectum | AD | 3.64e-06 | 3.77e-01 | 0.096 |
| 7706 | TRIM25 | HTA11_7696_3000711011 | Human | Colorectum | AD | 2.98e-04 | 3.79e-01 | 0.0674 |
| 7706 | TRIM25 | HTA11_99999970781_79442 | Human | Colorectum | MSS | 2.70e-06 | 4.63e-01 | 0.294 |
| 7706 | TRIM25 | HTA11_99999971662_82457 | Human | Colorectum | MSS | 7.39e-08 | 4.84e-01 | 0.3859 |
| 7706 | TRIM25 | A015-C-203 | Human | Colorectum | FAP | 3.17e-02 | -1.38e-01 | -0.1294 |
| 7706 | TRIM25 | A015-C-104 | Human | Colorectum | FAP | 9.21e-04 | -1.59e-01 | -0.1899 |
| 7706 | TRIM25 | A002-C-116 | Human | Colorectum | FAP | 2.25e-03 | -1.51e-01 | -0.0452 |
| 7706 | TRIM25 | LZE7T | Human | Esophagus | ESCC | 9.77e-04 | 1.44e-01 | 0.0667 |
| 7706 | TRIM25 | LZE22T | Human | Esophagus | ESCC | 3.33e-04 | 1.82e-01 | 0.068 |
| 7706 | TRIM25 | LZE24T | Human | Esophagus | ESCC | 8.67e-07 | 2.73e-01 | 0.0596 |
| 7706 | TRIM25 | LZE6T | Human | Esophagus | ESCC | 1.85e-02 | 1.34e-01 | 0.0845 |
| 7706 | TRIM25 | P1T-E | Human | Esophagus | ESCC | 1.77e-05 | 3.62e-01 | 0.0875 |
| 7706 | TRIM25 | P2T-E | Human | Esophagus | ESCC | 5.02e-21 | 2.86e-01 | 0.1177 |
| Page: 1 2 3 4 5 |
| Tissue | Expression Dynamics | Abbreviation |
| Colorectum (GSE201348) |  | FAP: Familial adenomatous polyposis |
| CRC: Colorectal cancer | ||
| Colorectum (HTA11) |  | AD: Adenomas |
| SER: Sessile serrated lesions | ||
| MSI-H: Microsatellite-high colorectal cancer | ||
| MSS: Microsatellite stable colorectal cancer | ||
| Esophagus | 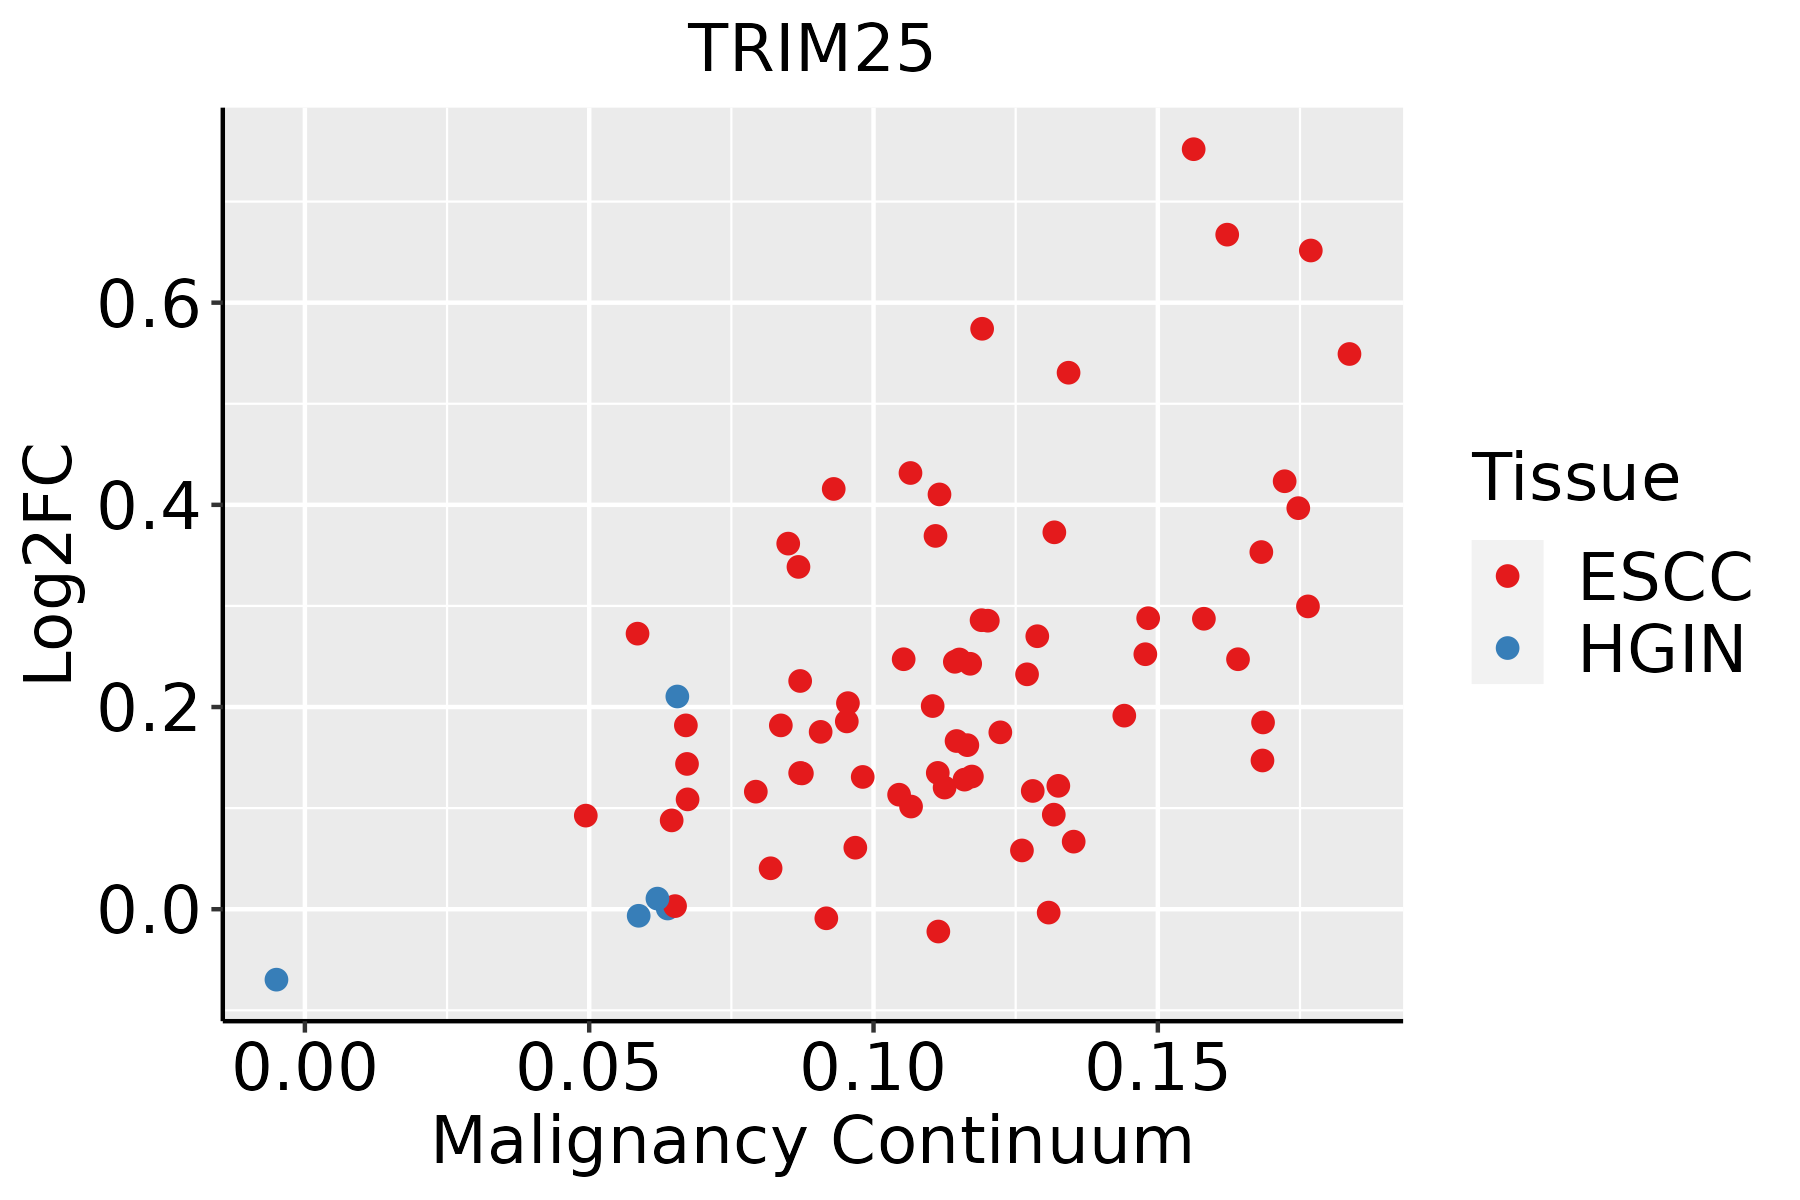 | ESCC: Esophageal squamous cell carcinoma |
| HGIN: High-grade intraepithelial neoplasias | ||
| LGIN: Low-grade intraepithelial neoplasias | ||
| Liver |  | HCC: Hepatocellular carcinoma |
| NAFLD: Non-alcoholic fatty liver disease | ||
| Oral Cavity |  | EOLP: Erosive Oral lichen planus |
| LP: leukoplakia | ||
| NEOLP: Non-erosive oral lichen planus | ||
| OSCC: Oral squamous cell carcinoma |
| ∗log2FC in expression of this searched gene in stem-like cells from each diseased tissue sample relative to stem-like cells in normal samples in each tissue plotted against the malignancy continuum. Samples are colored based on if they are from different disease stage. |
Top |
Malignant transformation related pathway analysis |
| Find out the enriched GO biological processes and KEGG pathways involved in transition from healthy to precancer to cancer |
| Tissue | Disease Stage | Enriched GO biological Processes |
| Colorectum | AD |  |
| Colorectum | SER |  |
| Colorectum | MSS |  |
| Colorectum | MSI-H |  |
| Colorectum | FAP |  |
| ∗Top 15 enriched GO BP terms are showed in the bar plot of each disease state in each tissue. Each row represents a significant GO biological process which is colored according to the -log10(p.adjust). |
| Page: 1 2 3 4 5 6 7 8 9 |
| GO ID | Tissue | Disease Stage | Description | Gene Ratio | Bg Ratio | pvalue | p.adjust | Count |
| GO:00332733 | Oral cavity | OSCC | response to vitamin | 50/7305 | 93/18723 | 2.71e-03 | 1.18e-02 | 50 |
| GO:19021863 | Oral cavity | OSCC | regulation of viral release from host cell | 17/7305 | 26/18723 | 5.83e-03 | 2.23e-02 | 17 |
| GO:005237217 | Oral cavity | OSCC | modulation by symbiont of entry into host | 28/7305 | 49/18723 | 7.63e-03 | 2.79e-02 | 28 |
| GO:0016032110 | Oral cavity | LP | viral process | 211/4623 | 415/18723 | 4.06e-31 | 3.18e-28 | 211 |
| GO:0010498110 | Oral cavity | LP | proteasomal protein catabolic process | 224/4623 | 490/18723 | 9.57e-25 | 4.00e-22 | 224 |
| GO:0019058110 | Oral cavity | LP | viral life cycle | 161/4623 | 317/18723 | 5.99e-24 | 2.21e-21 | 161 |
| GO:0043161110 | Oral cavity | LP | proteasome-mediated ubiquitin-dependent protein catabolic process | 190/4623 | 412/18723 | 1.08e-21 | 2.93e-19 | 190 |
| GO:0034976110 | Oral cavity | LP | response to endoplasmic reticulum stress | 133/4623 | 256/18723 | 3.84e-21 | 9.24e-19 | 133 |
| GO:0051701110 | Oral cavity | LP | biological process involved in interaction with host | 100/4623 | 203/18723 | 2.72e-14 | 3.10e-12 | 100 |
| GO:0044403110 | Oral cavity | LP | biological process involved in symbiotic interaction | 130/4623 | 290/18723 | 4.23e-14 | 4.64e-12 | 130 |
| GO:0050792110 | Oral cavity | LP | regulation of viral process | 83/4623 | 164/18723 | 6.50e-13 | 5.74e-11 | 83 |
| GO:0052126110 | Oral cavity | LP | movement in host environment | 87/4623 | 175/18723 | 6.65e-13 | 5.79e-11 | 87 |
| GO:004312316 | Oral cavity | LP | positive regulation of I-kappaB kinase/NF-kappaB signaling | 88/4623 | 186/18723 | 1.58e-11 | 1.13e-09 | 88 |
| GO:003043313 | Oral cavity | LP | ubiquitin-dependent ERAD pathway | 50/4623 | 85/18723 | 2.12e-11 | 1.48e-09 | 50 |
| GO:003650314 | Oral cavity | LP | ERAD pathway | 57/4623 | 107/18723 | 1.99e-10 | 1.08e-08 | 57 |
| GO:1903900110 | Oral cavity | LP | regulation of viral life cycle | 72/4623 | 148/18723 | 2.23e-10 | 1.19e-08 | 72 |
| GO:004312219 | Oral cavity | LP | regulation of I-kappaB kinase/NF-kappaB signaling | 103/4623 | 249/18723 | 4.48e-09 | 1.90e-07 | 103 |
| GO:0044409110 | Oral cavity | LP | entry into host | 68/4623 | 151/18723 | 3.72e-08 | 1.33e-06 | 68 |
| GO:000724917 | Oral cavity | LP | I-kappaB kinase/NF-kappaB signaling | 110/4623 | 281/18723 | 4.94e-08 | 1.70e-06 | 110 |
| GO:001907613 | Oral cavity | LP | viral release from host cell | 23/4623 | 34/18723 | 1.54e-07 | 4.84e-06 | 23 |
| Page: 1 2 3 4 5 6 7 8 9 10 11 |
| Pathway ID | Tissue | Disease Stage | Description | Gene Ratio | Bg Ratio | pvalue | p.adjust | qvalue | Count |
| hsa0516425 | Esophagus | ESCC | Influenza A | 122/4205 | 171/8465 | 5.01e-09 | 4.79e-08 | 2.45e-08 | 122 |
| hsa040645 | Esophagus | ESCC | NF-kappa B signaling pathway | 67/4205 | 104/8465 | 1.62e-03 | 4.89e-03 | 2.50e-03 | 67 |
| hsa0516435 | Esophagus | ESCC | Influenza A | 122/4205 | 171/8465 | 5.01e-09 | 4.79e-08 | 2.45e-08 | 122 |
| hsa0406412 | Esophagus | ESCC | NF-kappa B signaling pathway | 67/4205 | 104/8465 | 1.62e-03 | 4.89e-03 | 2.50e-03 | 67 |
| hsa0516421 | Liver | HCC | Influenza A | 101/4020 | 171/8465 | 1.41e-03 | 5.07e-03 | 2.82e-03 | 101 |
| hsa0516431 | Liver | HCC | Influenza A | 101/4020 | 171/8465 | 1.41e-03 | 5.07e-03 | 2.82e-03 | 101 |
| hsa0516418 | Oral cavity | OSCC | Influenza A | 116/3704 | 171/8465 | 1.23e-10 | 1.78e-09 | 9.08e-10 | 116 |
| hsa040644 | Oral cavity | OSCC | NF-kappa B signaling pathway | 67/3704 | 104/8465 | 1.57e-05 | 6.75e-05 | 3.44e-05 | 67 |
| hsa04622 | Oral cavity | OSCC | RIG-I-like receptor signaling pathway | 41/3704 | 71/8465 | 1.20e-02 | 2.63e-02 | 1.34e-02 | 41 |
| hsa0516419 | Oral cavity | OSCC | Influenza A | 116/3704 | 171/8465 | 1.23e-10 | 1.78e-09 | 9.08e-10 | 116 |
| hsa0406411 | Oral cavity | OSCC | NF-kappa B signaling pathway | 67/3704 | 104/8465 | 1.57e-05 | 6.75e-05 | 3.44e-05 | 67 |
| hsa046221 | Oral cavity | OSCC | RIG-I-like receptor signaling pathway | 41/3704 | 71/8465 | 1.20e-02 | 2.63e-02 | 1.34e-02 | 41 |
| hsa0516424 | Oral cavity | LP | Influenza A | 80/2418 | 171/8465 | 2.56e-07 | 3.41e-06 | 2.20e-06 | 80 |
| hsa046222 | Oral cavity | LP | RIG-I-like receptor signaling pathway | 30/2418 | 71/8465 | 9.09e-03 | 3.33e-02 | 2.14e-02 | 30 |
| hsa0516434 | Oral cavity | LP | Influenza A | 80/2418 | 171/8465 | 2.56e-07 | 3.41e-06 | 2.20e-06 | 80 |
| hsa046223 | Oral cavity | LP | RIG-I-like receptor signaling pathway | 30/2418 | 71/8465 | 9.09e-03 | 3.33e-02 | 2.14e-02 | 30 |
| Page: 1 |
Top |
Cell-cell communication analysis |
| Identification of potential cell-cell interactions between two cell types and their ligand-receptor pairs for different disease states |
| Ligand | Receptor | LRpair | Pathway | Tissue | Disease Stage |
| Page: 1 |
Top |
Single-cell gene regulatory network inference analysis |
| Find out the significant the regulons (TFs) and the target genes of each regulon across cell types for different disease states |
| TF | Cell Type | Tissue | Disease Stage | Target Gene | RSS | Regulon Activity |
| ∗The dot plots of a searched regulon are shown for all cell subpopulations in each disease state of each tissue based on the regulon specific score inferred using pySCENIC and by calculating the average expression. |
| Page: 1 |
Top |
Somatic mutation of malignant transformation related genes |
| Annotation of somatic variants for genes involved in malignant transformation |
| Hugo Symbol | Variant Class | Variant Classification | dbSNP RS | HGVSc | HGVSp | HGVSp Short | SWISSPROT | BIOTYPE | SIFT | PolyPhen | Tumor Sample Barcode | Tissue | Histology | Sex | Age | Stage | Therapy Types | Drugs | Outcome |
| TRIM25 | SNV | Missense_Mutation | rs367715143 | c.1604G>A | p.Arg535Gln | p.R535Q | Q14258 | protein_coding | deleterious(0) | probably_damaging(1) | TCGA-A7-A26I-01 | Breast | breast invasive carcinoma | Female | >=65 | I/II | Chemotherapy | cytoxan | SD |
| TRIM25 | SNV | Missense_Mutation | c.796N>C | p.Glu266Gln | p.E266Q | Q14258 | protein_coding | deleterious(0) | probably_damaging(1) | TCGA-AC-A23H-01 | Breast | breast invasive carcinoma | Female | >=65 | I/II | Unknown | Unknown | PD | |
| TRIM25 | SNV | Missense_Mutation | c.1164N>T | p.Lys388Asn | p.K388N | Q14258 | protein_coding | tolerated(0.15) | benign(0.188) | TCGA-AN-A046-01 | Breast | breast invasive carcinoma | Female | >=65 | I/II | Unknown | Unknown | SD | |
| TRIM25 | insertion | Frame_Shift_Ins | novel | c.1239_1240insCTATATCAGCCACTCCCCTTCACTTGTCCTCTACTTTGTTGCT | p.Asp414LeufsTer15 | p.D414Lfs*15 | Q14258 | protein_coding | TCGA-AN-A0FX-01 | Breast | breast invasive carcinoma | Female | <65 | I/II | Unknown | Unknown | SD | ||
| TRIM25 | insertion | Nonsense_Mutation | novel | c.465_466insCATAATCCTGTCATTGTCTGATGGTGTTTATTTTT | p.Lys156HisfsTer7 | p.K156Hfs*7 | Q14258 | protein_coding | TCGA-BH-A0H0-01 | Breast | breast invasive carcinoma | Female | >=65 | I/II | Hormone Therapy | arimidex | SD | ||
| TRIM25 | SNV | Missense_Mutation | novel | c.1327N>G | p.Thr443Ala | p.T443A | Q14258 | protein_coding | tolerated(0.44) | benign(0) | TCGA-C5-A8YT-01 | Cervix | cervical & endocervical cancer | Female | <65 | I/II | Chemotherapy | cisplatin | PD |
| TRIM25 | SNV | Missense_Mutation | c.1577T>C | p.Val526Ala | p.V526A | Q14258 | protein_coding | deleterious(0) | benign(0.038) | TCGA-AA-3715-01 | Colorectum | colon adenocarcinoma | Male | >=65 | I/II | Unknown | Unknown | PD | |
| TRIM25 | SNV | Missense_Mutation | novel | c.1862G>A | p.Gly621Asp | p.G621D | Q14258 | protein_coding | tolerated(0.08) | probably_damaging(0.984) | TCGA-AA-3972-01 | Colorectum | colon adenocarcinoma | Male | >=65 | III/IV | Chemotherapy | capecitabine | PD |
| TRIM25 | SNV | Missense_Mutation | c.1666A>G | p.Thr556Ala | p.T556A | Q14258 | protein_coding | tolerated(0.16) | benign(0.076) | TCGA-AD-A5EJ-01 | Colorectum | colon adenocarcinoma | Female | >=65 | I/II | Unknown | Unknown | SD | |
| TRIM25 | SNV | Missense_Mutation | rs866223501 | c.1627G>A | p.Gly543Ser | p.G543S | Q14258 | protein_coding | deleterious(0) | probably_damaging(1) | TCGA-AU-6004-01 | Colorectum | colon adenocarcinoma | Female | >=65 | I/II | Unknown | Unknown | SD |
| Page: 1 2 3 4 5 |
Top |
Related drugs of malignant transformation related genes |
| Identification of chemicals and drugs interact with genes involved in malignant transfromation |
| (DGIdb 4.0) |
| Entrez ID | Symbol | Category | Interaction Types | Drug Claim Name | Drug Name | PMIDs |
| Page: 1 |

Copyright 2023-Present -The University of Texas Health Science Center at Houston |