
|
|||||
|
 | |
| |
| |
| |
| |
| |
|
Gene: TIGAR |
Gene summary for TIGAR |
| Gene information | Species | Human | Gene symbol | TIGAR | Gene ID | 57103 |
| Gene name | TP53 induced glycolysis regulatory phosphatase | |
| Gene Alias | C12orf5 | |
| Cytomap | 12p13.32 | |
| Gene Type | protein-coding | GO ID | GO:0000422 | UniProtAcc | Q9NQ88 |
Top |
Malignant transformation analysis |
| Identification of the aberrant gene expression in precancerous and cancerous lesions by comparing the gene expression of stem-like cells in diseased tissues with normal stem cells |
| Entrez ID | Symbol | Replicates | Species | Organ | Tissue | Adj P-value | Log2FC | Malignancy |
| 57103 | TIGAR | LZE4T | Human | Esophagus | ESCC | 5.07e-03 | 8.08e-02 | 0.0811 |
| 57103 | TIGAR | LZE7T | Human | Esophagus | ESCC | 7.90e-05 | 2.33e-01 | 0.0667 |
| 57103 | TIGAR | LZE24T | Human | Esophagus | ESCC | 2.68e-09 | 2.59e-01 | 0.0596 |
| 57103 | TIGAR | LZE6T | Human | Esophagus | ESCC | 9.92e-07 | 1.49e-01 | 0.0845 |
| 57103 | TIGAR | P2T-E | Human | Esophagus | ESCC | 5.11e-40 | 1.26e+00 | 0.1177 |
| 57103 | TIGAR | P4T-E | Human | Esophagus | ESCC | 1.73e-19 | 5.52e-01 | 0.1323 |
| 57103 | TIGAR | P5T-E | Human | Esophagus | ESCC | 3.50e-09 | 1.02e-01 | 0.1327 |
| 57103 | TIGAR | P8T-E | Human | Esophagus | ESCC | 8.03e-09 | 1.12e-01 | 0.0889 |
| 57103 | TIGAR | P9T-E | Human | Esophagus | ESCC | 6.18e-11 | 7.40e-02 | 0.1131 |
| 57103 | TIGAR | P10T-E | Human | Esophagus | ESCC | 1.17e-08 | 9.68e-02 | 0.116 |
| 57103 | TIGAR | P11T-E | Human | Esophagus | ESCC | 6.02e-05 | 1.35e-01 | 0.1426 |
| 57103 | TIGAR | P12T-E | Human | Esophagus | ESCC | 2.65e-16 | 3.84e-01 | 0.1122 |
| 57103 | TIGAR | P15T-E | Human | Esophagus | ESCC | 2.34e-15 | 2.54e-01 | 0.1149 |
| 57103 | TIGAR | P16T-E | Human | Esophagus | ESCC | 3.67e-03 | 8.89e-02 | 0.1153 |
| 57103 | TIGAR | P19T-E | Human | Esophagus | ESCC | 3.72e-07 | 5.22e-01 | 0.1662 |
| 57103 | TIGAR | P20T-E | Human | Esophagus | ESCC | 1.25e-07 | 1.13e-01 | 0.1124 |
| 57103 | TIGAR | P21T-E | Human | Esophagus | ESCC | 6.32e-15 | 2.28e-01 | 0.1617 |
| 57103 | TIGAR | P22T-E | Human | Esophagus | ESCC | 2.94e-15 | 3.60e-01 | 0.1236 |
| 57103 | TIGAR | P23T-E | Human | Esophagus | ESCC | 2.96e-14 | 2.54e-01 | 0.108 |
| 57103 | TIGAR | P24T-E | Human | Esophagus | ESCC | 1.14e-10 | 3.15e-01 | 0.1287 |
| Page: 1 2 3 4 5 |
| Tissue | Expression Dynamics | Abbreviation |
| Esophagus | 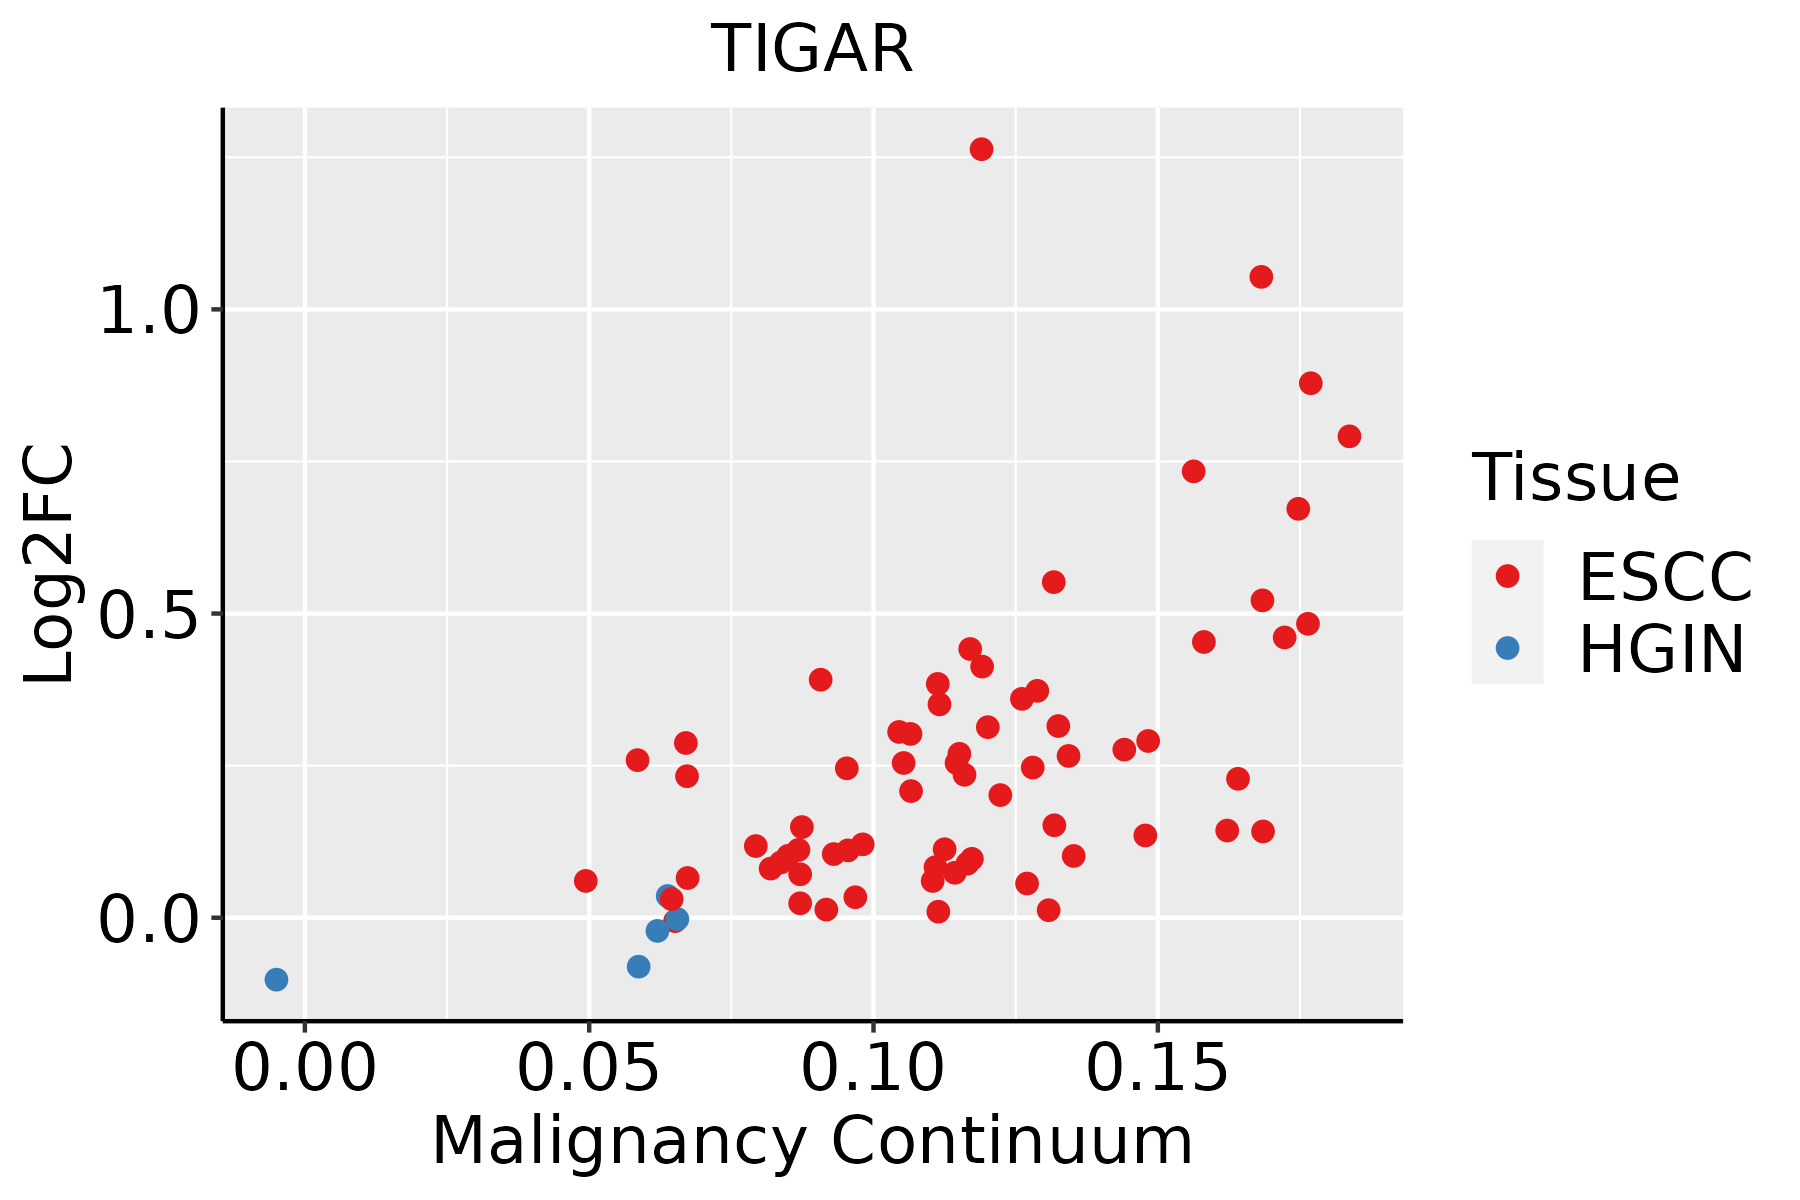 | ESCC: Esophageal squamous cell carcinoma |
| HGIN: High-grade intraepithelial neoplasias | ||
| LGIN: Low-grade intraepithelial neoplasias | ||
| Liver | 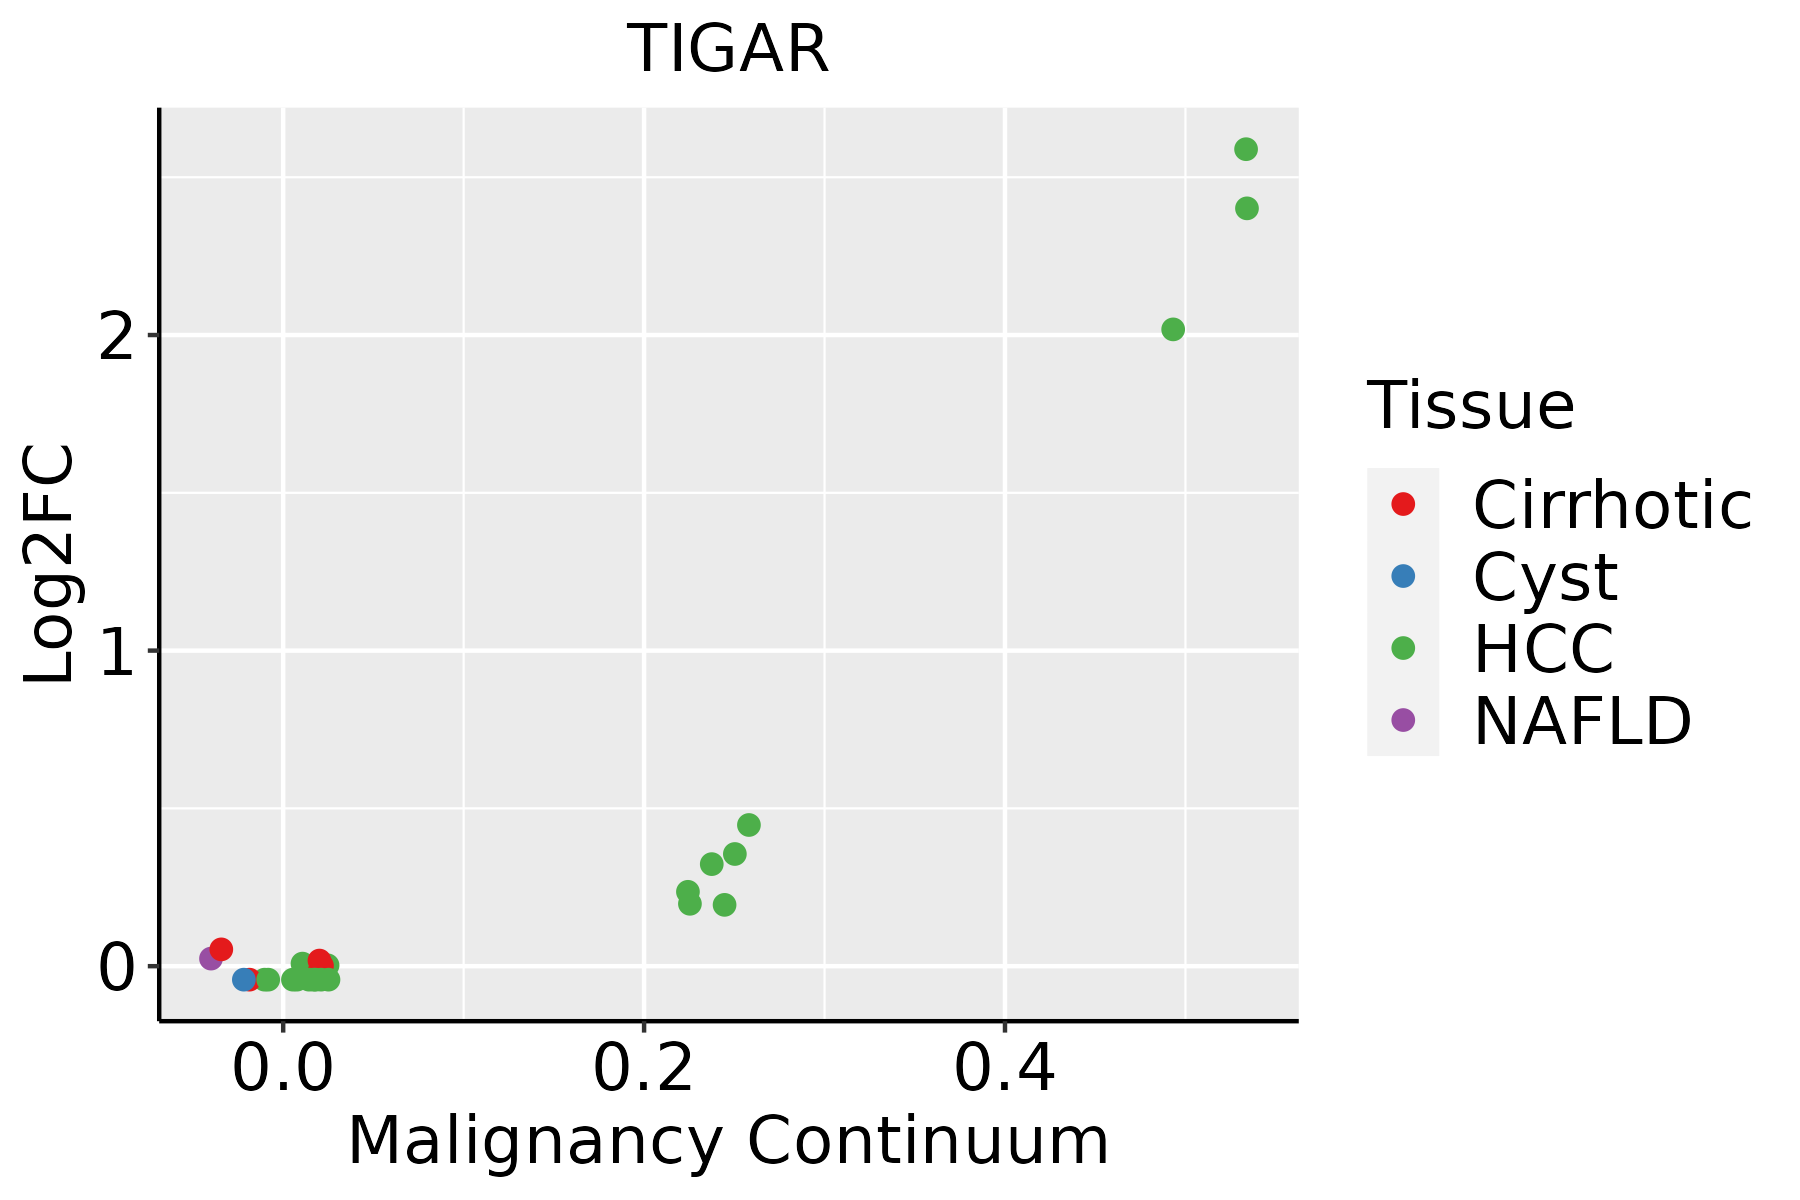 | HCC: Hepatocellular carcinoma |
| NAFLD: Non-alcoholic fatty liver disease | ||
| Oral Cavity |  | EOLP: Erosive Oral lichen planus |
| LP: leukoplakia | ||
| NEOLP: Non-erosive oral lichen planus | ||
| OSCC: Oral squamous cell carcinoma |
| ∗log2FC in expression of this searched gene in stem-like cells from each diseased tissue sample relative to stem-like cells in normal samples in each tissue plotted against the malignancy continuum. Samples are colored based on if they are from different disease stage. |
Top |
Malignant transformation related pathway analysis |
| Find out the enriched GO biological processes and KEGG pathways involved in transition from healthy to precancer to cancer |
| Tissue | Disease Stage | Enriched GO biological Processes |
| Colorectum | AD |  |
| Colorectum | SER |  |
| Colorectum | MSS |  |
| Colorectum | MSI-H |  |
| Colorectum | FAP |  |
| ∗Top 15 enriched GO BP terms are showed in the bar plot of each disease state in each tissue. Each row represents a significant GO biological process which is colored according to the -log10(p.adjust). |
| Page: 1 2 3 4 5 6 7 8 9 |
| GO ID | Tissue | Disease Stage | Description | Gene Ratio | Bg Ratio | pvalue | p.adjust | Count |
| GO:002241119 | Oral cavity | OSCC | cellular component disassembly | 283/7305 | 443/18723 | 9.57e-27 | 3.37e-24 | 283 |
| GO:001623610 | Oral cavity | OSCC | macroautophagy | 192/7305 | 291/18723 | 7.01e-21 | 1.14e-18 | 192 |
| GO:000609118 | Oral cavity | OSCC | generation of precursor metabolites and energy | 286/7305 | 490/18723 | 1.45e-18 | 1.71e-16 | 286 |
| GO:001050610 | Oral cavity | OSCC | regulation of autophagy | 198/7305 | 317/18723 | 1.63e-17 | 1.51e-15 | 198 |
| GO:19030088 | Oral cavity | OSCC | organelle disassembly | 85/7305 | 114/18723 | 1.15e-14 | 6.93e-13 | 85 |
| GO:001598018 | Oral cavity | OSCC | energy derivation by oxidation of organic compounds | 190/7305 | 318/18723 | 4.10e-14 | 2.26e-12 | 190 |
| GO:005105210 | Oral cavity | OSCC | regulation of DNA metabolic process | 207/7305 | 359/18723 | 4.45e-13 | 2.17e-11 | 207 |
| GO:001056320 | Oral cavity | OSCC | negative regulation of phosphorus metabolic process | 246/7305 | 442/18723 | 6.12e-13 | 2.89e-11 | 246 |
| GO:004593620 | Oral cavity | OSCC | negative regulation of phosphate metabolic process | 245/7305 | 441/18723 | 8.85e-13 | 4.09e-11 | 245 |
| GO:004603420 | Oral cavity | OSCC | ATP metabolic process | 166/7305 | 277/18723 | 1.16e-12 | 5.12e-11 | 166 |
| GO:007048219 | Oral cavity | OSCC | response to oxygen levels | 200/7305 | 347/18723 | 1.17e-12 | 5.13e-11 | 200 |
| GO:00162417 | Oral cavity | OSCC | regulation of macroautophagy | 96/7305 | 141/18723 | 2.33e-12 | 9.75e-11 | 96 |
| GO:001082117 | Oral cavity | OSCC | regulation of mitochondrion organization | 97/7305 | 144/18723 | 4.78e-12 | 1.83e-10 | 97 |
| GO:00102128 | Oral cavity | OSCC | response to ionizing radiation | 99/7305 | 148/18723 | 5.49e-12 | 2.08e-10 | 99 |
| GO:005105414 | Oral cavity | OSCC | positive regulation of DNA metabolic process | 126/7305 | 201/18723 | 8.12e-12 | 3.01e-10 | 126 |
| GO:000166619 | Oral cavity | OSCC | response to hypoxia | 177/7305 | 307/18723 | 2.21e-11 | 7.50e-10 | 177 |
| GO:004232619 | Oral cavity | OSCC | negative regulation of phosphorylation | 214/7305 | 385/18723 | 2.30e-11 | 7.74e-10 | 214 |
| GO:007099720 | Oral cavity | OSCC | neuron death | 202/7305 | 361/18723 | 3.75e-11 | 1.23e-09 | 202 |
| GO:003629319 | Oral cavity | OSCC | response to decreased oxygen levels | 182/7305 | 322/18723 | 1.14e-10 | 3.41e-09 | 182 |
| GO:000989519 | Oral cavity | OSCC | negative regulation of catabolic process | 180/7305 | 320/18723 | 2.44e-10 | 6.86e-09 | 180 |
| Page: 1 2 3 4 5 6 7 8 9 10 11 12 13 14 |
| Pathway ID | Tissue | Disease Stage | Description | Gene Ratio | Bg Ratio | pvalue | p.adjust | qvalue | Count |
| hsa0523018 | Esophagus | ESCC | Central carbon metabolism in cancer | 50/4205 | 70/8465 | 1.70e-04 | 6.62e-04 | 3.39e-04 | 50 |
| hsa000512 | Esophagus | ESCC | Fructose and mannose metabolism | 24/4205 | 34/8465 | 1.09e-02 | 2.51e-02 | 1.29e-02 | 24 |
| hsa0523019 | Esophagus | ESCC | Central carbon metabolism in cancer | 50/4205 | 70/8465 | 1.70e-04 | 6.62e-04 | 3.39e-04 | 50 |
| hsa0005111 | Esophagus | ESCC | Fructose and mannose metabolism | 24/4205 | 34/8465 | 1.09e-02 | 2.51e-02 | 1.29e-02 | 24 |
| hsa0523021 | Liver | HCC | Central carbon metabolism in cancer | 43/4020 | 70/8465 | 1.30e-02 | 3.19e-02 | 1.78e-02 | 43 |
| hsa0523031 | Liver | HCC | Central carbon metabolism in cancer | 43/4020 | 70/8465 | 1.30e-02 | 3.19e-02 | 1.78e-02 | 43 |
| hsa0523016 | Oral cavity | OSCC | Central carbon metabolism in cancer | 49/3704 | 70/8465 | 7.57e-06 | 3.59e-05 | 1.83e-05 | 49 |
| hsa0523017 | Oral cavity | OSCC | Central carbon metabolism in cancer | 49/3704 | 70/8465 | 7.57e-06 | 3.59e-05 | 1.83e-05 | 49 |
| Page: 1 |
Top |
Cell-cell communication analysis |
| Identification of potential cell-cell interactions between two cell types and their ligand-receptor pairs for different disease states |
| Ligand | Receptor | LRpair | Pathway | Tissue | Disease Stage |
| Page: 1 |
Top |
Single-cell gene regulatory network inference analysis |
| Find out the significant the regulons (TFs) and the target genes of each regulon across cell types for different disease states |
| TF | Cell Type | Tissue | Disease Stage | Target Gene | RSS | Regulon Activity |
| ∗The dot plots of a searched regulon are shown for all cell subpopulations in each disease state of each tissue based on the regulon specific score inferred using pySCENIC and by calculating the average expression. |
| Page: 1 |
Top |
Somatic mutation of malignant transformation related genes |
| Annotation of somatic variants for genes involved in malignant transformation |
| Hugo Symbol | Variant Class | Variant Classification | dbSNP RS | HGVSc | HGVSp | HGVSp Short | SWISSPROT | BIOTYPE | SIFT | PolyPhen | Tumor Sample Barcode | Tissue | Histology | Sex | Age | Stage | Therapy Types | Drugs | Outcome |
| TIGAR | SNV | Missense_Mutation | novel | c.60A>T | p.Lys20Asn | p.K20N | Q9NQ88 | protein_coding | deleterious(0.01) | possibly_damaging(0.718) | TCGA-A2-A0T4-01 | Breast | breast invasive carcinoma | Female | <65 | I/II | Hormone Therapy | femara | SD |
| TIGAR | SNV | Missense_Mutation | rs761636771 | c.263G>A | p.Arg88Gln | p.R88Q | Q9NQ88 | protein_coding | deleterious(0) | probably_damaging(0.994) | TCGA-AN-A0AK-01 | Breast | breast invasive carcinoma | Female | >=65 | I/II | Unknown | Unknown | SD |
| TIGAR | SNV | Missense_Mutation | novel | c.55N>C | p.Glu19Gln | p.E19Q | Q9NQ88 | protein_coding | tolerated(0.1) | benign(0.145) | TCGA-BH-A2L8-01 | Breast | breast invasive carcinoma | Female | <65 | I/II | Chemotherapy | cytoxan | CR |
| TIGAR | SNV | Missense_Mutation | c.74A>C | p.Gln25Pro | p.Q25P | Q9NQ88 | protein_coding | deleterious(0) | probably_damaging(0.997) | TCGA-E2-A1LG-01 | Breast | breast invasive carcinoma | Female | <65 | I/II | Chemotherapy | doxorubicin | SD | |
| TIGAR | SNV | Missense_Mutation | c.199N>A | p.His67Asn | p.H67N | Q9NQ88 | protein_coding | tolerated(0.31) | benign(0.033) | TCGA-GM-A2DA-01 | Breast | breast invasive carcinoma | Female | <65 | I/II | Chemotherapy | fluorouracil | PD | |
| TIGAR | SNV | Missense_Mutation | novel | c.305A>G | p.Glu102Gly | p.E102G | Q9NQ88 | protein_coding | deleterious(0.02) | possibly_damaging(0.524) | TCGA-EI-6884-01 | Colorectum | rectum adenocarcinoma | Male | >=65 | III/IV | Chemotherapy | 5 | SD |
| TIGAR | SNV | Missense_Mutation | novel | c.668N>A | p.Arg223Lys | p.R223K | Q9NQ88 | protein_coding | tolerated(1) | benign(0) | TCGA-A5-A2K5-01 | Endometrium | uterine corpus endometrioid carcinoma | Female | >=65 | I/II | Unknown | Unknown | SD |
| TIGAR | SNV | Missense_Mutation | novel | c.400N>A | p.Asp134Asn | p.D134N | Q9NQ88 | protein_coding | tolerated(0.06) | possibly_damaging(0.73) | TCGA-AJ-A3EK-01 | Endometrium | uterine corpus endometrioid carcinoma | Female | <65 | I/II | Chemotherapy | carboplatin | CR |
| TIGAR | SNV | Missense_Mutation | c.44G>T | p.Arg15Ile | p.R15I | Q9NQ88 | protein_coding | deleterious(0) | possibly_damaging(0.863) | TCGA-AP-A056-01 | Endometrium | uterine corpus endometrioid carcinoma | Female | <65 | I/II | Unknown | Unknown | SD | |
| TIGAR | SNV | Missense_Mutation | rs767984762 | c.554G>A | p.Gly185Asp | p.G185D | Q9NQ88 | protein_coding | tolerated(0.09) | possibly_damaging(0.655) | TCGA-AX-A064-01 | Endometrium | uterine corpus endometrioid carcinoma | Female | >=65 | I/II | Unknown | Unknown | SD |
| Page: 1 2 3 4 |
Top |
Related drugs of malignant transformation related genes |
| Identification of chemicals and drugs interact with genes involved in malignant transfromation |
| (DGIdb 4.0) |
| Entrez ID | Symbol | Category | Interaction Types | Drug Claim Name | Drug Name | PMIDs |
| Page: 1 |

Copyright 2023-Present -The University of Texas Health Science Center at Houston |