
|
|||||
|
 | |
| |
| |
| |
| |
| |
|
Gene: SYF2 |
Gene summary for SYF2 |
| Gene information | Species | Human | Gene symbol | SYF2 | Gene ID | 25949 |
| Gene name | SYF2 pre-mRNA splicing factor | |
| Gene Alias | CBPIN | |
| Cytomap | 1p36.11 | |
| Gene Type | protein-coding | GO ID | GO:0000075 | UniProtAcc | O95926 |
Top |
Malignant transformation analysis |
| Identification of the aberrant gene expression in precancerous and cancerous lesions by comparing the gene expression of stem-like cells in diseased tissues with normal stem cells |
| Entrez ID | Symbol | Replicates | Species | Organ | Tissue | Adj P-value | Log2FC | Malignancy |
| 25949 | SYF2 | CA_HPV_1 | Human | Cervix | CC | 6.29e-10 | -8.69e-02 | 0.0264 |
| 25949 | SYF2 | CA_HPV_3 | Human | Cervix | CC | 2.83e-03 | 1.28e-01 | 0.0414 |
| 25949 | SYF2 | CCI_1 | Human | Cervix | CC | 2.95e-06 | -5.88e-01 | 0.528 |
| 25949 | SYF2 | CCI_3 | Human | Cervix | CC | 1.95e-08 | -5.91e-01 | 0.516 |
| 25949 | SYF2 | CCII_1 | Human | Cervix | CC | 4.49e-21 | -6.68e-01 | 0.3249 |
| 25949 | SYF2 | L1 | Human | Cervix | CC | 2.56e-03 | -1.56e-01 | 0.0802 |
| 25949 | SYF2 | HTA11_3410_2000001011 | Human | Colorectum | AD | 3.18e-08 | 2.76e-01 | 0.0155 |
| 25949 | SYF2 | HTA11_2487_2000001011 | Human | Colorectum | SER | 2.61e-03 | 2.87e-01 | -0.1808 |
| 25949 | SYF2 | HTA11_1938_2000001011 | Human | Colorectum | AD | 2.57e-10 | 5.06e-01 | -0.0811 |
| 25949 | SYF2 | HTA11_78_2000001011 | Human | Colorectum | AD | 2.77e-04 | 3.69e-01 | -0.1088 |
| 25949 | SYF2 | HTA11_347_2000001011 | Human | Colorectum | AD | 5.25e-19 | 5.13e-01 | -0.1954 |
| 25949 | SYF2 | HTA11_696_2000001011 | Human | Colorectum | AD | 7.80e-05 | 3.23e-01 | -0.1464 |
| 25949 | SYF2 | HTA11_866_2000001011 | Human | Colorectum | AD | 5.79e-03 | 3.47e-01 | -0.1001 |
| 25949 | SYF2 | HTA11_1391_2000001011 | Human | Colorectum | AD | 5.20e-09 | 4.86e-01 | -0.059 |
| 25949 | SYF2 | HTA11_5212_2000001011 | Human | Colorectum | AD | 2.61e-04 | 3.48e-01 | -0.2061 |
| 25949 | SYF2 | HTA11_866_3004761011 | Human | Colorectum | AD | 1.08e-09 | 3.61e-01 | 0.096 |
| 25949 | SYF2 | HTA11_4255_2000001011 | Human | Colorectum | SER | 2.55e-04 | 5.82e-01 | 0.0446 |
| 25949 | SYF2 | HTA11_7663_2000001011 | Human | Colorectum | SER | 8.68e-04 | 4.93e-01 | 0.0131 |
| 25949 | SYF2 | HTA11_10711_2000001011 | Human | Colorectum | AD | 8.22e-05 | 3.36e-01 | 0.0338 |
| 25949 | SYF2 | HTA11_7696_3000711011 | Human | Colorectum | AD | 4.36e-04 | 3.40e-01 | 0.0674 |
| Page: 1 2 3 4 5 6 7 8 9 10 |
| Tissue | Expression Dynamics | Abbreviation |
| Cervix |  | CC: Cervix cancer |
| HSIL_HPV: HPV-infected high-grade squamous intraepithelial lesions | ||
| N_HPV: HPV-infected normal cervix | ||
| Colorectum (GSE201348) |  | FAP: Familial adenomatous polyposis |
| CRC: Colorectal cancer | ||
| Colorectum (HTA11) |  | AD: Adenomas |
| SER: Sessile serrated lesions | ||
| MSI-H: Microsatellite-high colorectal cancer | ||
| MSS: Microsatellite stable colorectal cancer | ||
| Endometrium | 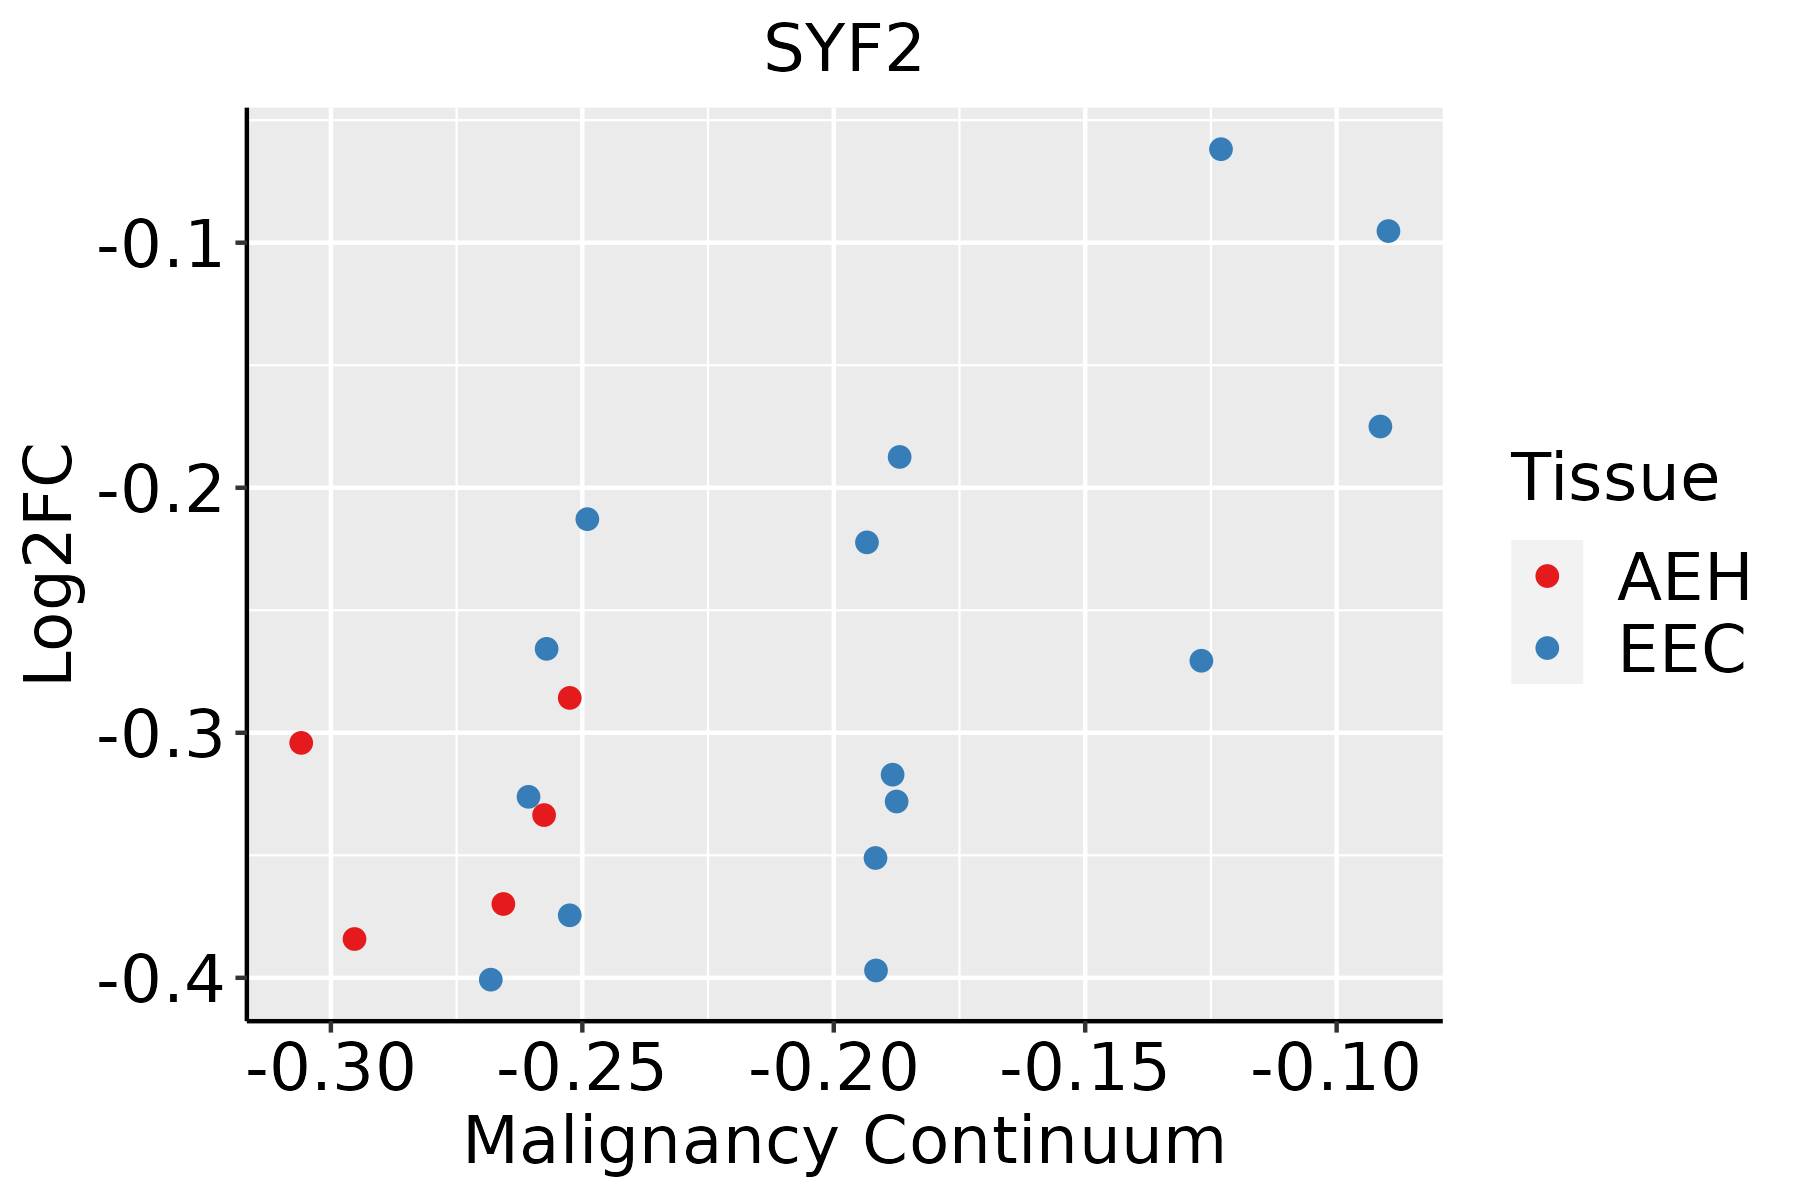 | AEH: Atypical endometrial hyperplasia |
| EEC: Endometrioid Cancer | ||
| Esophagus | 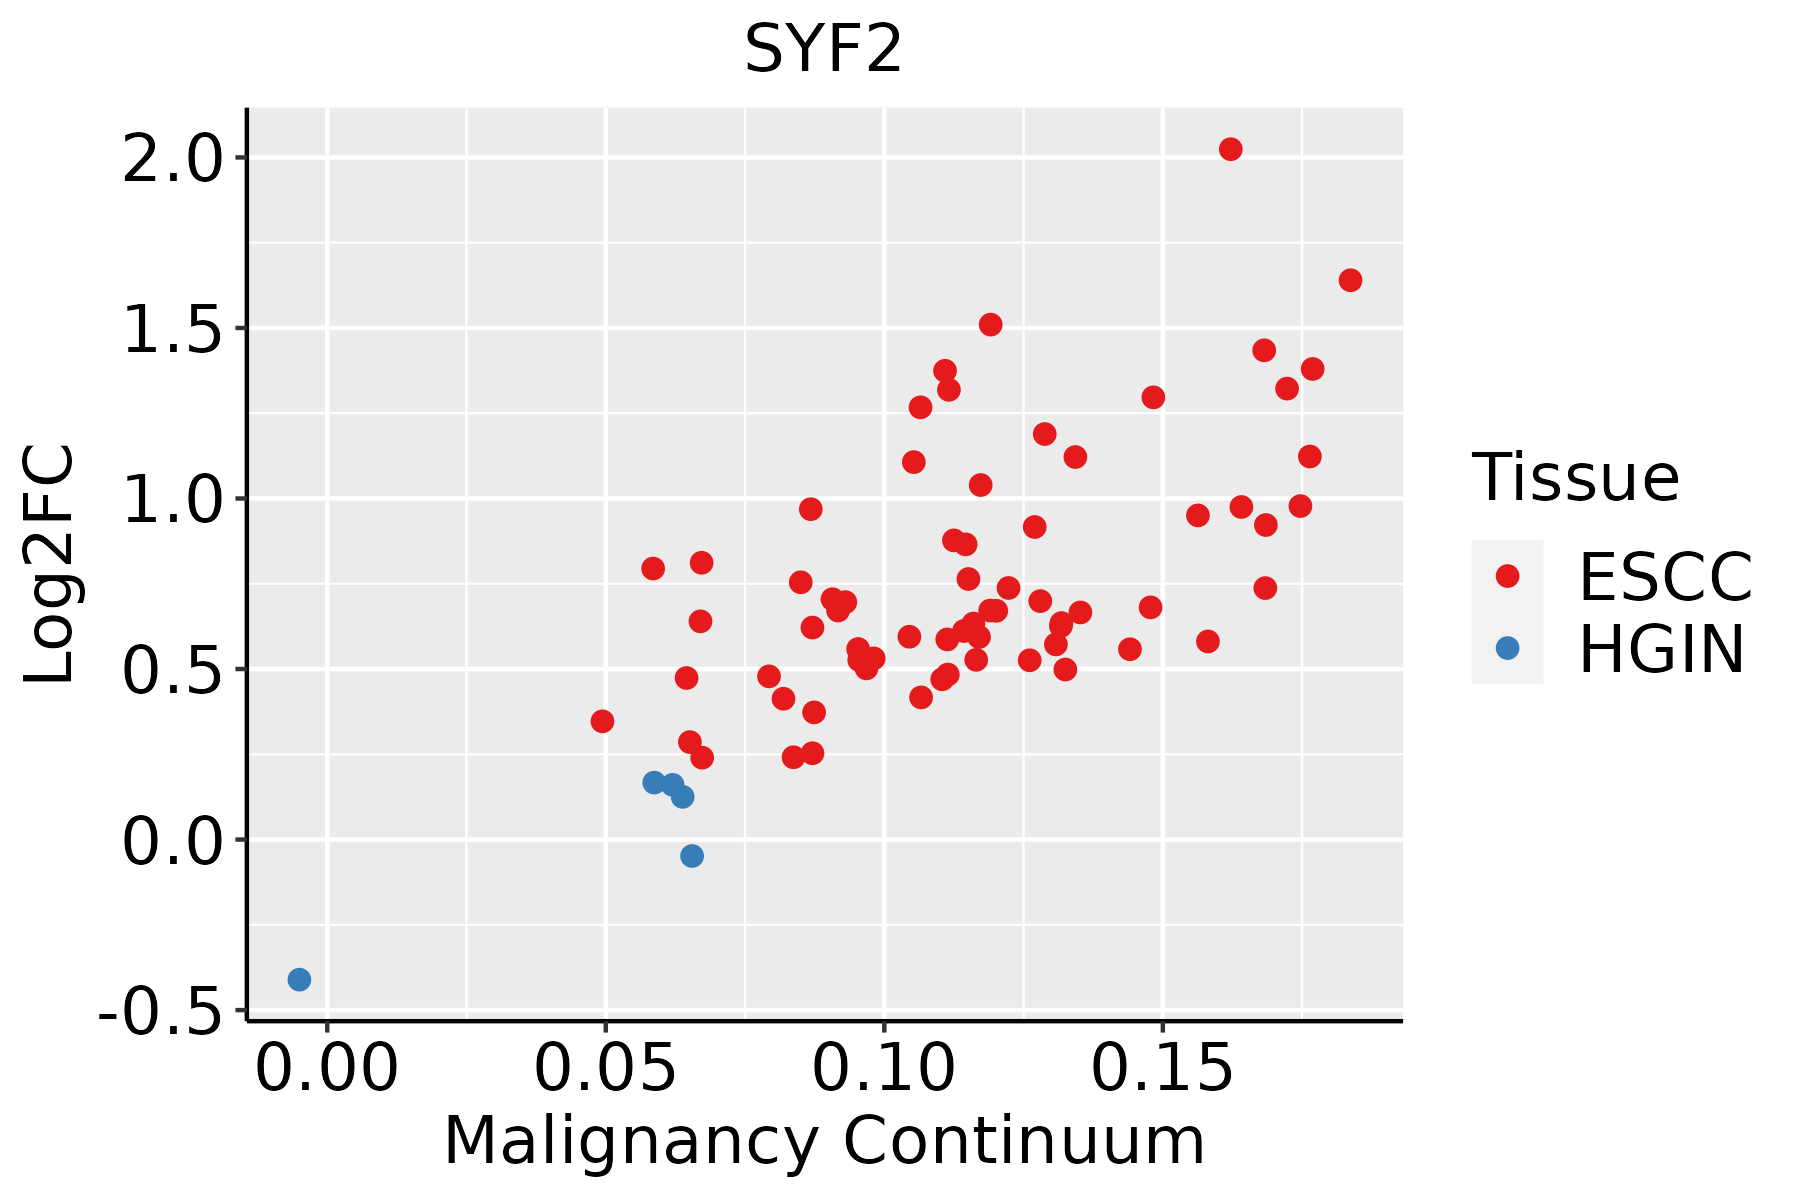 | ESCC: Esophageal squamous cell carcinoma |
| HGIN: High-grade intraepithelial neoplasias | ||
| LGIN: Low-grade intraepithelial neoplasias | ||
| Liver |  | HCC: Hepatocellular carcinoma |
| NAFLD: Non-alcoholic fatty liver disease | ||
| Oral Cavity |  | EOLP: Erosive Oral lichen planus |
| LP: leukoplakia | ||
| NEOLP: Non-erosive oral lichen planus | ||
| OSCC: Oral squamous cell carcinoma | ||
| Prostate | 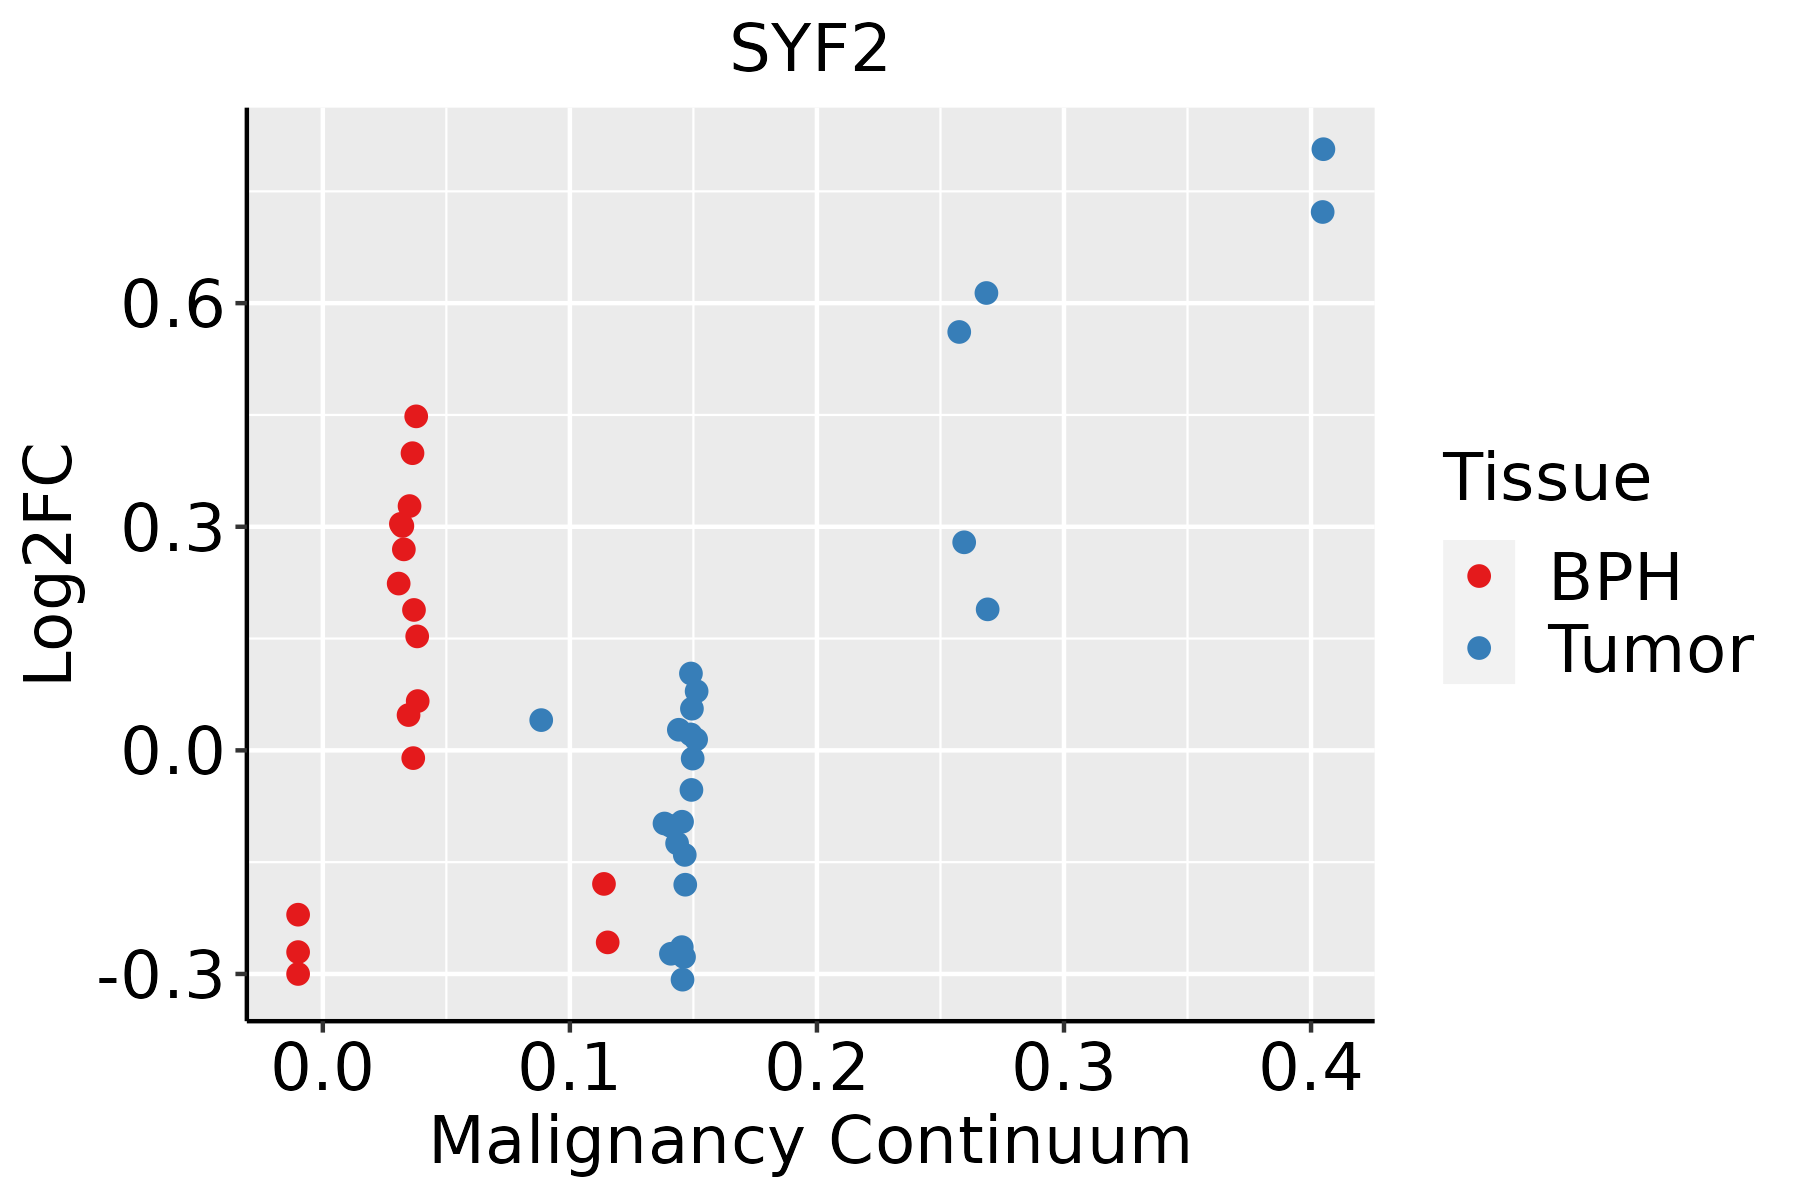 | BPH: Benign Prostatic Hyperplasia |
| Skin | 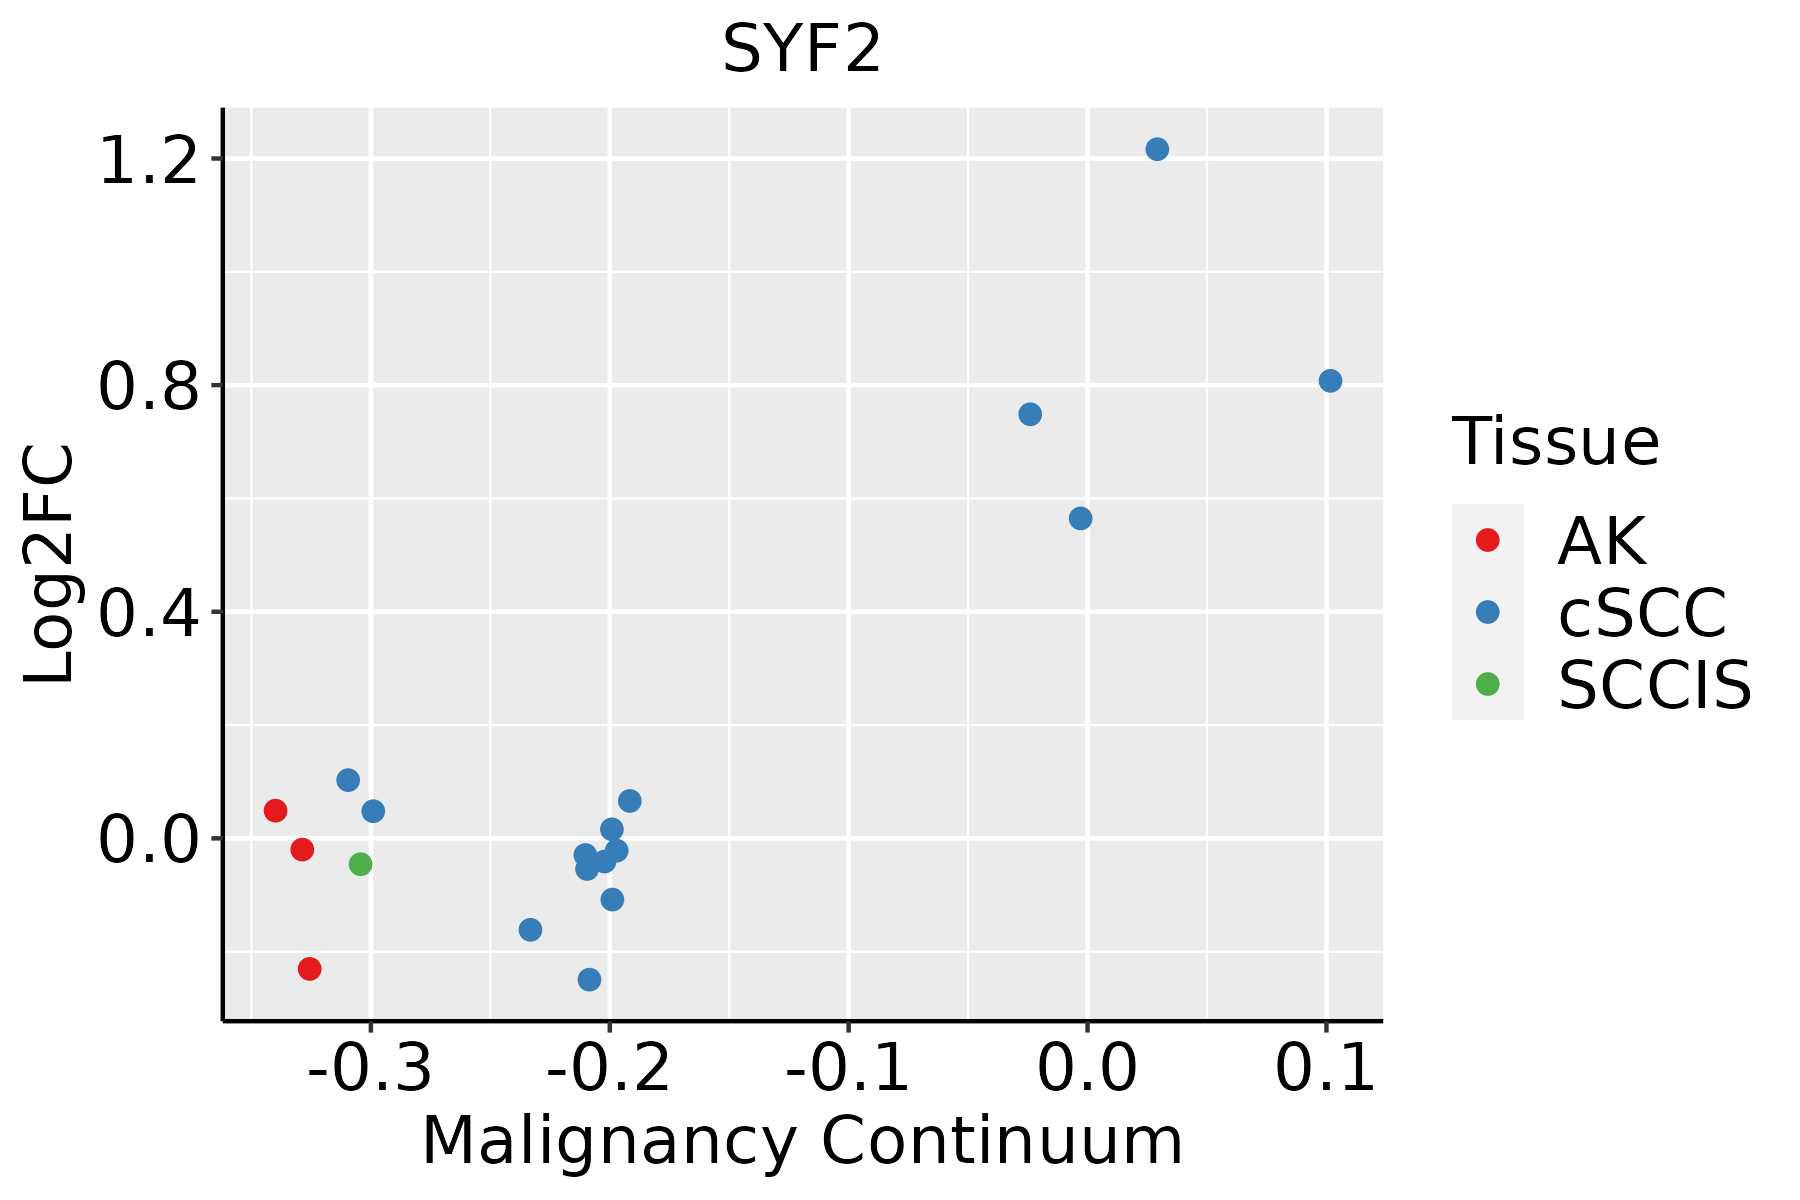 | AK: Actinic keratosis |
| cSCC: Cutaneous squamous cell carcinoma | ||
| SCCIS:squamous cell carcinoma in situ | ||
| Thyroid | 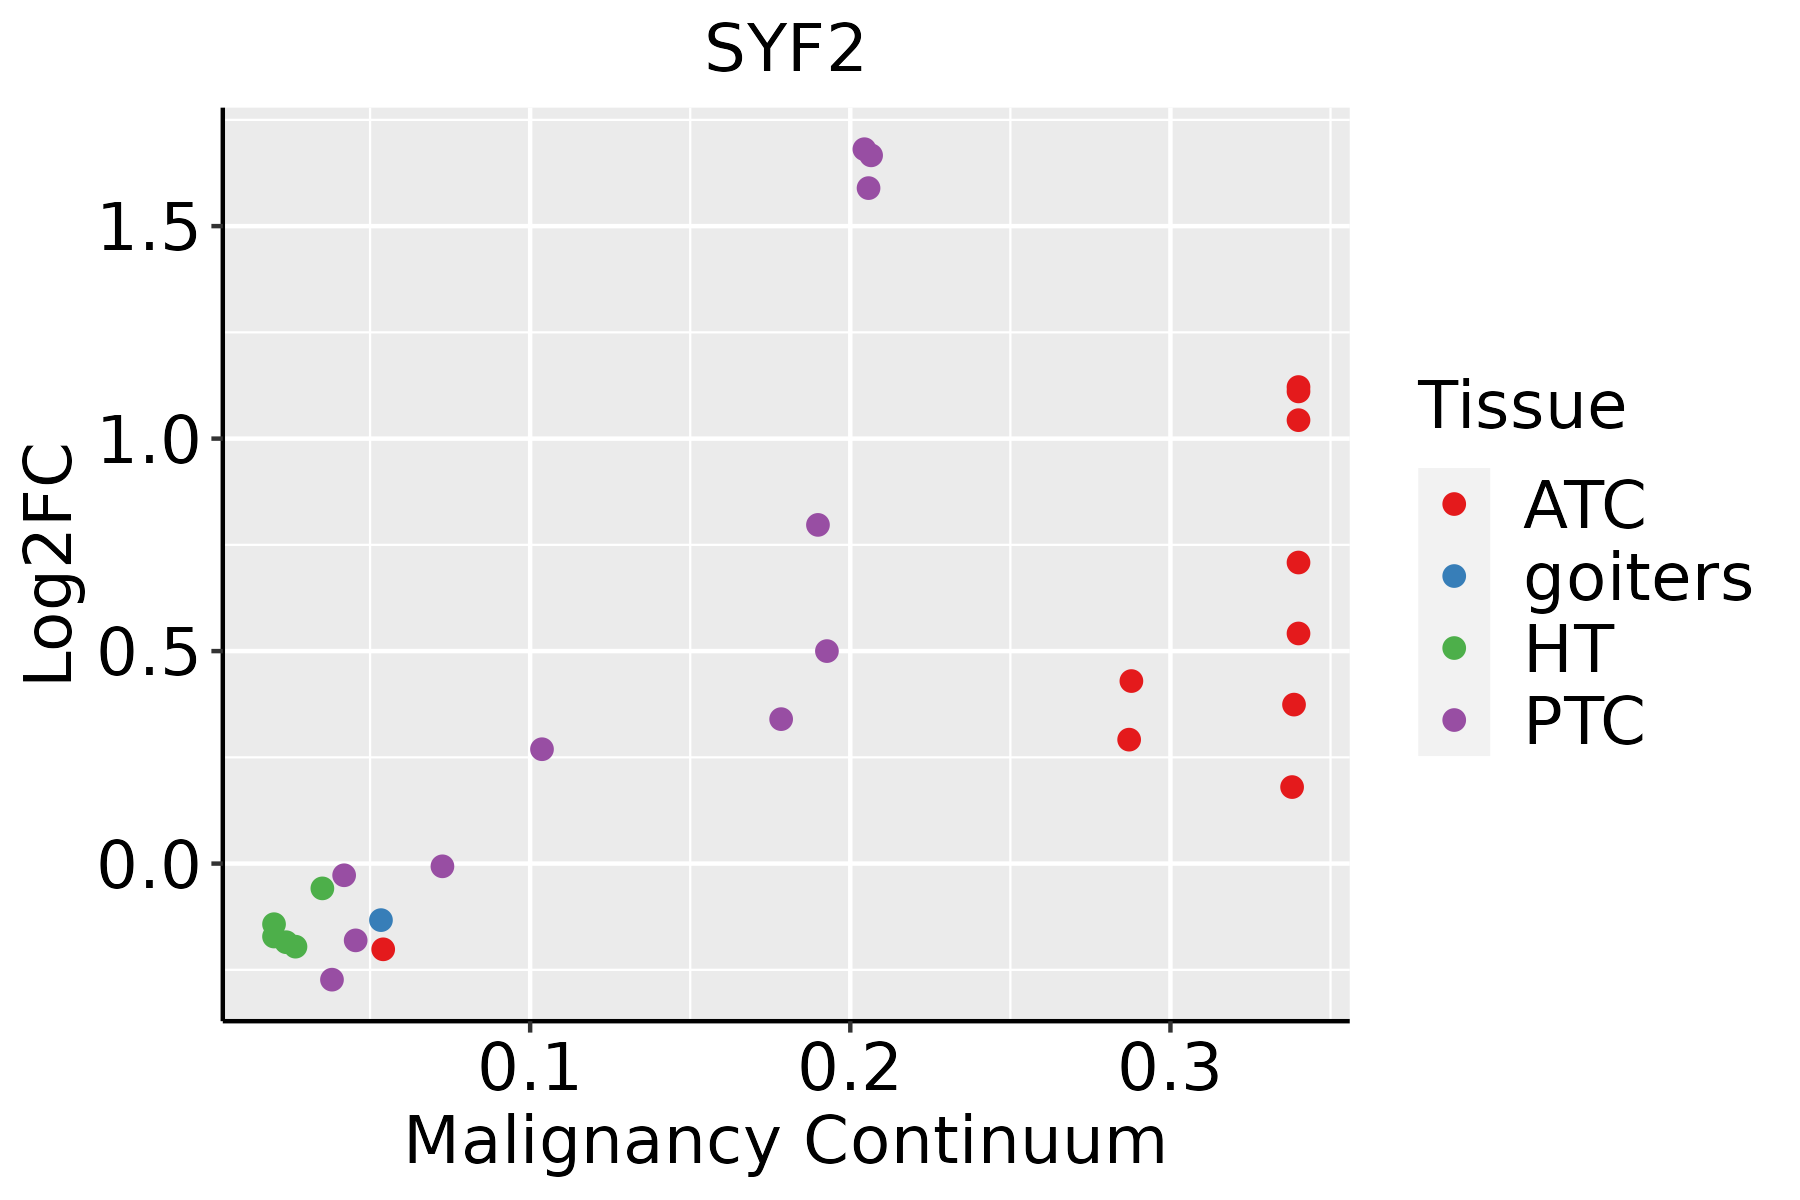 | ATC: Anaplastic thyroid cancer |
| HT: Hashimoto's thyroiditis | ||
| PTC: Papillary thyroid cancer |
| ∗log2FC in expression of this searched gene in stem-like cells from each diseased tissue sample relative to stem-like cells in normal samples in each tissue plotted against the malignancy continuum. Samples are colored based on if they are from different disease stage. |
Top |
Malignant transformation related pathway analysis |
| Find out the enriched GO biological processes and KEGG pathways involved in transition from healthy to precancer to cancer |
| Tissue | Disease Stage | Enriched GO biological Processes |
| Colorectum | AD |  |
| Colorectum | SER |  |
| Colorectum | MSS |  |
| Colorectum | MSI-H |  |
| Colorectum | FAP |  |
| ∗Top 15 enriched GO BP terms are showed in the bar plot of each disease state in each tissue. Each row represents a significant GO biological process which is colored according to the -log10(p.adjust). |
| Page: 1 2 3 4 5 6 7 8 9 |
| GO ID | Tissue | Disease Stage | Description | Gene Ratio | Bg Ratio | pvalue | p.adjust | Count |
| GO:000037517 | Prostate | BPH | RNA splicing, via transesterification reactions | 114/3107 | 324/18723 | 2.19e-16 | 4.53e-14 | 114 |
| GO:000037717 | Prostate | BPH | RNA splicing, via transesterification reactions with bulged adenosine as nucleophile | 112/3107 | 320/18723 | 6.21e-16 | 1.07e-13 | 112 |
| GO:000039817 | Prostate | BPH | mRNA splicing, via spliceosome | 112/3107 | 320/18723 | 6.21e-16 | 1.07e-13 | 112 |
| GO:000170110 | Prostate | BPH | in utero embryonic development | 104/3107 | 367/18723 | 9.17e-09 | 3.10e-07 | 104 |
| GO:00447727 | Prostate | BPH | mitotic cell cycle phase transition | 112/3107 | 424/18723 | 1.57e-07 | 3.58e-06 | 112 |
| GO:00073468 | Prostate | BPH | regulation of mitotic cell cycle | 115/3107 | 457/18723 | 1.52e-06 | 2.62e-05 | 115 |
| GO:19019904 | Prostate | BPH | regulation of mitotic cell cycle phase transition | 77/3107 | 299/18723 | 3.36e-05 | 3.77e-04 | 77 |
| GO:00427706 | Prostate | BPH | signal transduction in response to DNA damage | 49/3107 | 172/18723 | 6.21e-05 | 6.23e-04 | 49 |
| GO:00457863 | Prostate | BPH | negative regulation of cell cycle | 91/3107 | 385/18723 | 2.10e-04 | 1.71e-03 | 91 |
| GO:00073696 | Prostate | BPH | gastrulation | 50/3107 | 185/18723 | 2.20e-04 | 1.78e-03 | 50 |
| GO:00459303 | Prostate | BPH | negative regulation of mitotic cell cycle | 60/3107 | 235/18723 | 3.00e-04 | 2.32e-03 | 60 |
| GO:19019874 | Prostate | BPH | regulation of cell cycle phase transition | 89/3107 | 390/18723 | 8.17e-04 | 5.34e-03 | 89 |
| GO:19019913 | Prostate | BPH | negative regulation of mitotic cell cycle phase transition | 46/3107 | 179/18723 | 1.24e-03 | 7.51e-03 | 46 |
| GO:000838019 | Prostate | Tumor | RNA splicing | 153/3246 | 434/18723 | 9.15e-20 | 5.79e-17 | 153 |
| GO:000037518 | Prostate | Tumor | RNA splicing, via transesterification reactions | 119/3246 | 324/18723 | 3.40e-17 | 1.06e-14 | 119 |
| GO:000037718 | Prostate | Tumor | RNA splicing, via transesterification reactions with bulged adenosine as nucleophile | 117/3246 | 320/18723 | 9.31e-17 | 2.22e-14 | 117 |
| GO:000039818 | Prostate | Tumor | mRNA splicing, via spliceosome | 117/3246 | 320/18723 | 9.31e-17 | 2.22e-14 | 117 |
| GO:000170115 | Prostate | Tumor | in utero embryonic development | 106/3246 | 367/18723 | 2.37e-08 | 8.09e-07 | 106 |
| GO:000734613 | Prostate | Tumor | regulation of mitotic cell cycle | 113/3246 | 457/18723 | 3.37e-05 | 3.96e-04 | 113 |
| GO:004477214 | Prostate | Tumor | mitotic cell cycle phase transition | 106/3246 | 424/18723 | 3.61e-05 | 4.21e-04 | 106 |
| Page: 1 2 3 4 5 6 7 8 9 10 11 12 13 14 15 16 |
| Pathway ID | Tissue | Disease Stage | Description | Gene Ratio | Bg Ratio | pvalue | p.adjust | qvalue | Count |
| hsa03040 | Colorectum | AD | Spliceosome | 73/2092 | 217/8465 | 1.73e-03 | 9.68e-03 | 6.18e-03 | 73 |
| hsa030401 | Colorectum | AD | Spliceosome | 73/2092 | 217/8465 | 1.73e-03 | 9.68e-03 | 6.18e-03 | 73 |
| hsa030402 | Colorectum | MSS | Spliceosome | 66/1875 | 217/8465 | 2.58e-03 | 1.27e-02 | 7.81e-03 | 66 |
| hsa030403 | Colorectum | MSS | Spliceosome | 66/1875 | 217/8465 | 2.58e-03 | 1.27e-02 | 7.81e-03 | 66 |
| hsa030404 | Colorectum | MSI-H | Spliceosome | 37/797 | 217/8465 | 2.49e-04 | 3.23e-03 | 2.70e-03 | 37 |
| hsa030405 | Colorectum | MSI-H | Spliceosome | 37/797 | 217/8465 | 2.49e-04 | 3.23e-03 | 2.70e-03 | 37 |
| hsa030409 | Endometrium | AEH | Spliceosome | 54/1197 | 217/8465 | 1.47e-05 | 1.65e-04 | 1.21e-04 | 54 |
| hsa0304014 | Endometrium | AEH | Spliceosome | 54/1197 | 217/8465 | 1.47e-05 | 1.65e-04 | 1.21e-04 | 54 |
| hsa0304024 | Endometrium | EEC | Spliceosome | 54/1237 | 217/8465 | 3.78e-05 | 3.88e-04 | 2.89e-04 | 54 |
| hsa0304034 | Endometrium | EEC | Spliceosome | 54/1237 | 217/8465 | 3.78e-05 | 3.88e-04 | 2.89e-04 | 54 |
| hsa0304018 | Esophagus | HGIN | Spliceosome | 79/1383 | 217/8465 | 3.22e-13 | 7.00e-12 | 5.56e-12 | 79 |
| hsa0304019 | Esophagus | HGIN | Spliceosome | 79/1383 | 217/8465 | 3.22e-13 | 7.00e-12 | 5.56e-12 | 79 |
| hsa0304027 | Esophagus | ESCC | Spliceosome | 128/4205 | 217/8465 | 3.31e-03 | 8.79e-03 | 4.50e-03 | 128 |
| hsa0304037 | Esophagus | ESCC | Spliceosome | 128/4205 | 217/8465 | 3.31e-03 | 8.79e-03 | 4.50e-03 | 128 |
| hsa030407 | Liver | Cirrhotic | Spliceosome | 102/2530 | 217/8465 | 5.69e-08 | 9.47e-07 | 5.84e-07 | 102 |
| hsa0304012 | Liver | Cirrhotic | Spliceosome | 102/2530 | 217/8465 | 5.69e-08 | 9.47e-07 | 5.84e-07 | 102 |
| hsa0304022 | Liver | HCC | Spliceosome | 122/4020 | 217/8465 | 5.55e-03 | 1.60e-02 | 8.91e-03 | 122 |
| hsa0304032 | Liver | HCC | Spliceosome | 122/4020 | 217/8465 | 5.55e-03 | 1.60e-02 | 8.91e-03 | 122 |
| hsa0304016 | Oral cavity | OSCC | Spliceosome | 123/3704 | 217/8465 | 7.21e-05 | 2.74e-04 | 1.40e-04 | 123 |
| hsa0304017 | Oral cavity | OSCC | Spliceosome | 123/3704 | 217/8465 | 7.21e-05 | 2.74e-04 | 1.40e-04 | 123 |
| Page: 1 2 |
Top |
Cell-cell communication analysis |
| Identification of potential cell-cell interactions between two cell types and their ligand-receptor pairs for different disease states |
| Ligand | Receptor | LRpair | Pathway | Tissue | Disease Stage |
| Page: 1 |
Top |
Single-cell gene regulatory network inference analysis |
| Find out the significant the regulons (TFs) and the target genes of each regulon across cell types for different disease states |
| TF | Cell Type | Tissue | Disease Stage | Target Gene | RSS | Regulon Activity |
| ∗The dot plots of a searched regulon are shown for all cell subpopulations in each disease state of each tissue based on the regulon specific score inferred using pySCENIC and by calculating the average expression. |
| Page: 1 |
Top |
Somatic mutation of malignant transformation related genes |
| Annotation of somatic variants for genes involved in malignant transformation |
| Hugo Symbol | Variant Class | Variant Classification | dbSNP RS | HGVSc | HGVSp | HGVSp Short | SWISSPROT | BIOTYPE | SIFT | PolyPhen | Tumor Sample Barcode | Tissue | Histology | Sex | Age | Stage | Therapy Types | Drugs | Outcome |
| SYF2 | SNV | Missense_Mutation | novel | c.104N>A | p.Arg35His | p.R35H | O95926 | protein_coding | deleterious(0.02) | benign(0.013) | TCGA-A2-A3KD-01 | Breast | breast invasive carcinoma | Female | <65 | III/IV | Chemotherapy | taxotere | SD |
| SYF2 | SNV | Missense_Mutation | novel | c.212A>C | p.Lys71Thr | p.K71T | O95926 | protein_coding | deleterious(0) | possibly_damaging(0.776) | TCGA-AN-A046-01 | Breast | breast invasive carcinoma | Female | >=65 | I/II | Unknown | Unknown | SD |
| SYF2 | insertion | In_Frame_Ins | novel | c.611_612insGGGCCGGAGGTTCTCCTTGGCTTTTTGCTGGAACAGAAGCAG | p.Asp204delinsGluGlyArgArgPheSerLeuAlaPheCysTrpAsnArgSerSer | p.D204delinsEGRRFSLAFCWNRSS | O95926 | protein_coding | TCGA-A2-A0CU-01 | Breast | breast invasive carcinoma | Female | >=65 | I/II | Hormone Therapy | tamoxiphen | SD | ||
| SYF2 | deletion | Frame_Shift_Del | novel | c.509delG | p.Gly170GlufsTer15 | p.G170Efs*15 | O95926 | protein_coding | TCGA-D8-A3Z5-01 | Breast | breast invasive carcinoma | Female | <65 | III/IV | Unknown | Unknown | SD | ||
| SYF2 | deletion | Frame_Shift_Del | novel | c.492delC | p.Asn165IlefsTer20 | p.N165Ifs*20 | O95926 | protein_coding | TCGA-EW-A2FV-01 | Breast | breast invasive carcinoma | Female | <65 | III/IV | Chemotherapy | docetaxel | SD | ||
| SYF2 | SNV | Missense_Mutation | rs749059576 | c.505N>T | p.His169Tyr | p.H169Y | O95926 | protein_coding | tolerated(0.27) | benign(0.003) | TCGA-EK-A2R7-01 | Cervix | cervical & endocervical cancer | Female | <65 | I/II | Unknown | Unknown | SD |
| SYF2 | SNV | Missense_Mutation | novel | c.28N>A | p.Leu10Met | p.L10M | O95926 | protein_coding | tolerated_low_confidence(0.13) | benign(0.027) | TCGA-AA-3947-01 | Colorectum | colon adenocarcinoma | Female | <65 | I/II | Unknown | Unknown | SD |
| SYF2 | SNV | Missense_Mutation | c.675N>A | p.Phe225Leu | p.F225L | O95926 | protein_coding | deleterious(0.01) | possibly_damaging(0.846) | TCGA-AA-A010-01 | Colorectum | colon adenocarcinoma | Female | <65 | I/II | Chemotherapy | folinic | CR | |
| SYF2 | SNV | Missense_Mutation | rs771119272 | c.701A>G | p.Lys234Arg | p.K234R | O95926 | protein_coding | deleterious(0.02) | probably_damaging(0.958) | TCGA-AZ-4315-01 | Colorectum | colon adenocarcinoma | Male | <65 | I/II | Unknown | Unknown | SD |
| SYF2 | SNV | Missense_Mutation | c.288N>T | p.Glu96Asp | p.E96D | O95926 | protein_coding | tolerated(0.64) | benign(0.015) | TCGA-CA-6717-01 | Colorectum | colon adenocarcinoma | Male | <65 | I/II | Chemotherapy | oxaliplatin | CR |
| Page: 1 2 3 |
Top |
Related drugs of malignant transformation related genes |
| Identification of chemicals and drugs interact with genes involved in malignant transfromation |
| (DGIdb 4.0) |
| Entrez ID | Symbol | Category | Interaction Types | Drug Claim Name | Drug Name | PMIDs |
| Page: 1 |

Copyright 2023-Present -The University of Texas Health Science Center at Houston |