Schematic overview of the cellular and molecular mechanisms involved in the cancer progression, including the proposed cellular and molecular mechanisms in cancer cells trajectory. AT1: alveolar type 1 cells; AT2: alveolar type 2 cells; AAH: atypical adenomatous hyperplasia; AIS: adenocarcinoma in situ; MIA: minimally invasive adenocarcinoma; IA: invasive adenocarcinoma; EMT: epithelial-mesenchymal transition

Home

Download

Statistics

Help

Contact

Center for Computational Systems Medicine
leaf

Gene summary

leaf

Malignant transformation analysis

leaf

Malignant transformation related pathway analysis

leaf

Cell-cell communication analysis

leaf

Single-cell gene regulatory network inference analysis

leaf

Somatic mutation of malignant transformation related genes

leaf

Related drugs of malignant transformation related genes

Gene: SMC2

Gene summary for SMC2

check button Gene summary.

Gene informationSpeciesHuman
Gene symbol

SMC2

Gene ID

10592

Gene namestructural maintenance of chromosomes 2
Gene AliasCAP-E
Cytomap9q31.1
Gene Typeprotein-coding
GO ID

GO:0000003

UniProtAcc

A0A024R158


Top

Malignant transformation analysis

check button Identification of the aberrant gene expression in precancerous and cancerous lesions by comparing the gene expression of stem-like cells in diseased tissues with normal stem cells
check button Malignant transformation involving gene list.
Entrez IDSymbolReplicatesSpeciesOrganTissueAdj P-valueLog2FCMalignancy
10592SMC2LZE2THumanEsophagusESCC5.52e-101.08e+000.082
10592SMC2LZE4THumanEsophagusESCC1.33e-043.30e-010.0811
10592SMC2LZE24THumanEsophagusESCC4.91e-103.09e-010.0596
10592SMC2LZE6THumanEsophagusESCC6.29e-053.68e-010.0845
10592SMC2P1T-EHumanEsophagusESCC3.33e-054.00e-010.0875
10592SMC2P2T-EHumanEsophagusESCC2.87e-411.03e+000.1177
10592SMC2P4T-EHumanEsophagusESCC3.39e-256.58e-010.1323
10592SMC2P5T-EHumanEsophagusESCC8.18e-287.01e-010.1327
10592SMC2P8T-EHumanEsophagusESCC6.56e-153.50e-010.0889
10592SMC2P9T-EHumanEsophagusESCC5.52e-083.29e-010.1131
10592SMC2P10T-EHumanEsophagusESCC1.04e-399.10e-010.116
10592SMC2P11T-EHumanEsophagusESCC8.02e-032.08e-010.1426
10592SMC2P12T-EHumanEsophagusESCC2.03e-092.29e-010.1122
10592SMC2P15T-EHumanEsophagusESCC3.18e-103.71e-010.1149
10592SMC2P16T-EHumanEsophagusESCC1.25e-194.17e-010.1153
10592SMC2P17T-EHumanEsophagusESCC2.19e-114.94e-010.1278
10592SMC2P19T-EHumanEsophagusESCC8.01e-034.20e-010.1662
10592SMC2P20T-EHumanEsophagusESCC2.23e-122.29e-010.1124
10592SMC2P21T-EHumanEsophagusESCC3.38e-378.47e-010.1617
10592SMC2P22T-EHumanEsophagusESCC2.22e-082.30e-010.1236
Page: 1 2 3 4 5 6 

check button Transcriptomic changes along malignancy continuum.
TissueExpression DynamicsAbbreviation
EsophagusThe image shows the transcriptomic changes along malignancy continuum.log2FC in expression of this searched gene in stem-like cells from each diseased tissue sample relative to stem-like cells in normal samples in each tissue plotted against the malignancy continuum. Samples are colored based on if they are from different disease stage.
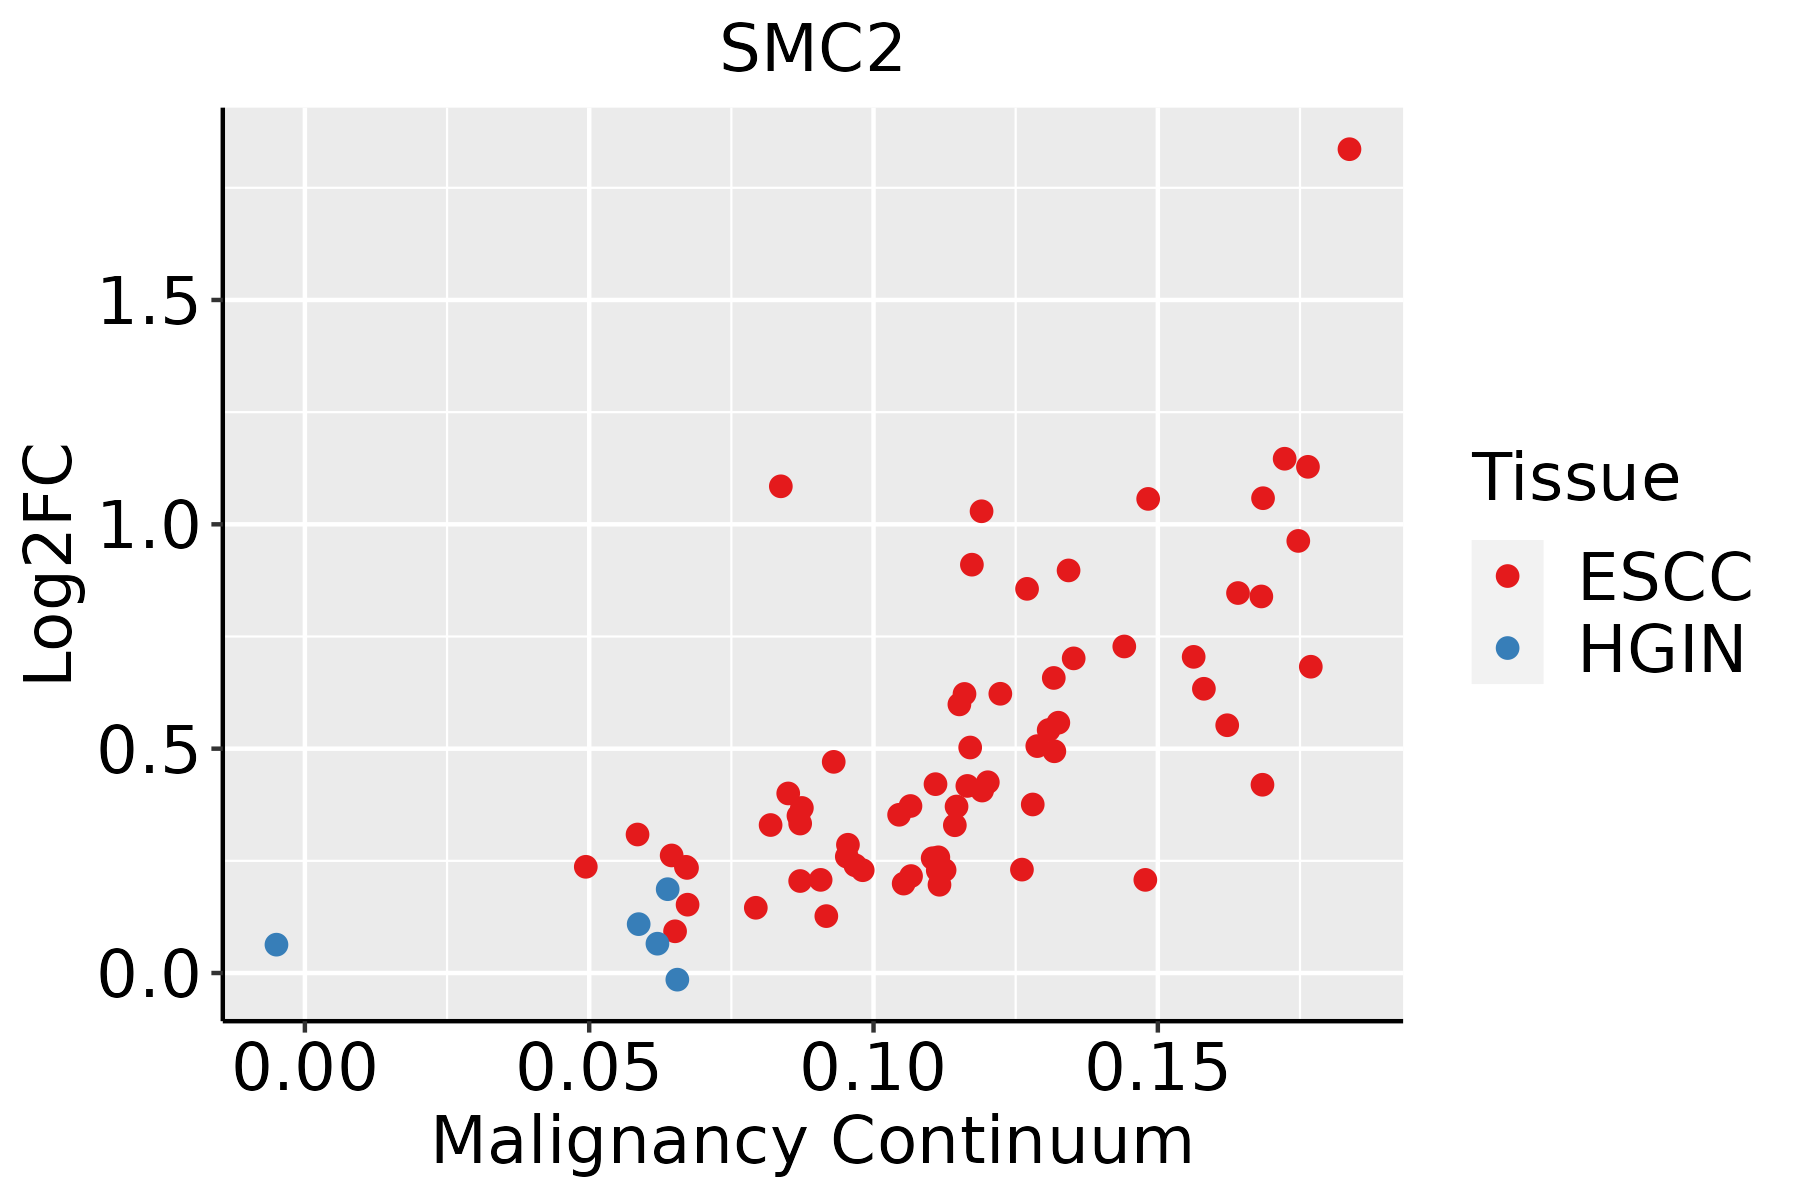
ESCC: Esophageal squamous cell carcinoma
HGIN: High-grade intraepithelial neoplasias
LGIN: Low-grade intraepithelial neoplasias
LiverThe image shows the transcriptomic changes along malignancy continuum.log2FC in expression of this searched gene in stem-like cells from each diseased tissue sample relative to stem-like cells in normal samples in each tissue plotted against the malignancy continuum. Samples are colored based on if they are from different disease stage.
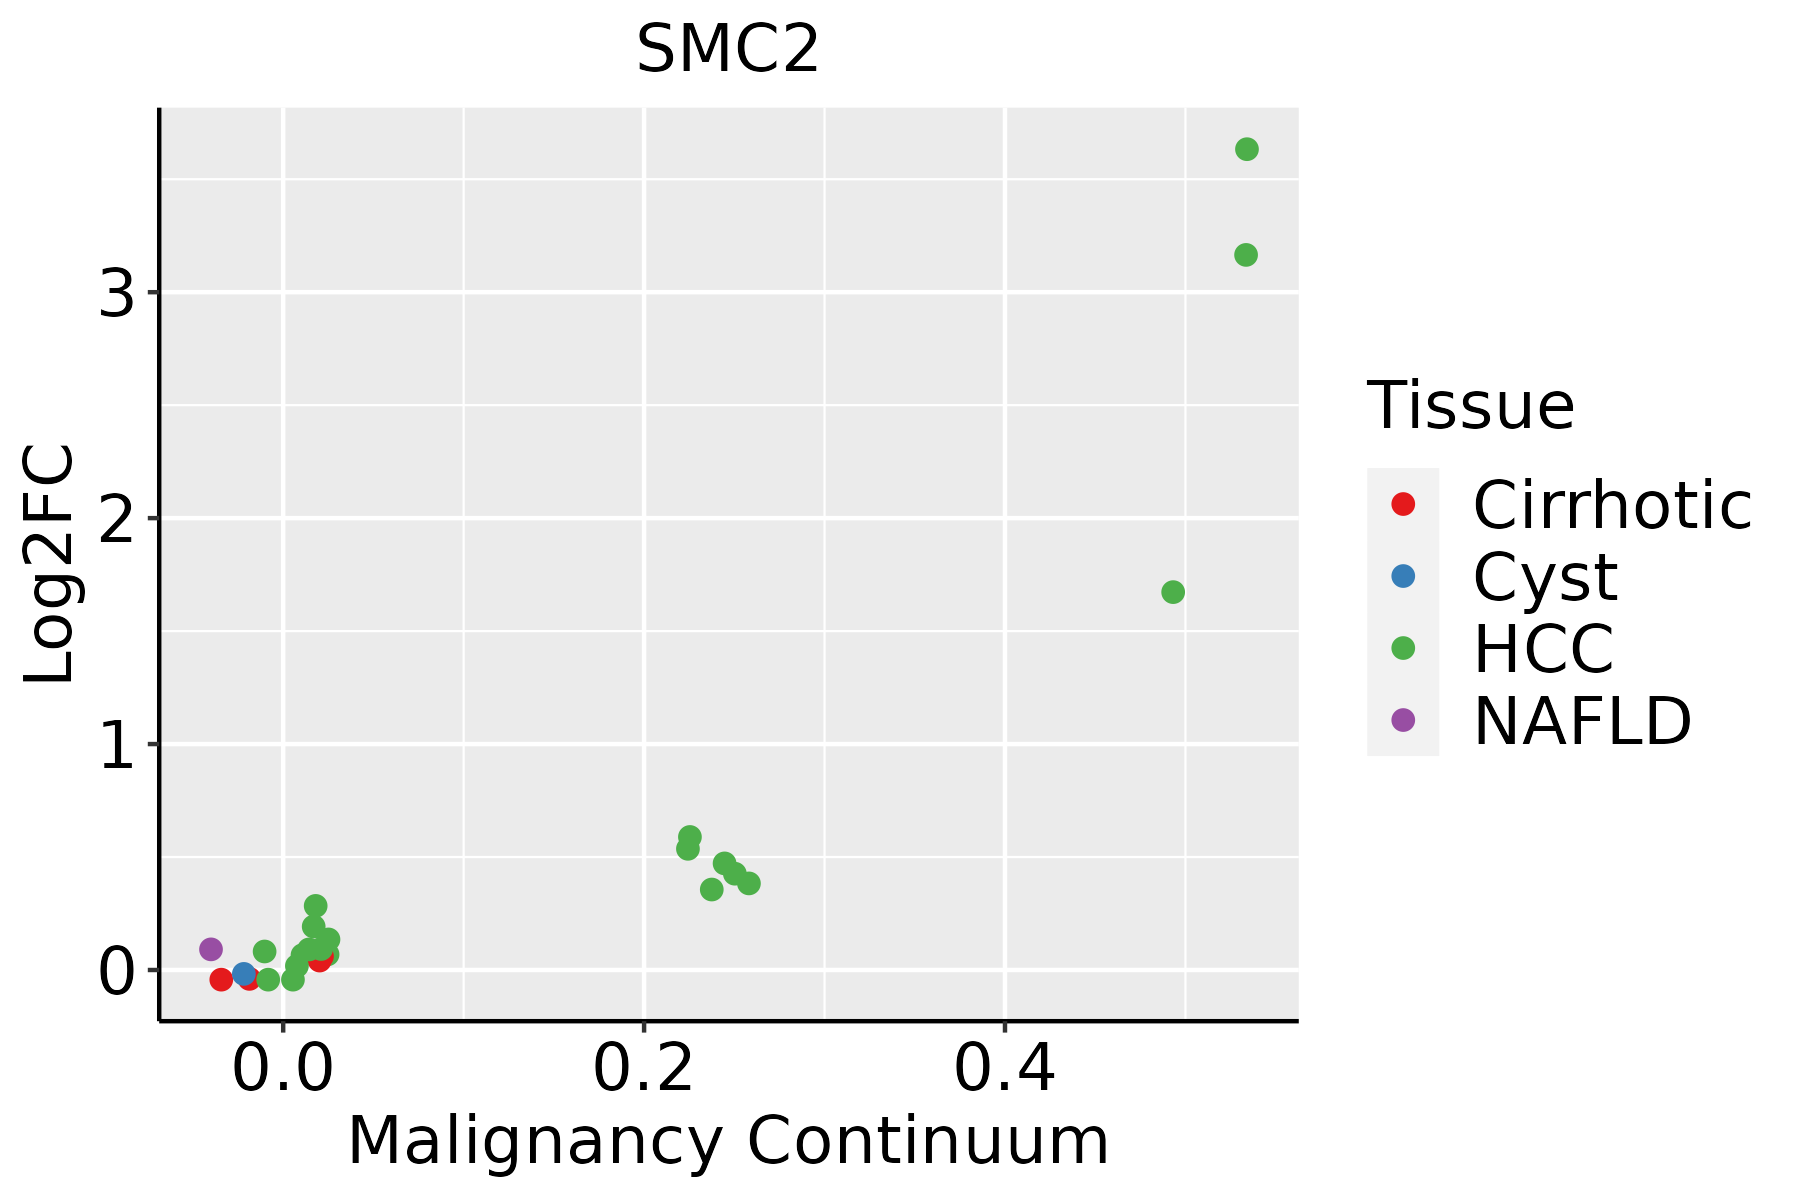
HCC: Hepatocellular carcinoma
NAFLD: Non-alcoholic fatty liver disease
Oral CavityThe image shows the transcriptomic changes along malignancy continuum.log2FC in expression of this searched gene in stem-like cells from each diseased tissue sample relative to stem-like cells in normal samples in each tissue plotted against the malignancy continuum. Samples are colored based on if they are from different disease stage.
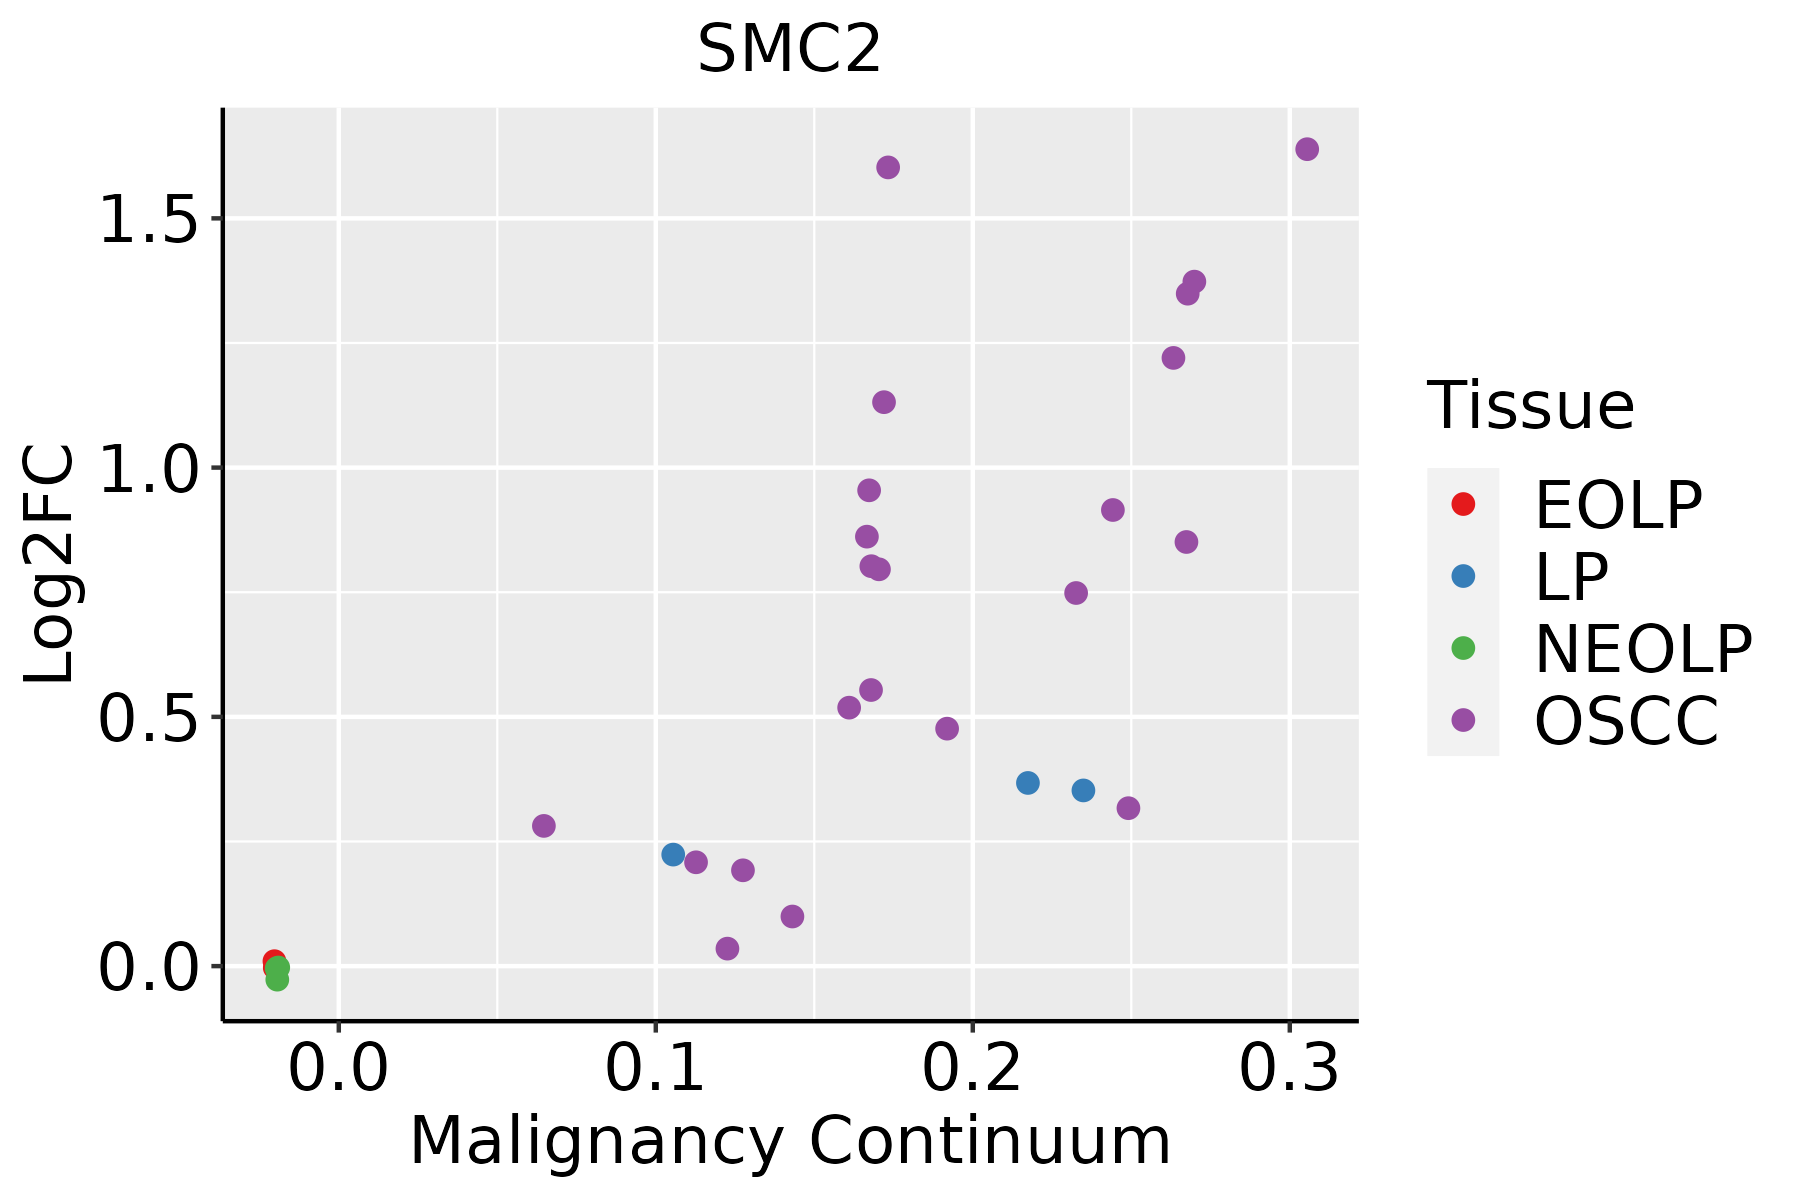
EOLP: Erosive Oral lichen planus
LP: leukoplakia
NEOLP: Non-erosive oral lichen planus
OSCC: Oral squamous cell carcinoma
SkinThe image shows the transcriptomic changes along malignancy continuum.log2FC in expression of this searched gene in stem-like cells from each diseased tissue sample relative to stem-like cells in normal samples in each tissue plotted against the malignancy continuum. Samples are colored based on if they are from different disease stage.
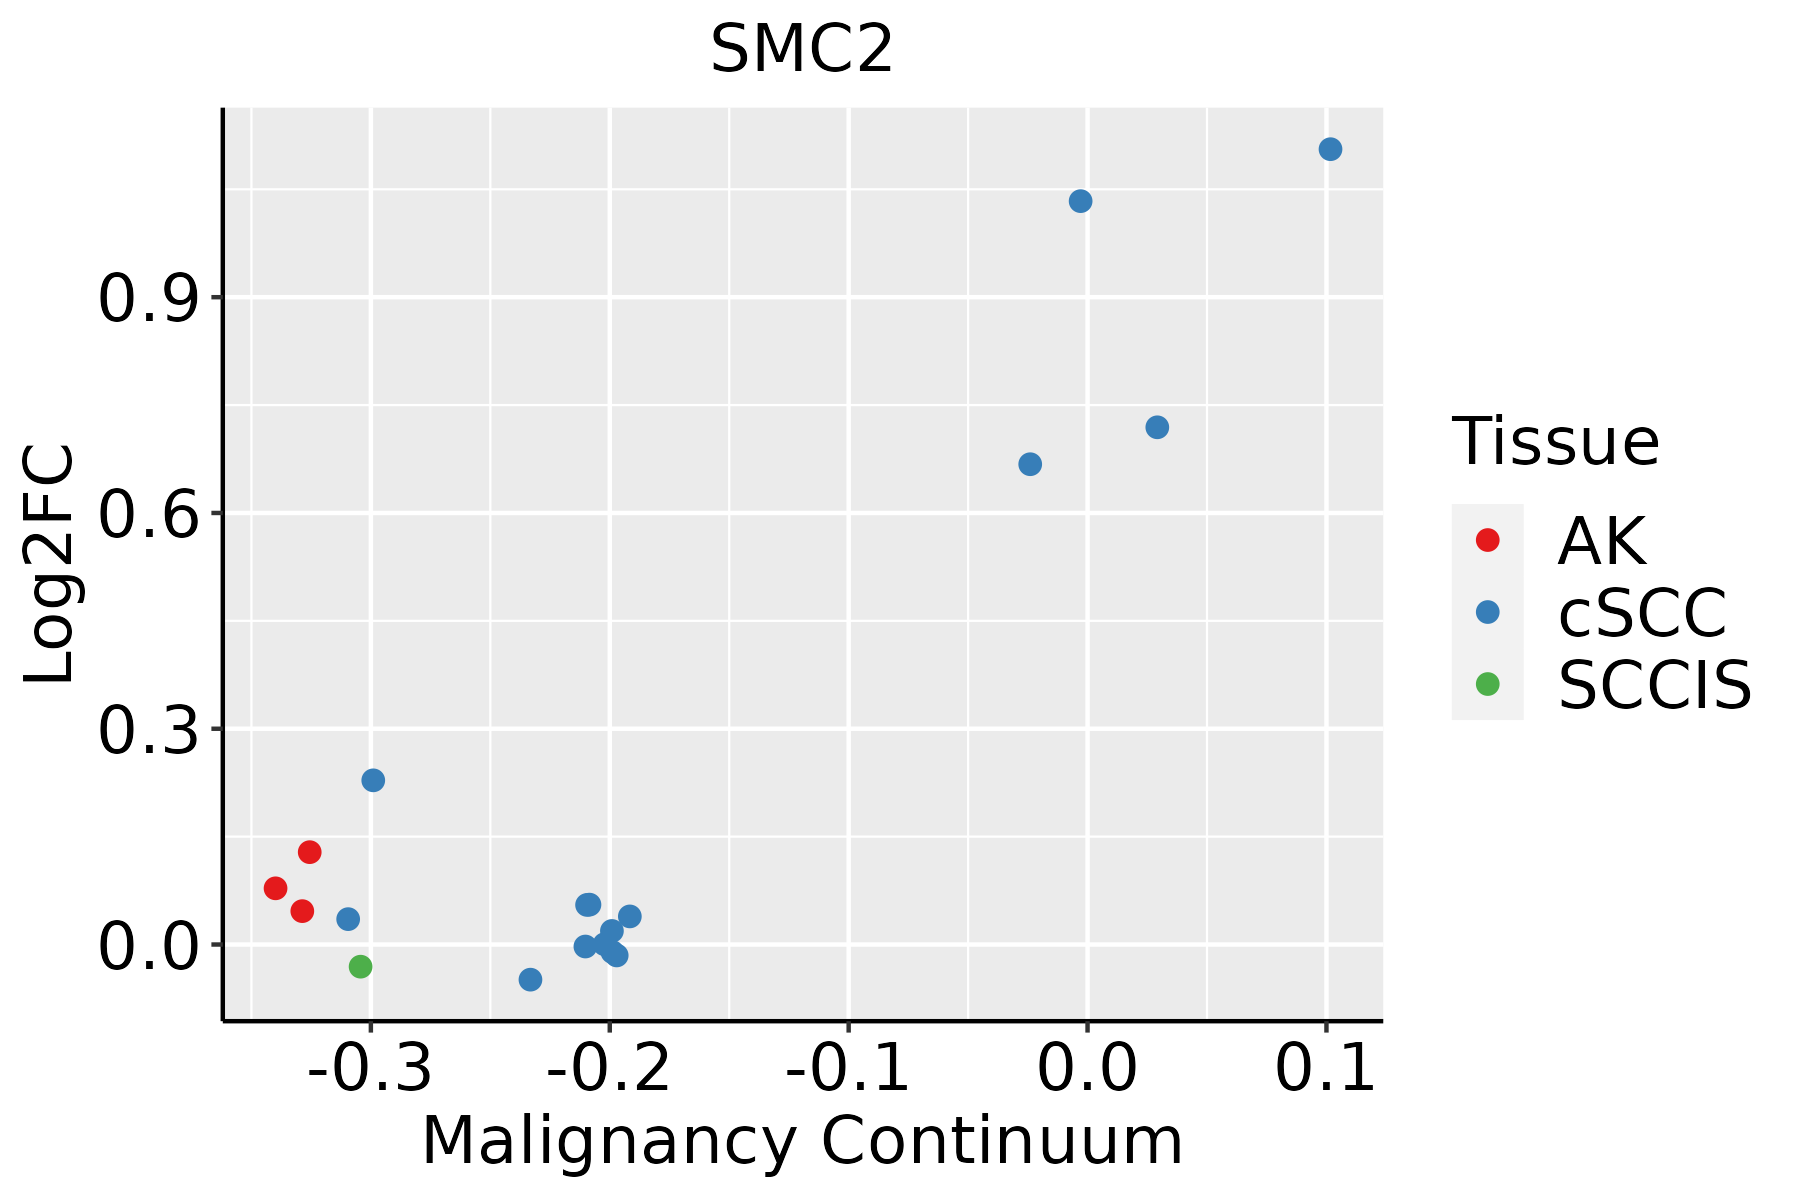
AK: Actinic keratosis
cSCC: Cutaneous squamous cell carcinoma
SCCIS:squamous cell carcinoma in situ
ThyroidThe image shows the transcriptomic changes along malignancy continuum.log2FC in expression of this searched gene in stem-like cells from each diseased tissue sample relative to stem-like cells in normal samples in each tissue plotted against the malignancy continuum. Samples are colored based on if they are from different disease stage.ATC: Anaplastic thyroid cancer
HT: Hashimoto's thyroiditis
PTC: Papillary thyroid cancer
∗log2FC in expression of this searched gene in stem-like cells from each diseased tissue sample relative to stem-like cells in normal samples in each tissue plotted against the malignancy continuum. Samples are colored based on if they are from different disease stage.

Top

Malignant transformation related pathway analysis

check buttonFind out the enriched GO biological processes and KEGG pathways involved in transition from healthy to precancer to cancer
check button Figure of enriched GO biological processes.
TissueDisease StageEnriched GO biological Processes
ColorectumADGO analysis - Figure of enriched GO biological processes: Top 15 enriched GO BP terms are showed in the bar plot of each disease state in each tissue. Each row represents a significant GO biological process which is colored according to the -log10(p.adjust).
ColorectumSERGO analysis - Figure of enriched GO biological processes: Top 15 enriched GO BP terms are showed in the bar plot of each disease state in each tissue. Each row represents a significant GO biological process which is colored according to the -log10(p.adjust).
ColorectumMSSGO analysis - Figure of enriched GO biological processes: Top 15 enriched GO BP terms are showed in the bar plot of each disease state in each tissue. Each row represents a significant GO biological process which is colored according to the -log10(p.adjust).
ColorectumMSI-HGO analysis - Figure of enriched GO biological processes: Top 15 enriched GO BP terms are showed in the bar plot of each disease state in each tissue. Each row represents a significant GO biological process which is colored according to the -log10(p.adjust).
ColorectumFAPGO analysis - Figure of enriched GO biological processes: Top 15 enriched GO BP terms are showed in the bar plot of each disease state in each tissue. Each row represents a significant GO biological process which is colored according to the -log10(p.adjust).
∗Top 15 enriched GO BP terms are showed in the bar plot of each disease state in each tissue. Each row represents a significant GO biological process which is colored according to the -log10(p.adjust).
Page: 1 2 3 4 5 6 7 8 9 

check button Enriched GO biological processes.
GO IDTissueDisease StageDescriptionGene RatioBg Ratiopvaluep.adjustCount
GO:0045732110Oral cavityLPpositive regulation of protein catabolic process103/4623231/187232.68e-111.81e-09103
GO:0031331110Oral cavityLPpositive regulation of cellular catabolic process163/4623427/187233.03e-101.59e-08163
GO:1903364110Oral cavityLPpositive regulation of cellular protein catabolic process72/4623155/187232.93e-091.28e-0772
GO:190180019Oral cavityLPpositive regulation of proteasomal protein catabolic process57/4623114/187234.56e-091.91e-0757
GO:190305218Oral cavityLPpositive regulation of proteolysis involved in cellular protein catabolic process61/4623133/187238.17e-082.72e-0661
GO:000150315Oral cavityLPossification123/4623408/187236.55e-033.84e-02123
GO:000164916Oral cavityLPosteoblast differentiation73/4623229/187238.09e-034.40e-0273
GO:001049828SkincSCCproteasomal protein catabolic process243/4864490/187237.85e-304.10e-27243
GO:004217629SkincSCCregulation of protein catabolic process198/4864391/187236.03e-261.89e-23198
GO:004316128SkincSCCproteasome-mediated ubiquitin-dependent protein catabolic process205/4864412/187231.46e-254.16e-23205
GO:190336229SkincSCCregulation of cellular protein catabolic process139/4864255/187232.06e-224.17e-20139
GO:014001415SkincSCCmitotic nuclear division149/4864287/187233.59e-216.43e-19149
GO:190305029SkincSCCregulation of proteolysis involved in cellular protein catabolic process121/4864221/187236.75e-201.01e-17121
GO:006113629SkincSCCregulation of proteasomal protein catabolic process106/4864187/187234.31e-195.87e-17106
GO:000081912SkincSCCsister chromatid segregation110/4864202/187235.56e-186.58e-16110
GO:000007012SkincSCCmitotic sister chromatid segregation96/4864168/187239.55e-181.05e-1596
GO:000705912SkincSCCchromosome segregation161/4864346/187238.34e-178.57e-15161
GO:004586229SkincSCCpositive regulation of proteolysis169/4864372/187232.43e-162.21e-14169
GO:000989628SkincSCCpositive regulation of catabolic process206/4864492/187236.06e-154.64e-13206
GO:190336429SkincSCCpositive regulation of cellular protein catabolic process85/4864155/187231.87e-141.31e-1285
Page: 1 2 3 4 5 6 7 8 9 10 11 12 13 

check button Enriched KEGG pathways.
Pathway IDTissueDisease StageDescriptionGene RatioBg Ratiopvaluep.adjustqvalueCount
Page: 1 

Top

Cell-cell communication analysis

check buttonIdentification of potential cell-cell interactions between two cell types and their ligand-receptor pairs for different disease states
LigandReceptorLRpairPathwayTissueDisease Stage
Page: 1 

Top

Single-cell gene regulatory network inference analysis

check buttonFind out the significant the regulons (TFs) and the target genes of each regulon across cell types for different disease states
TFCell TypeTissueDisease StageTarget GeneRSSRegulon Activity
∗The dot plots of a searched regulon are shown for all cell subpopulations in each disease state of each tissue based on the regulon specific score inferred using pySCENIC and by calculating the average expression.
Page: 1 

Top

Somatic mutation of malignant transformation related genes

check buttonAnnotation of somatic variants for genes involved in malignant transformation
Hugo SymbolVariant ClassVariant ClassificationdbSNP RSHGVScHGVSpHGVSp ShortSWISSPROTBIOTYPESIFTPolyPhenTumor Sample BarcodeTissueHistologySexAgeStageTherapy TypesDrugsOutcome
SMC2SNVMissense_Mutationnovelc.1472N>Cp.Arg491Thrp.R491TO95347protein_codingtolerated(0.56)benign(0.01)TCGA-5L-AAT1-01Breastbreast invasive carcinomaFemale<65III/IVHormone TherapyletrozolSD
SMC2SNVMissense_Mutationrs776131090c.2308N>Ap.Glu770Lysp.E770KO95347protein_codingtolerated(0.36)benign(0.101)TCGA-A8-A075-01Breastbreast invasive carcinomaFemale<65I/IIChemotherapyepirubicinCR
SMC2SNVMissense_Mutationc.2269N>Cp.Glu757Glnp.E757QO95347protein_codingtolerated(0.29)benign(0.088)TCGA-AC-A23H-01Breastbreast invasive carcinomaFemale>=65I/IIUnknownUnknownPD
SMC2SNVMissense_Mutationnovelc.2271N>Tp.Glu757Aspp.E757DO95347protein_codingtolerated(0.07)benign(0.049)TCGA-AN-A046-01Breastbreast invasive carcinomaFemale>=65I/IIUnknownUnknownSD
SMC2SNVMissense_Mutationnovelc.3260G>Ap.Gly1087Aspp.G1087DO95347protein_codingdeleterious(0)probably_damaging(1)TCGA-AN-A0AK-01Breastbreast invasive carcinomaFemale>=65I/IIUnknownUnknownSD
SMC2SNVMissense_Mutationnovelc.2713N>Ap.Asp905Asnp.D905NO95347protein_codingdeleterious(0.02)benign(0.012)TCGA-BH-A0B6-01Breastbreast invasive carcinomaFemale<65I/IIUnknownUnknownSD
SMC2SNVMissense_Mutationnovelc.2899N>Gp.Gln967Glup.Q967EO95347protein_codingtolerated(0.08)benign(0.007)TCGA-PE-A5DD-01Breastbreast invasive carcinomaFemale<65I/IIChemotherapyCR
SMC2SNVMissense_Mutationc.1367N>Ap.Arg456Lysp.R456KO95347protein_codingtolerated(1)benign(0)TCGA-C5-A1MK-01Cervixcervical & endocervical cancerFemale>=65III/IVChemotherapycarboplatinPD
SMC2SNVMissense_Mutationc.1831N>Ap.Glu611Lysp.E611KO95347protein_codingtolerated(0.43)benign(0.061)TCGA-HM-A4S6-01Cervixcervical & endocervical cancerFemale<65III/IVChemotherapycisplatinCR
SMC2SNVMissense_Mutationc.2521G>Ap.Glu841Lysp.E841KO95347protein_codingtolerated(0.84)benign(0.005)TCGA-MA-AA3Y-01Cervixcervical & endocervical cancerFemale<65I/IIUnknownUnknownSD
Page: 1 2 3 4 5 6 7 8 9 10 11 12 13 14 15 

Top

Related drugs of malignant transformation related genes

check buttonIdentification of chemicals and drugs interact with genes involved in malignant transfromation
(DGIdb 4.0)
Entrez IDSymbolCategoryInteraction TypesDrug Claim NameDrug NamePMIDs
Page: 1