
|
|||||
|
 | |
| |
| |
| |
| |
| |
|
Gene: PUF60 |
Gene summary for PUF60 |
| Gene information | Species | Human | Gene symbol | PUF60 | Gene ID | 22827 |
| Gene name | poly(U) binding splicing factor 60 | |
| Gene Alias | FIR | |
| Cytomap | 8q24.3 | |
| Gene Type | protein-coding | GO ID | GO:0000245 | UniProtAcc | Q9UHX1 |
Top |
Malignant transformation analysis |
| Identification of the aberrant gene expression in precancerous and cancerous lesions by comparing the gene expression of stem-like cells in diseased tissues with normal stem cells |
| Entrez ID | Symbol | Replicates | Species | Organ | Tissue | Adj P-value | Log2FC | Malignancy |
| 22827 | PUF60 | GSM4909285 | Human | Breast | IDC | 1.02e-23 | 5.23e-01 | 0.21 |
| 22827 | PUF60 | GSM4909287 | Human | Breast | IDC | 2.43e-02 | 2.82e-01 | 0.2057 |
| 22827 | PUF60 | GSM4909294 | Human | Breast | IDC | 1.19e-03 | 2.90e-01 | 0.2022 |
| 22827 | PUF60 | GSM4909296 | Human | Breast | IDC | 4.24e-07 | -1.04e-01 | 0.1524 |
| 22827 | PUF60 | GSM4909297 | Human | Breast | IDC | 9.15e-08 | -2.81e-02 | 0.1517 |
| 22827 | PUF60 | GSM4909304 | Human | Breast | IDC | 2.92e-04 | 3.12e-01 | 0.1636 |
| 22827 | PUF60 | GSM4909305 | Human | Breast | IDC | 6.82e-03 | 3.05e-01 | 0.0436 |
| 22827 | PUF60 | GSM4909306 | Human | Breast | IDC | 1.06e-05 | 3.45e-01 | 0.1564 |
| 22827 | PUF60 | GSM4909309 | Human | Breast | IDC | 2.53e-02 | 2.00e-01 | 0.0483 |
| 22827 | PUF60 | GSM4909311 | Human | Breast | IDC | 6.78e-24 | 7.52e-02 | 0.1534 |
| 22827 | PUF60 | GSM4909312 | Human | Breast | IDC | 7.60e-17 | 2.78e-01 | 0.1552 |
| 22827 | PUF60 | GSM4909317 | Human | Breast | IDC | 2.14e-25 | 6.47e-01 | 0.1355 |
| 22827 | PUF60 | GSM4909318 | Human | Breast | IDC | 1.22e-08 | 6.72e-01 | 0.2031 |
| 22827 | PUF60 | GSM4909319 | Human | Breast | IDC | 1.02e-34 | 1.55e-01 | 0.1563 |
| 22827 | PUF60 | GSM4909321 | Human | Breast | IDC | 4.49e-11 | 1.95e-02 | 0.1559 |
| 22827 | PUF60 | brca1 | Human | Breast | Precancer | 3.71e-08 | 3.90e-01 | -0.0338 |
| 22827 | PUF60 | brca2 | Human | Breast | Precancer | 5.41e-13 | 3.65e-01 | -0.024 |
| 22827 | PUF60 | brca3 | Human | Breast | Precancer | 2.54e-02 | 2.98e-01 | -0.0263 |
| 22827 | PUF60 | NCCBC14 | Human | Breast | DCIS | 7.18e-04 | 1.12e-01 | 0.2021 |
| 22827 | PUF60 | NCCBC5 | Human | Breast | DCIS | 2.84e-04 | 1.04e-01 | 0.2046 |
| Page: 1 2 3 4 5 6 7 8 9 10 |
| Tissue | Expression Dynamics | Abbreviation |
| Breast | 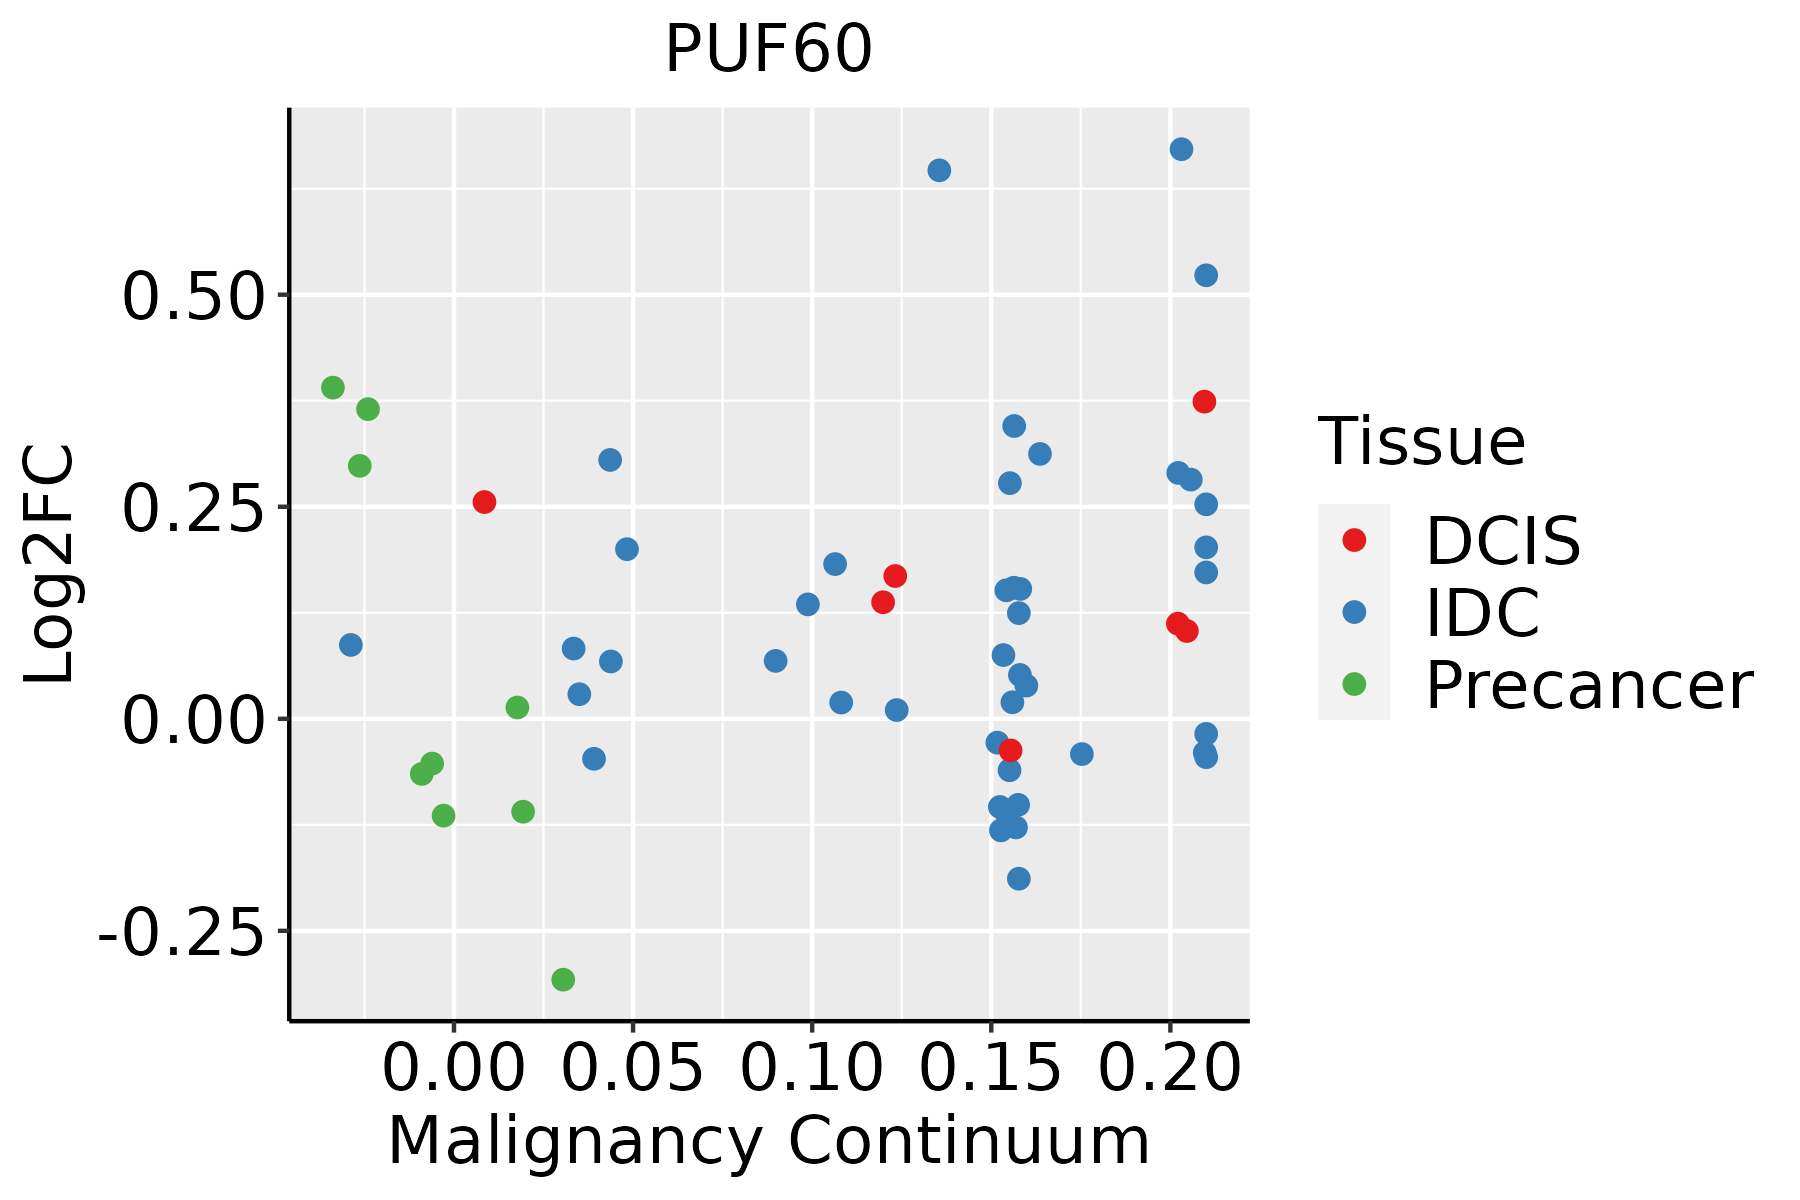 | IDC: Invasive ductal carcinoma |
| DCIS: Ductal carcinoma in situ | ||
| Precancer(BRCA1-mut): Precancerous lesion from BRCA1 mutation carriers | ||
| Colorectum (GSE201348) | 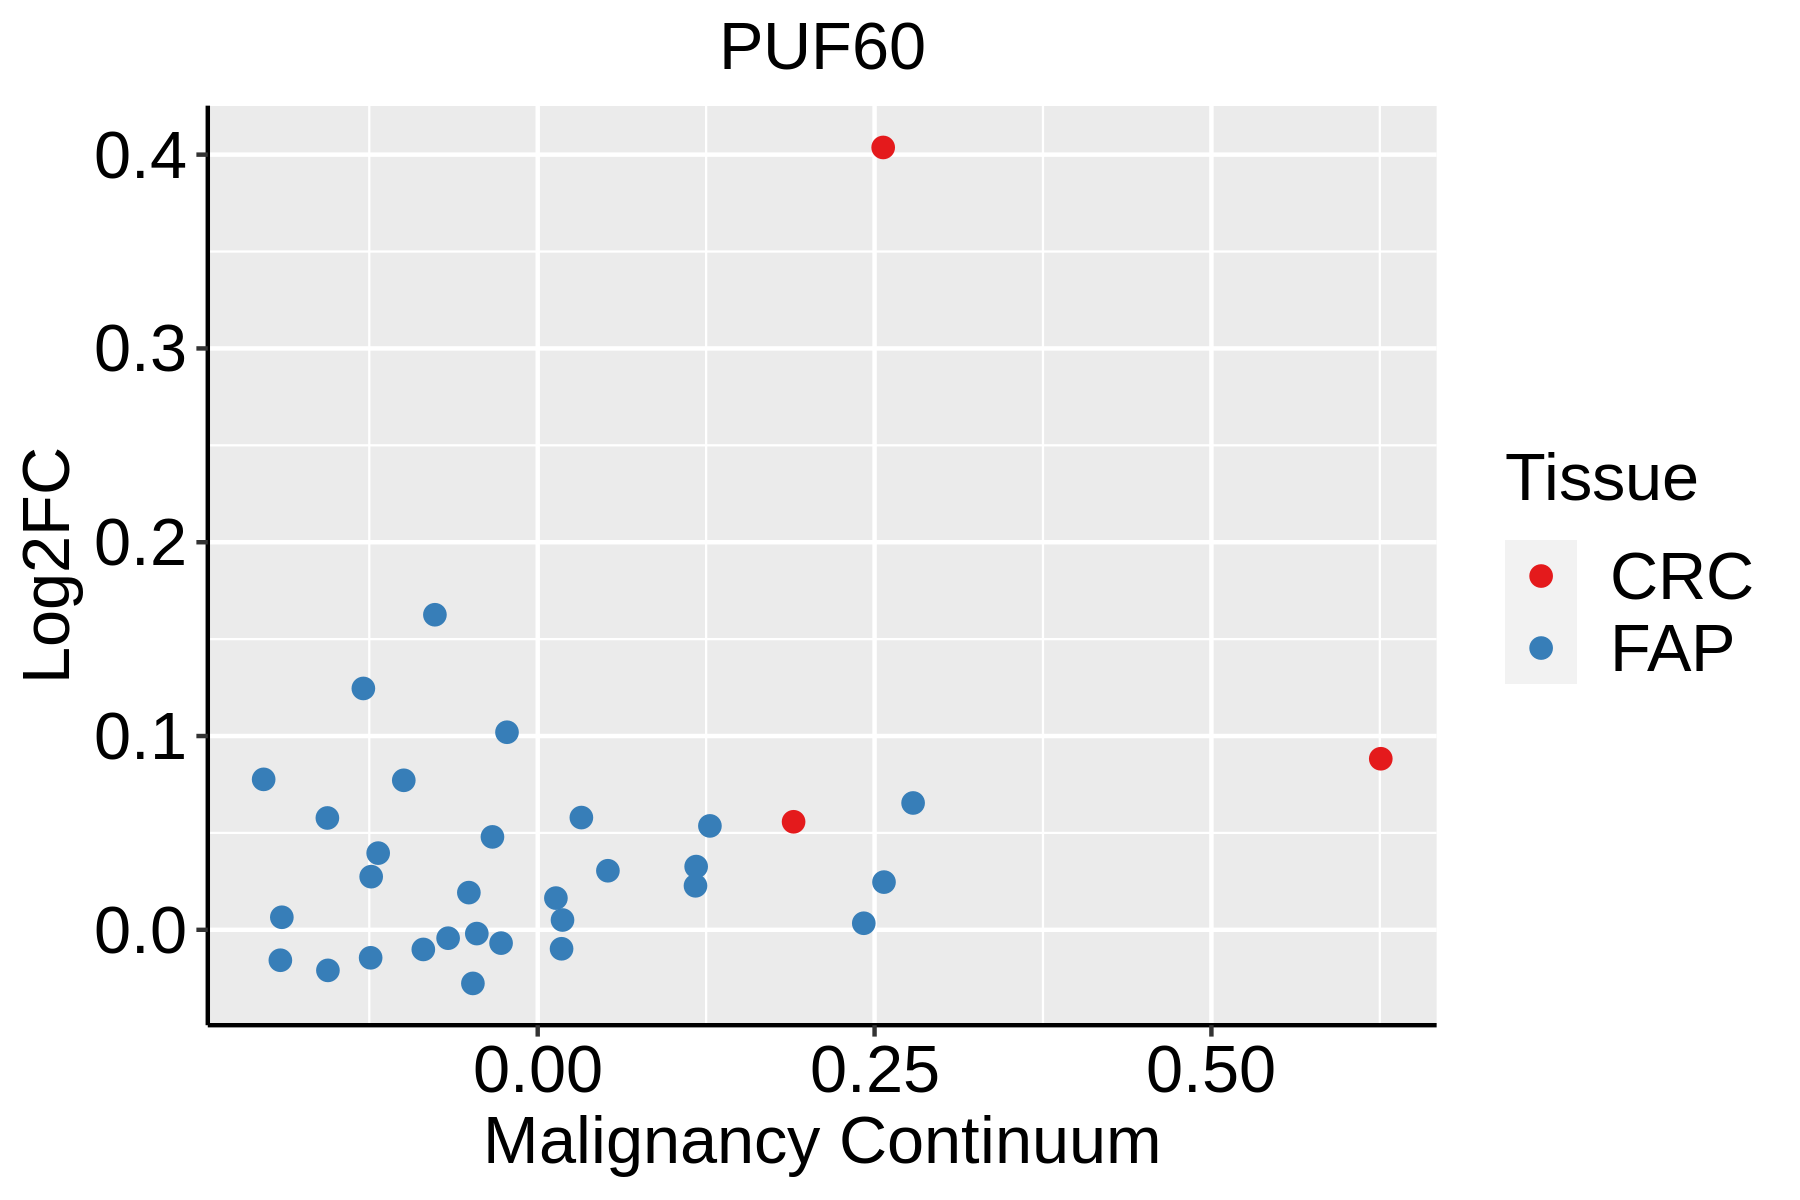 | FAP: Familial adenomatous polyposis |
| CRC: Colorectal cancer | ||
| Colorectum (HTA11) |  | AD: Adenomas |
| SER: Sessile serrated lesions | ||
| MSI-H: Microsatellite-high colorectal cancer | ||
| MSS: Microsatellite stable colorectal cancer | ||
| Esophagus | 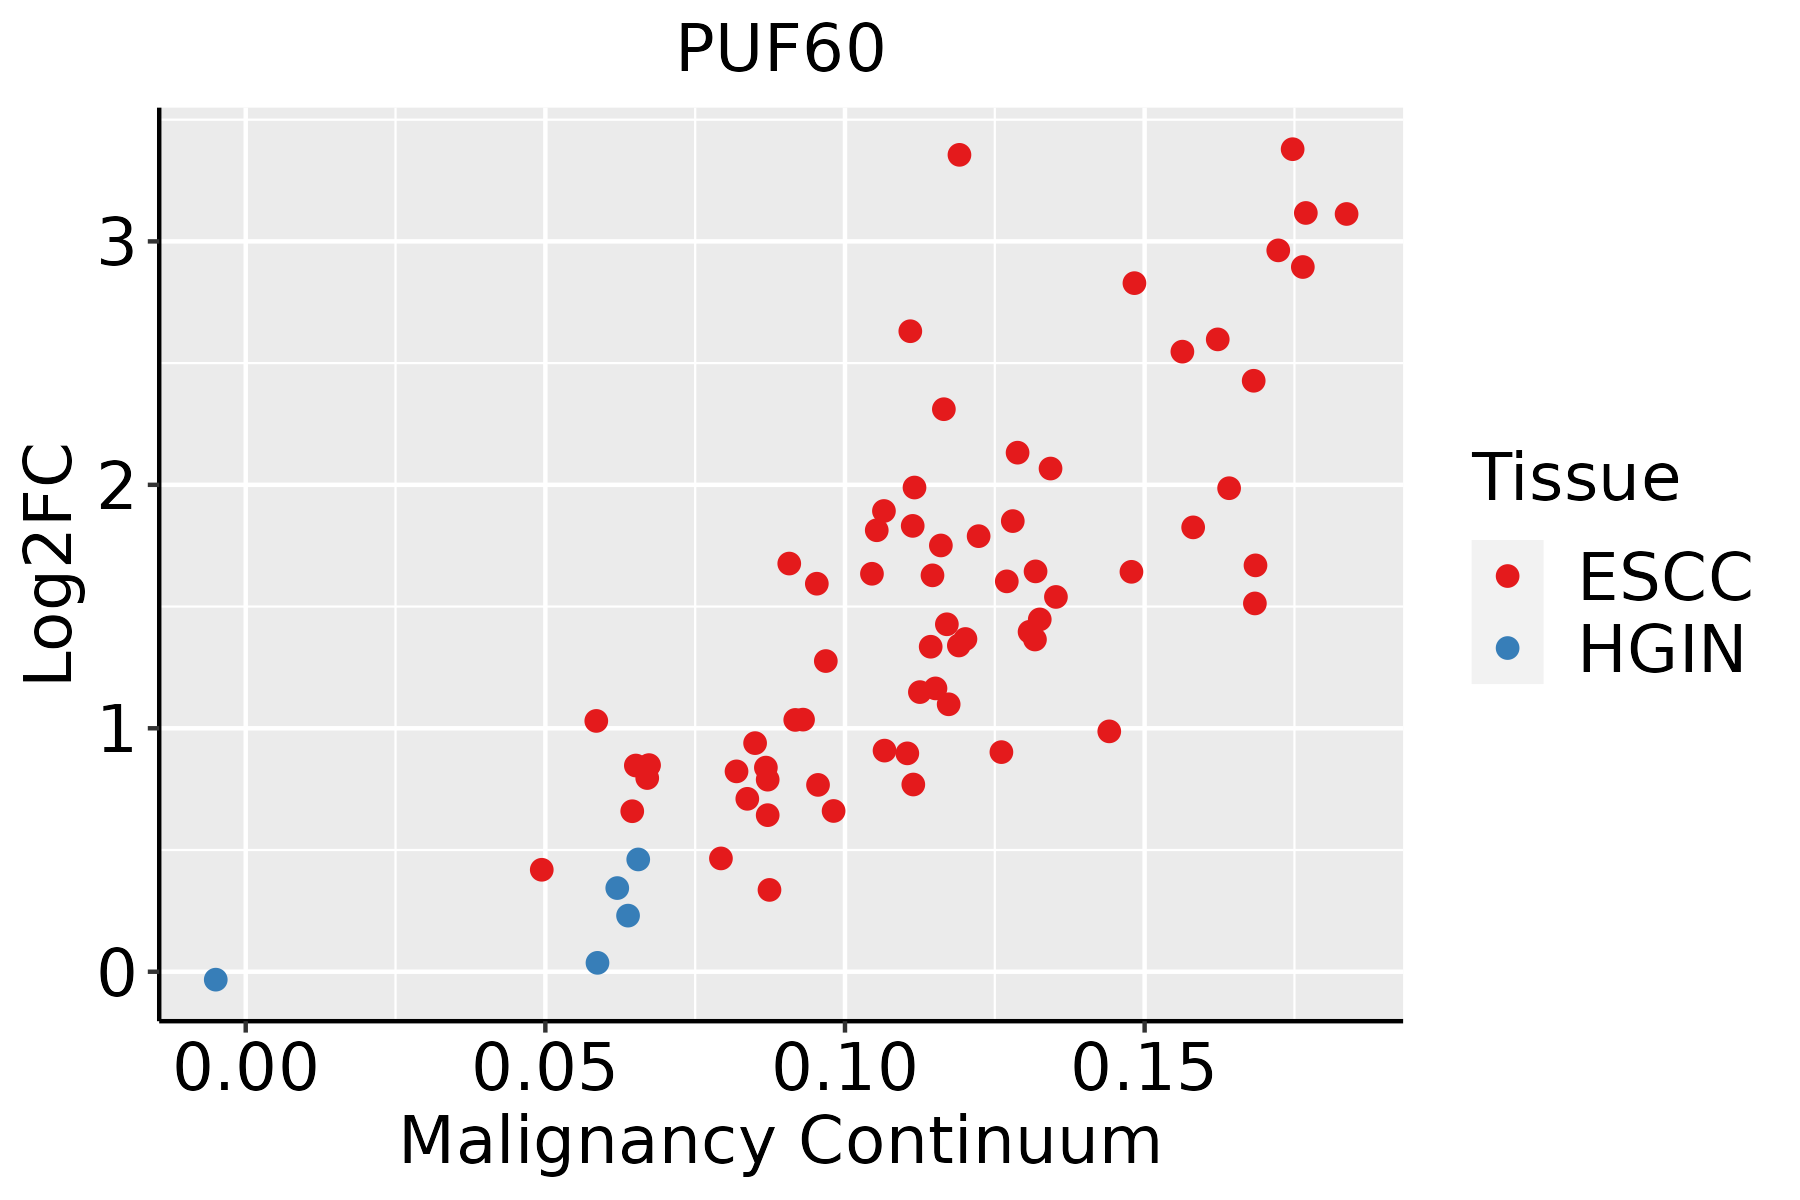 | ESCC: Esophageal squamous cell carcinoma |
| HGIN: High-grade intraepithelial neoplasias | ||
| LGIN: Low-grade intraepithelial neoplasias | ||
| Liver |  | HCC: Hepatocellular carcinoma |
| NAFLD: Non-alcoholic fatty liver disease | ||
| Oral Cavity | 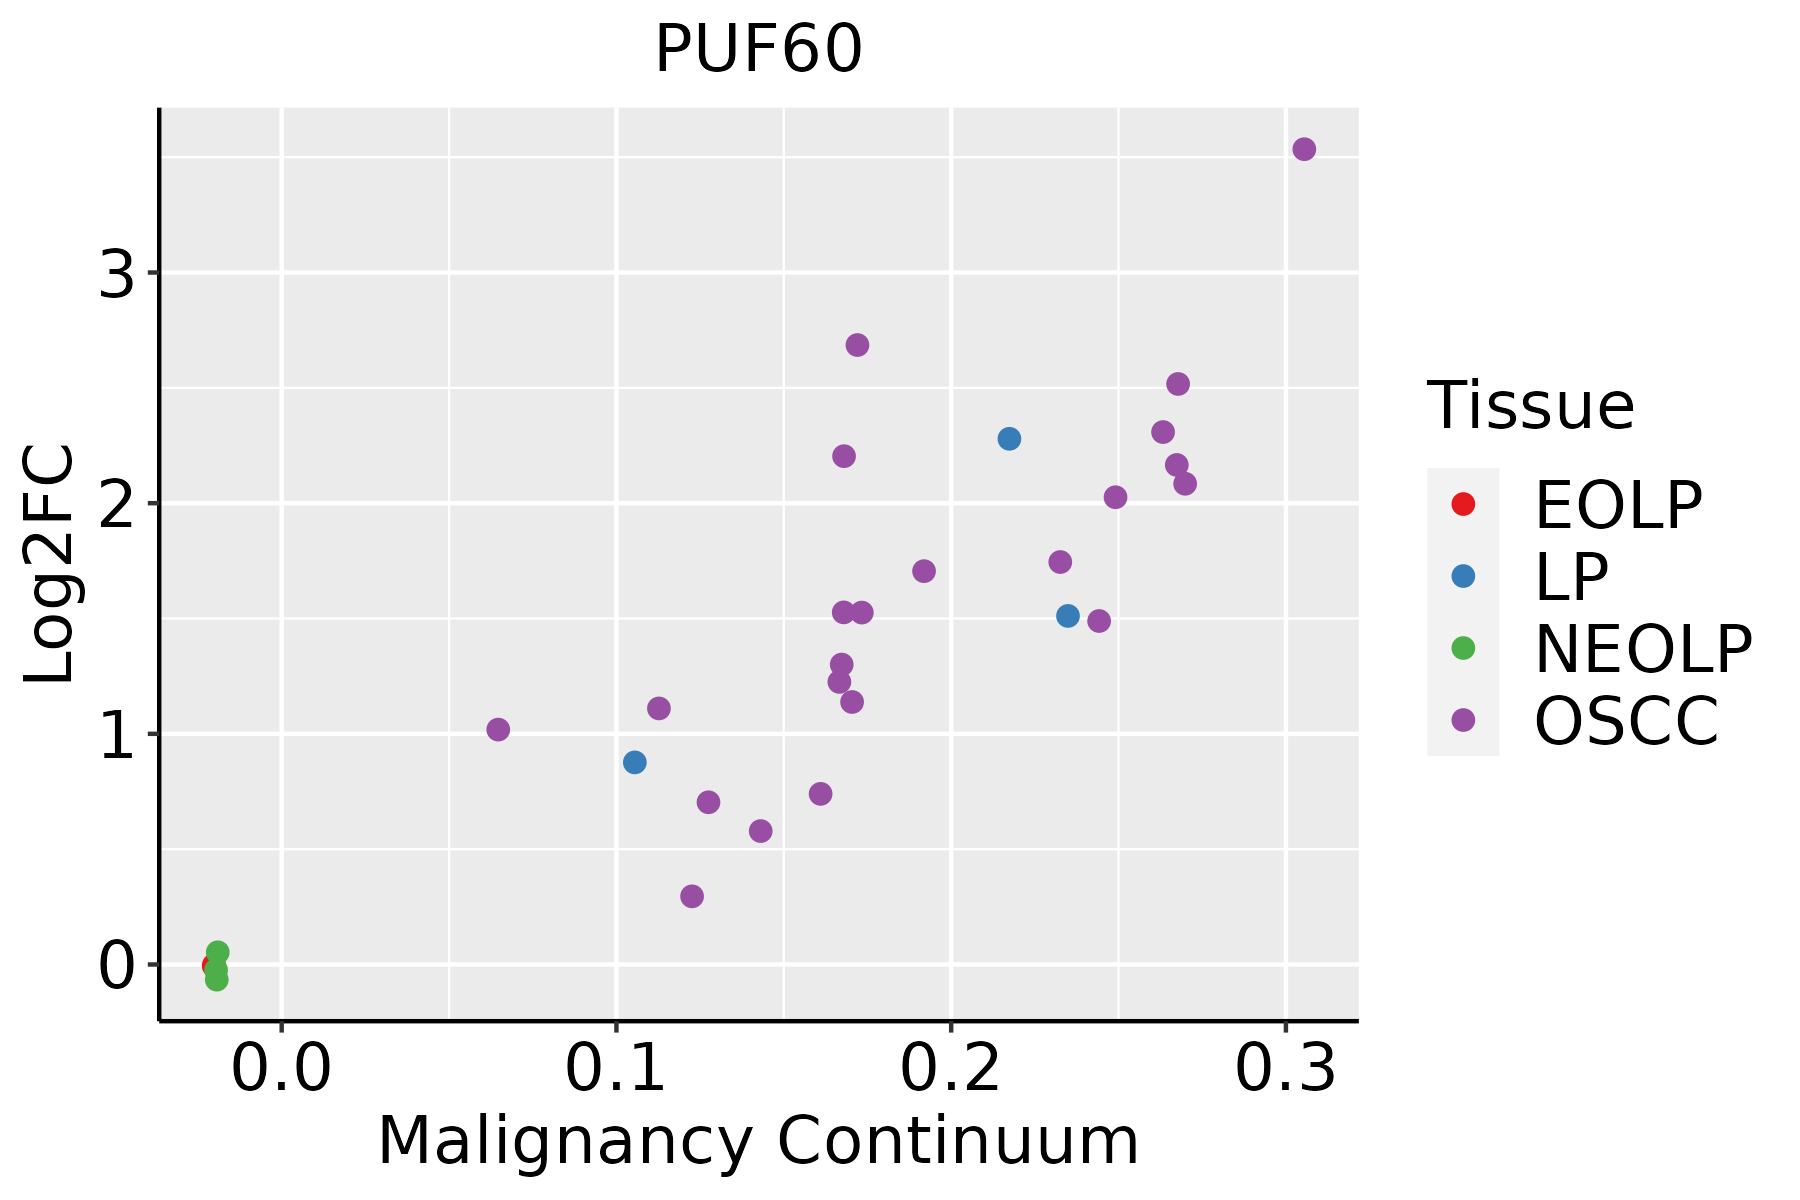 | EOLP: Erosive Oral lichen planus |
| LP: leukoplakia | ||
| NEOLP: Non-erosive oral lichen planus | ||
| OSCC: Oral squamous cell carcinoma | ||
| Skin | 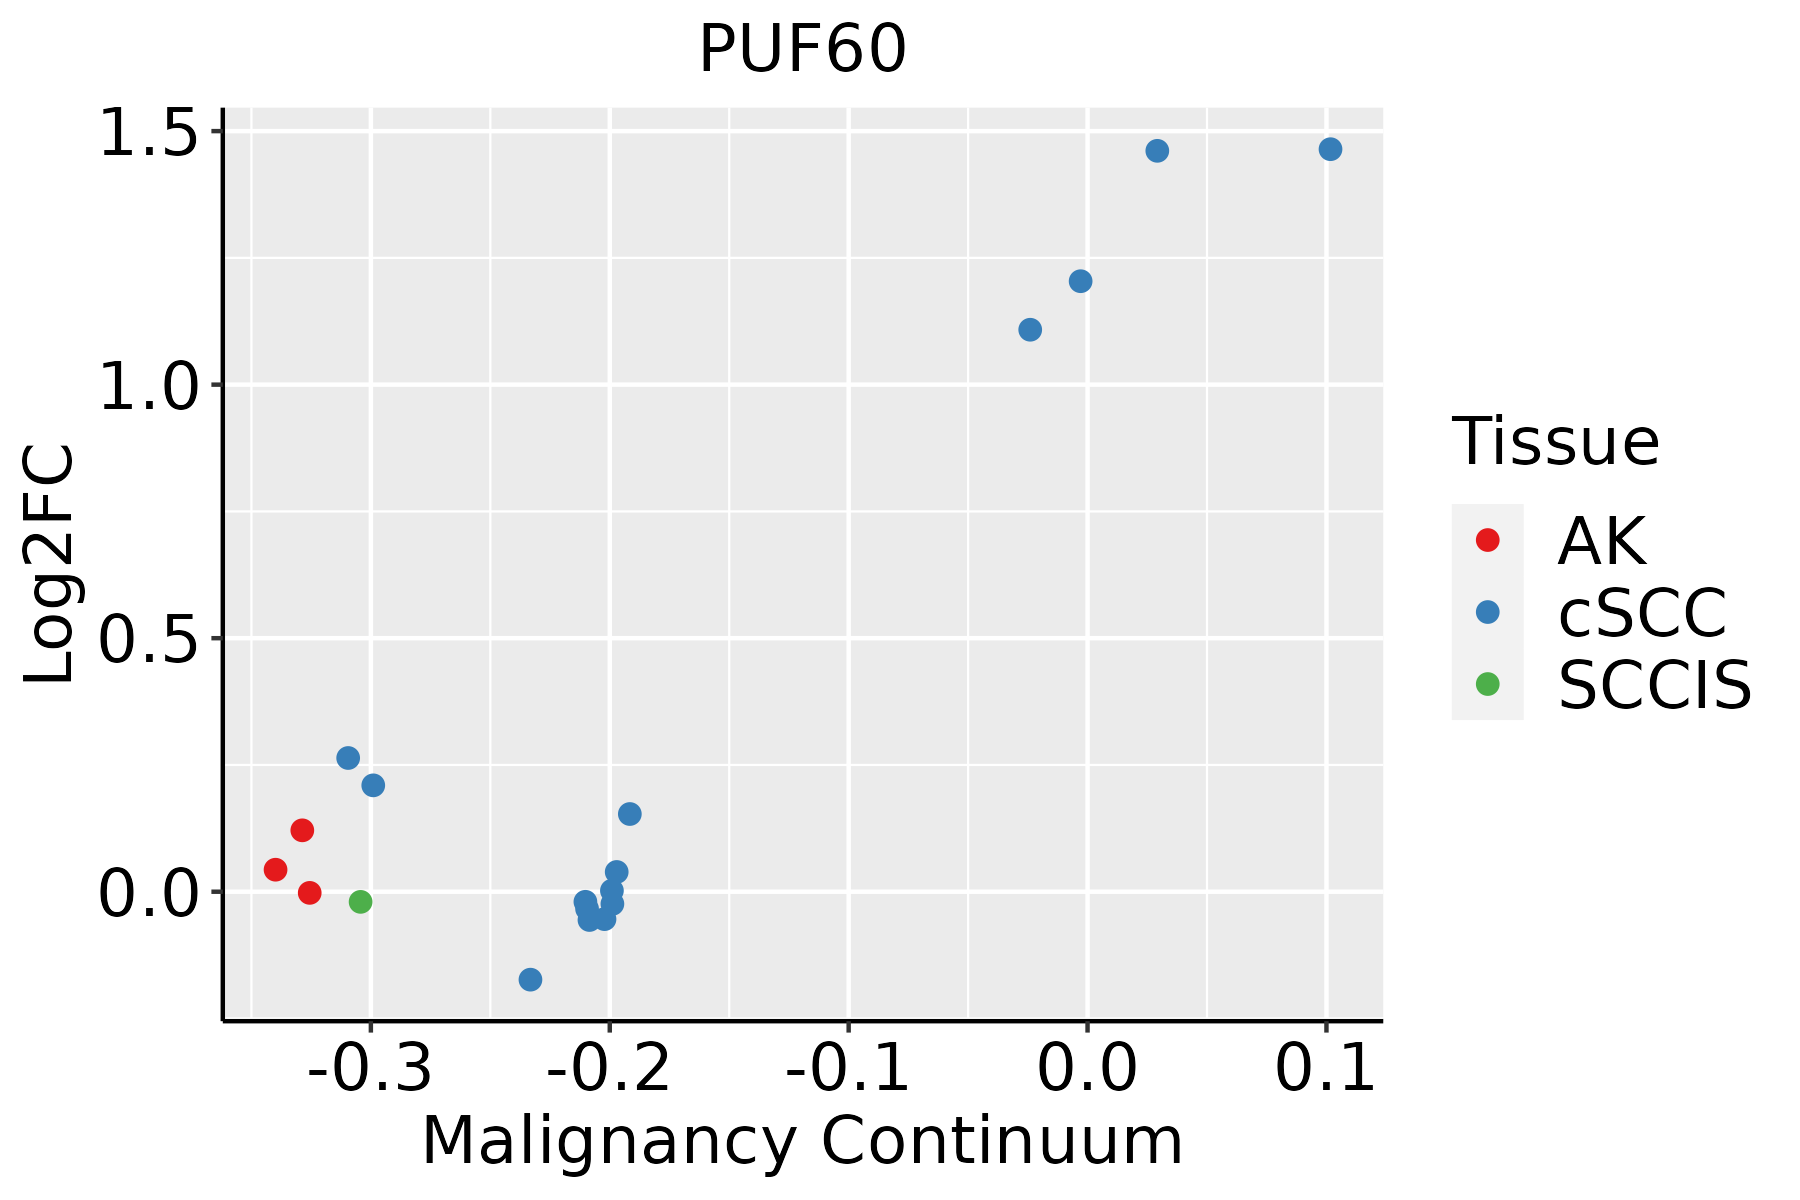 | AK: Actinic keratosis |
| cSCC: Cutaneous squamous cell carcinoma | ||
| SCCIS:squamous cell carcinoma in situ | ||
| Thyroid | 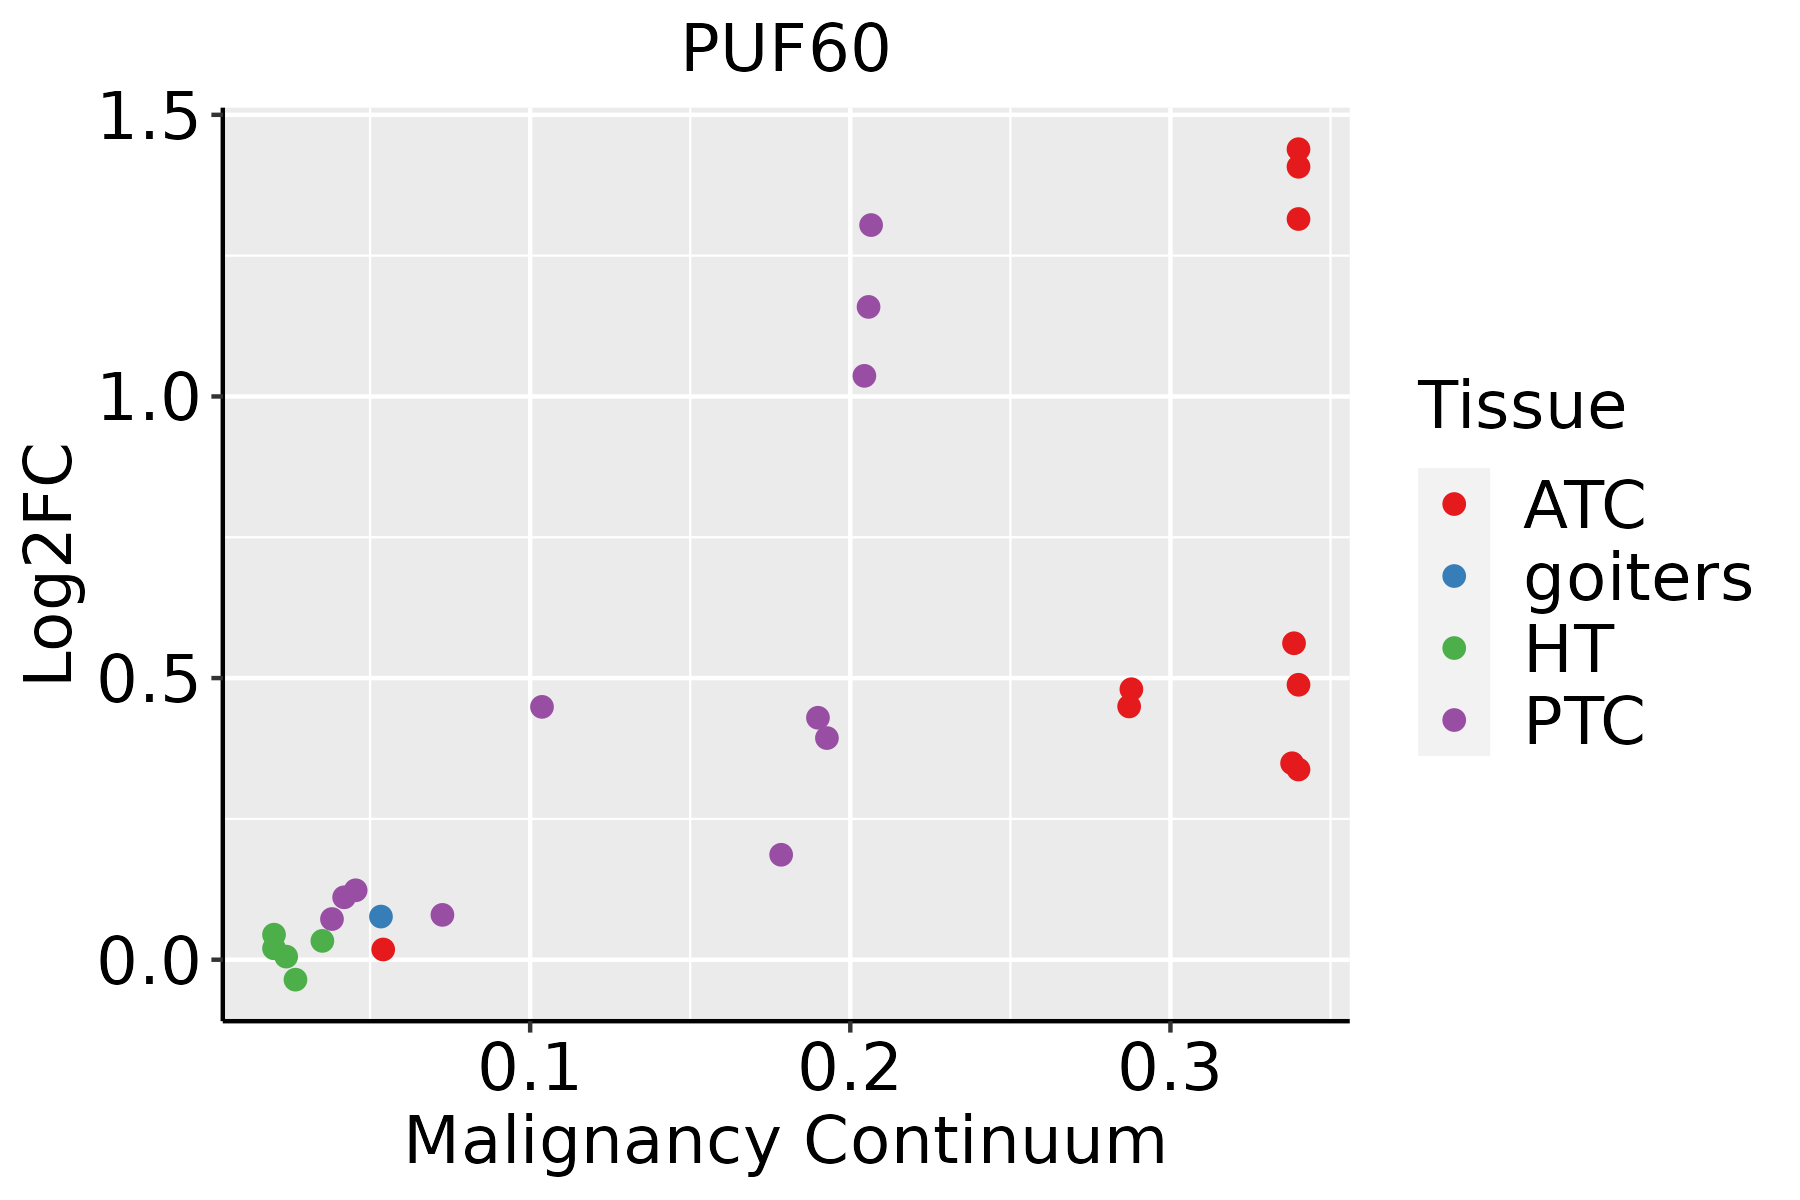 | ATC: Anaplastic thyroid cancer |
| HT: Hashimoto's thyroiditis | ||
| PTC: Papillary thyroid cancer |
| ∗log2FC in expression of this searched gene in stem-like cells from each diseased tissue sample relative to stem-like cells in normal samples in each tissue plotted against the malignancy continuum. Samples are colored based on if they are from different disease stage. |
Top |
Malignant transformation related pathway analysis |
| Find out the enriched GO biological processes and KEGG pathways involved in transition from healthy to precancer to cancer |
| Tissue | Disease Stage | Enriched GO biological Processes |
| Colorectum | AD |  |
| Colorectum | SER |  |
| Colorectum | MSS |  |
| Colorectum | MSI-H |  |
| Colorectum | FAP |  |
| ∗Top 15 enriched GO BP terms are showed in the bar plot of each disease state in each tissue. Each row represents a significant GO biological process which is colored according to the -log10(p.adjust). |
| Page: 1 2 3 4 5 6 7 8 9 |
| GO ID | Tissue | Disease Stage | Description | Gene Ratio | Bg Ratio | pvalue | p.adjust | Count |
| GO:000038116 | Oral cavity | OSCC | regulation of alternative mRNA splicing, via spliceosome | 38/7305 | 60/18723 | 1.17e-04 | 8.46e-04 | 38 |
| GO:00002456 | Oral cavity | OSCC | spliceosomal complex assembly | 45/7305 | 79/18723 | 9.13e-04 | 4.81e-03 | 45 |
| GO:0022613110 | Oral cavity | LP | ribonucleoprotein complex biogenesis | 259/4623 | 463/18723 | 7.20e-48 | 2.25e-44 | 259 |
| GO:0008380110 | Oral cavity | LP | RNA splicing | 237/4623 | 434/18723 | 1.82e-41 | 3.79e-38 | 237 |
| GO:0000375110 | Oral cavity | LP | RNA splicing, via transesterification reactions | 181/4623 | 324/18723 | 1.36e-33 | 1.70e-30 | 181 |
| GO:0000377110 | Oral cavity | LP | RNA splicing, via transesterification reactions with bulged adenosine as nucleophile | 179/4623 | 320/18723 | 2.48e-33 | 2.22e-30 | 179 |
| GO:0000398110 | Oral cavity | LP | mRNA splicing, via spliceosome | 179/4623 | 320/18723 | 2.48e-33 | 2.22e-30 | 179 |
| GO:0071826110 | Oral cavity | LP | ribonucleoprotein complex subunit organization | 130/4623 | 227/18723 | 7.54e-26 | 3.63e-23 | 130 |
| GO:0022618110 | Oral cavity | LP | ribonucleoprotein complex assembly | 125/4623 | 220/18723 | 1.76e-24 | 6.91e-22 | 125 |
| GO:0043484110 | Oral cavity | LP | regulation of RNA splicing | 81/4623 | 148/18723 | 4.34e-15 | 5.79e-13 | 81 |
| GO:005068418 | Oral cavity | LP | regulation of mRNA processing | 76/4623 | 137/18723 | 1.14e-14 | 1.35e-12 | 76 |
| GO:190331119 | Oral cavity | LP | regulation of mRNA metabolic process | 129/4623 | 288/18723 | 5.70e-14 | 6.10e-12 | 129 |
| GO:0048024110 | Oral cavity | LP | regulation of mRNA splicing, via spliceosome | 57/4623 | 101/18723 | 9.06e-12 | 6.84e-10 | 57 |
| GO:000038017 | Oral cavity | LP | alternative mRNA splicing, via spliceosome | 38/4623 | 77/18723 | 2.47e-06 | 5.43e-05 | 38 |
| GO:000024513 | Oral cavity | LP | spliceosomal complex assembly | 34/4623 | 79/18723 | 2.65e-04 | 2.75e-03 | 34 |
| GO:000038117 | Oral cavity | LP | regulation of alternative mRNA splicing, via spliceosome | 27/4623 | 60/18723 | 4.71e-04 | 4.43e-03 | 27 |
| GO:190331133 | Oral cavity | NEOLP | regulation of mRNA metabolic process | 91/2005 | 288/18723 | 2.65e-22 | 7.88e-19 | 91 |
| GO:004348434 | Oral cavity | NEOLP | regulation of RNA splicing | 61/2005 | 148/18723 | 5.56e-22 | 1.10e-18 | 61 |
| GO:005068433 | Oral cavity | NEOLP | regulation of mRNA processing | 56/2005 | 137/18723 | 4.37e-20 | 6.48e-17 | 56 |
| GO:000838033 | Oral cavity | NEOLP | RNA splicing | 110/2005 | 434/18723 | 2.29e-18 | 2.72e-15 | 110 |
| Page: 1 2 3 4 5 6 7 8 9 10 11 12 13 |
| Pathway ID | Tissue | Disease Stage | Description | Gene Ratio | Bg Ratio | pvalue | p.adjust | qvalue | Count |
| hsa030408 | Breast | Precancer | Spliceosome | 39/684 | 217/8465 | 1.44e-06 | 2.27e-05 | 1.74e-05 | 39 |
| hsa0304013 | Breast | Precancer | Spliceosome | 39/684 | 217/8465 | 1.44e-06 | 2.27e-05 | 1.74e-05 | 39 |
| hsa0304023 | Breast | IDC | Spliceosome | 40/867 | 217/8465 | 1.53e-04 | 1.42e-03 | 1.06e-03 | 40 |
| hsa0304033 | Breast | IDC | Spliceosome | 40/867 | 217/8465 | 1.53e-04 | 1.42e-03 | 1.06e-03 | 40 |
| hsa0304043 | Breast | DCIS | Spliceosome | 40/846 | 217/8465 | 8.97e-05 | 8.52e-04 | 6.28e-04 | 40 |
| hsa0304053 | Breast | DCIS | Spliceosome | 40/846 | 217/8465 | 8.97e-05 | 8.52e-04 | 6.28e-04 | 40 |
| hsa03040 | Colorectum | AD | Spliceosome | 73/2092 | 217/8465 | 1.73e-03 | 9.68e-03 | 6.18e-03 | 73 |
| hsa030401 | Colorectum | AD | Spliceosome | 73/2092 | 217/8465 | 1.73e-03 | 9.68e-03 | 6.18e-03 | 73 |
| hsa030402 | Colorectum | MSS | Spliceosome | 66/1875 | 217/8465 | 2.58e-03 | 1.27e-02 | 7.81e-03 | 66 |
| hsa030403 | Colorectum | MSS | Spliceosome | 66/1875 | 217/8465 | 2.58e-03 | 1.27e-02 | 7.81e-03 | 66 |
| hsa030404 | Colorectum | MSI-H | Spliceosome | 37/797 | 217/8465 | 2.49e-04 | 3.23e-03 | 2.70e-03 | 37 |
| hsa030405 | Colorectum | MSI-H | Spliceosome | 37/797 | 217/8465 | 2.49e-04 | 3.23e-03 | 2.70e-03 | 37 |
| hsa0304018 | Esophagus | HGIN | Spliceosome | 79/1383 | 217/8465 | 3.22e-13 | 7.00e-12 | 5.56e-12 | 79 |
| hsa0304019 | Esophagus | HGIN | Spliceosome | 79/1383 | 217/8465 | 3.22e-13 | 7.00e-12 | 5.56e-12 | 79 |
| hsa0304027 | Esophagus | ESCC | Spliceosome | 128/4205 | 217/8465 | 3.31e-03 | 8.79e-03 | 4.50e-03 | 128 |
| hsa0304037 | Esophagus | ESCC | Spliceosome | 128/4205 | 217/8465 | 3.31e-03 | 8.79e-03 | 4.50e-03 | 128 |
| hsa030407 | Liver | Cirrhotic | Spliceosome | 102/2530 | 217/8465 | 5.69e-08 | 9.47e-07 | 5.84e-07 | 102 |
| hsa0304012 | Liver | Cirrhotic | Spliceosome | 102/2530 | 217/8465 | 5.69e-08 | 9.47e-07 | 5.84e-07 | 102 |
| hsa0304022 | Liver | HCC | Spliceosome | 122/4020 | 217/8465 | 5.55e-03 | 1.60e-02 | 8.91e-03 | 122 |
| hsa0304032 | Liver | HCC | Spliceosome | 122/4020 | 217/8465 | 5.55e-03 | 1.60e-02 | 8.91e-03 | 122 |
| Page: 1 2 |
Top |
Cell-cell communication analysis |
| Identification of potential cell-cell interactions between two cell types and their ligand-receptor pairs for different disease states |
| Ligand | Receptor | LRpair | Pathway | Tissue | Disease Stage |
| Page: 1 |
Top |
Single-cell gene regulatory network inference analysis |
| Find out the significant the regulons (TFs) and the target genes of each regulon across cell types for different disease states |
| TF | Cell Type | Tissue | Disease Stage | Target Gene | RSS | Regulon Activity |
| ∗The dot plots of a searched regulon are shown for all cell subpopulations in each disease state of each tissue based on the regulon specific score inferred using pySCENIC and by calculating the average expression. |
| Page: 1 |
Top |
Somatic mutation of malignant transformation related genes |
| Annotation of somatic variants for genes involved in malignant transformation |
| Hugo Symbol | Variant Class | Variant Classification | dbSNP RS | HGVSc | HGVSp | HGVSp Short | SWISSPROT | BIOTYPE | SIFT | PolyPhen | Tumor Sample Barcode | Tissue | Histology | Sex | Age | Stage | Therapy Types | Drugs | Outcome |
| PUF60 | SNV | Missense_Mutation | c.1264N>A | p.Glu422Lys | p.E422K | Q9UHX1 | protein_coding | tolerated(0.2) | benign(0.424) | TCGA-D8-A27G-01 | Breast | breast invasive carcinoma | Female | >=65 | I/II | Unknown | Unknown | SD | |
| PUF60 | deletion | Frame_Shift_Del | c.1278delC | p.Glu427SerfsTer8 | p.E427Sfs*8 | Q9UHX1 | protein_coding | TCGA-EW-A2FV-01 | Breast | breast invasive carcinoma | Female | <65 | III/IV | Chemotherapy | docetaxel | SD | |||
| PUF60 | SNV | Missense_Mutation | novel | c.1643N>G | p.Asp548Gly | p.D548G | Q9UHX1 | protein_coding | deleterious(0) | possibly_damaging(0.654) | TCGA-2W-A8YY-01 | Cervix | cervical & endocervical cancer | Female | <65 | I/II | Chemotherapy | cisplatin | CR |
| PUF60 | SNV | Missense_Mutation | c.178A>G | p.Thr60Ala | p.T60A | Q9UHX1 | protein_coding | deleterious(0.03) | benign(0.184) | TCGA-C5-A7CL-01 | Cervix | cervical & endocervical cancer | Female | <65 | III/IV | Chemotherapy | cisplatin | PD | |
| PUF60 | SNV | Missense_Mutation | c.567N>C | p.Gln189His | p.Q189H | Q9UHX1 | protein_coding | tolerated(0.06) | benign(0.163) | TCGA-EK-A2PG-01 | Cervix | cervical & endocervical cancer | Female | >=65 | I/II | Unknown | Unknown | SD | |
| PUF60 | SNV | Missense_Mutation | novel | c.556N>A | p.Ala186Thr | p.A186T | Q9UHX1 | protein_coding | deleterious(0) | probably_damaging(0.988) | TCGA-AA-3872-01 | Colorectum | colon adenocarcinoma | Male | <65 | III/IV | Unknown | Unknown | SD |
| PUF60 | SNV | Missense_Mutation | c.1469N>C | p.Phe490Ser | p.F490S | Q9UHX1 | protein_coding | deleterious(0.02) | benign(0.239) | TCGA-AD-A5EJ-01 | Colorectum | colon adenocarcinoma | Female | >=65 | I/II | Unknown | Unknown | SD | |
| PUF60 | SNV | Missense_Mutation | c.1162N>T | p.Pro388Ser | p.P388S | Q9UHX1 | protein_coding | deleterious(0.03) | benign(0.245) | TCGA-CM-4743-01 | Colorectum | colon adenocarcinoma | Male | >=65 | I/II | Chemotherapy | capecitabine | SD | |
| PUF60 | SNV | Missense_Mutation | c.688N>A | p.Val230Met | p.V230M | Q9UHX1 | protein_coding | deleterious(0.04) | probably_damaging(0.983) | TCGA-D5-6928-01 | Colorectum | colon adenocarcinoma | Male | >=65 | I/II | Unknown | Unknown | SD | |
| PUF60 | SNV | Missense_Mutation | rs756023794 | c.493G>A | p.Val165Ile | p.V165I | Q9UHX1 | protein_coding | tolerated(0.44) | benign(0.031) | TCGA-G4-6320-01 | Colorectum | colon adenocarcinoma | Male | >=65 | III/IV | Chemotherapy | oxaliplatin | SD |
| Page: 1 2 3 4 5 |
Top |
Related drugs of malignant transformation related genes |
| Identification of chemicals and drugs interact with genes involved in malignant transfromation |
| (DGIdb 4.0) |
| Entrez ID | Symbol | Category | Interaction Types | Drug Claim Name | Drug Name | PMIDs |
| Page: 1 |

Copyright 2023-Present -The University of Texas Health Science Center at Houston |