
|
|||||
|
 | |
| |
| |
| |
| |
| |
|
Gene: PTPN12 |
Gene summary for PTPN12 |
| Gene information | Species | Human | Gene symbol | PTPN12 | Gene ID | 5782 |
| Gene name | protein tyrosine phosphatase non-receptor type 12 | |
| Gene Alias | PTP-PEST | |
| Cytomap | 7q11.23 | |
| Gene Type | protein-coding | GO ID | GO:0006464 | UniProtAcc | B4E105 |
Top |
Malignant transformation analysis |
| Identification of the aberrant gene expression in precancerous and cancerous lesions by comparing the gene expression of stem-like cells in diseased tissues with normal stem cells |
| Entrez ID | Symbol | Replicates | Species | Organ | Tissue | Adj P-value | Log2FC | Malignancy |
| 5782 | PTPN12 | CCI_1 | Human | Cervix | CC | 1.27e-02 | 7.87e-01 | 0.528 |
| 5782 | PTPN12 | CCI_2 | Human | Cervix | CC | 2.52e-14 | 1.48e+00 | 0.5249 |
| 5782 | PTPN12 | CCI_3 | Human | Cervix | CC | 5.39e-13 | 1.06e+00 | 0.516 |
| 5782 | PTPN12 | sample3 | Human | Cervix | CC | 2.34e-11 | 3.74e-01 | 0.1387 |
| 5782 | PTPN12 | T3 | Human | Cervix | CC | 8.75e-16 | 4.04e-01 | 0.1389 |
| 5782 | PTPN12 | HTA11_3410_2000001011 | Human | Colorectum | AD | 4.73e-10 | -4.45e-01 | 0.0155 |
| 5782 | PTPN12 | HTA11_866_3004761011 | Human | Colorectum | AD | 8.25e-03 | -3.54e-01 | 0.096 |
| 5782 | PTPN12 | HTA11_6801_2000001011 | Human | Colorectum | SER | 2.01e-02 | -6.73e-01 | 0.0171 |
| 5782 | PTPN12 | HTA11_10711_2000001011 | Human | Colorectum | AD | 1.38e-02 | -3.14e-01 | 0.0338 |
| 5782 | PTPN12 | HTA11_7696_3000711011 | Human | Colorectum | AD | 1.07e-05 | -3.55e-01 | 0.0674 |
| 5782 | PTPN12 | HTA11_6818_2000001021 | Human | Colorectum | AD | 3.00e-03 | -3.99e-01 | 0.0588 |
| 5782 | PTPN12 | A015-C-203 | Human | Colorectum | FAP | 3.46e-26 | -3.72e-01 | -0.1294 |
| 5782 | PTPN12 | A015-C-204 | Human | Colorectum | FAP | 1.19e-06 | -2.62e-01 | -0.0228 |
| 5782 | PTPN12 | A014-C-040 | Human | Colorectum | FAP | 1.98e-04 | -3.39e-01 | -0.1184 |
| 5782 | PTPN12 | A002-C-201 | Human | Colorectum | FAP | 2.52e-10 | -2.18e-01 | 0.0324 |
| 5782 | PTPN12 | A001-C-119 | Human | Colorectum | FAP | 8.11e-07 | 2.88e-01 | -0.1557 |
| 5782 | PTPN12 | A001-C-108 | Human | Colorectum | FAP | 2.14e-10 | 6.60e-02 | -0.0272 |
| 5782 | PTPN12 | A002-C-205 | Human | Colorectum | FAP | 2.89e-20 | -1.28e-01 | -0.1236 |
| 5782 | PTPN12 | A015-C-005 | Human | Colorectum | FAP | 1.17e-02 | -1.15e-01 | -0.0336 |
| 5782 | PTPN12 | A015-C-006 | Human | Colorectum | FAP | 1.44e-13 | -1.97e-01 | -0.0994 |
| Page: 1 2 3 4 5 6 7 8 9 10 |
| Tissue | Expression Dynamics | Abbreviation |
| Cervix |  | CC: Cervix cancer |
| HSIL_HPV: HPV-infected high-grade squamous intraepithelial lesions | ||
| N_HPV: HPV-infected normal cervix | ||
| Colorectum (GSE201348) | 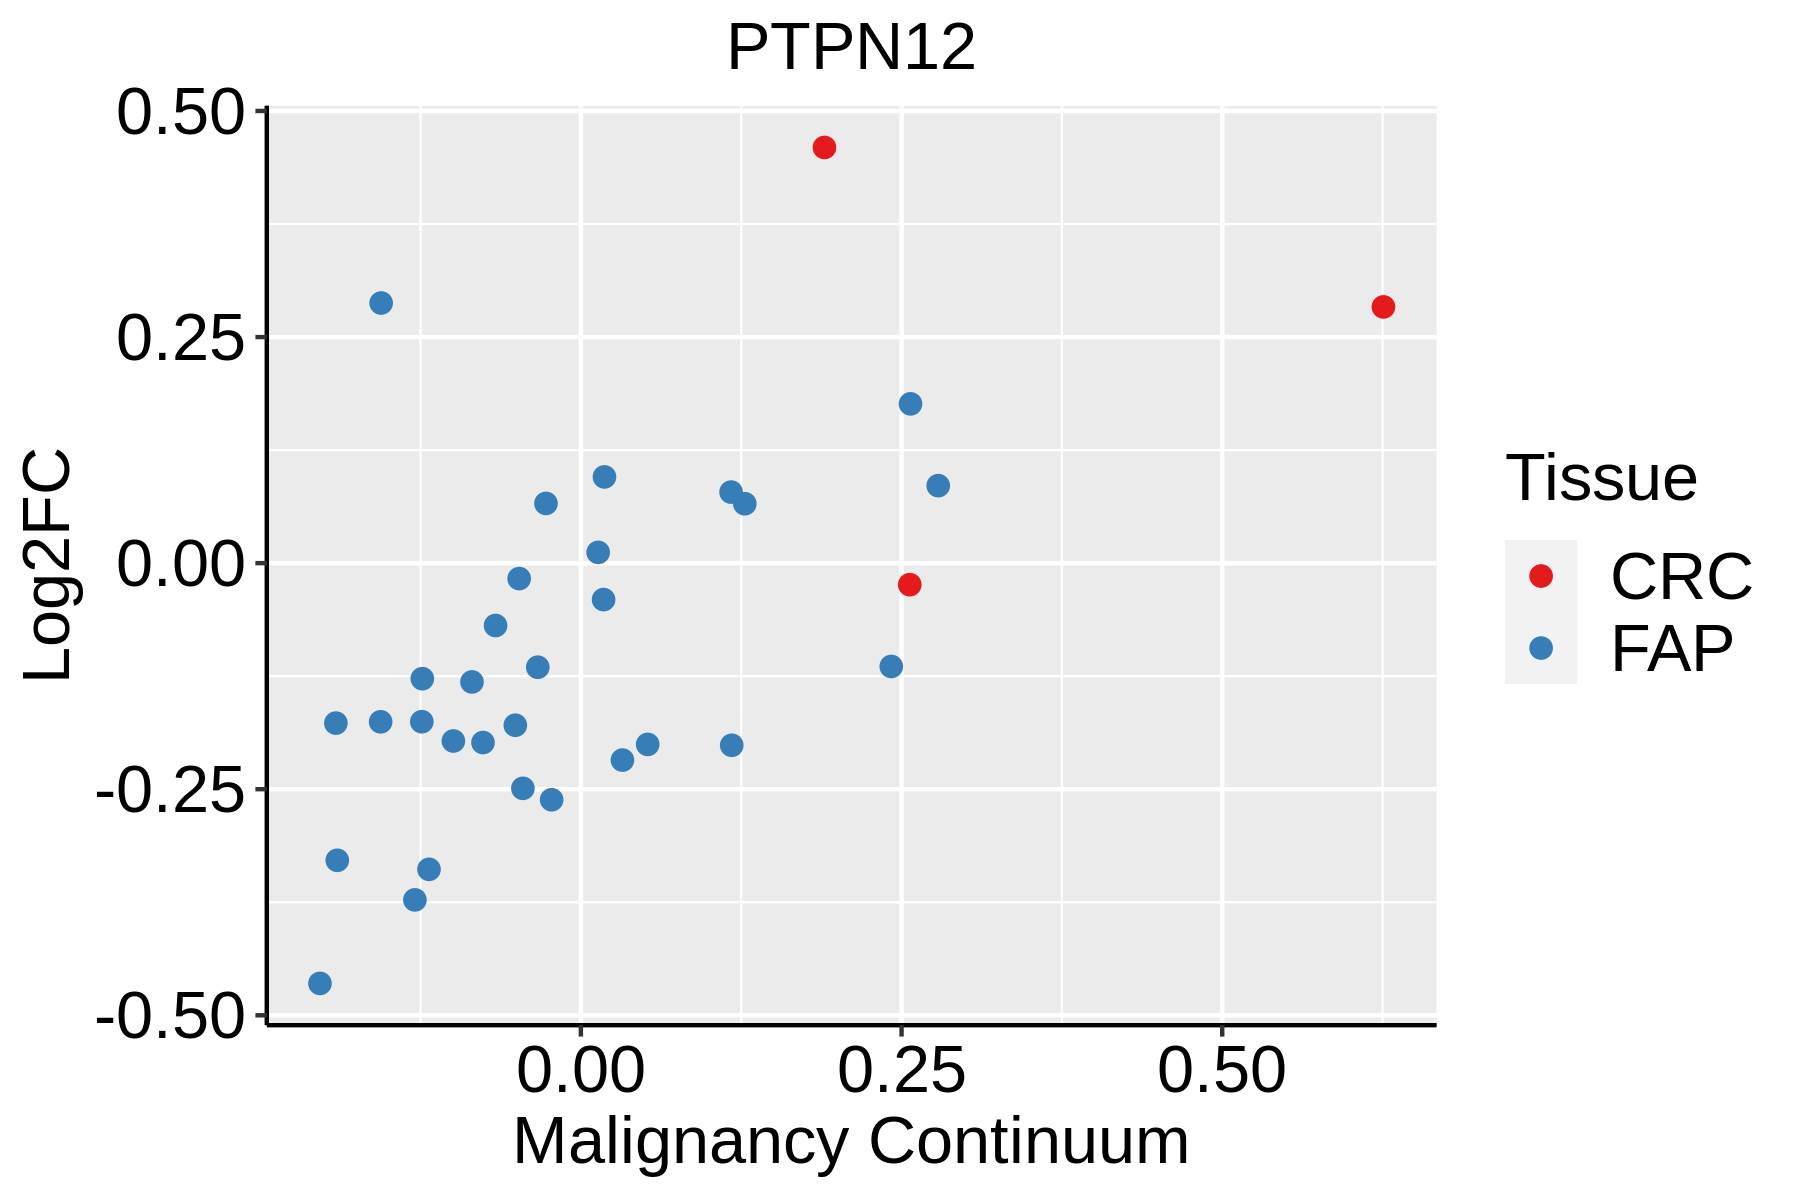 | FAP: Familial adenomatous polyposis |
| CRC: Colorectal cancer | ||
| Colorectum (HTA11) |  | AD: Adenomas |
| SER: Sessile serrated lesions | ||
| MSI-H: Microsatellite-high colorectal cancer | ||
| MSS: Microsatellite stable colorectal cancer | ||
| Endometrium | 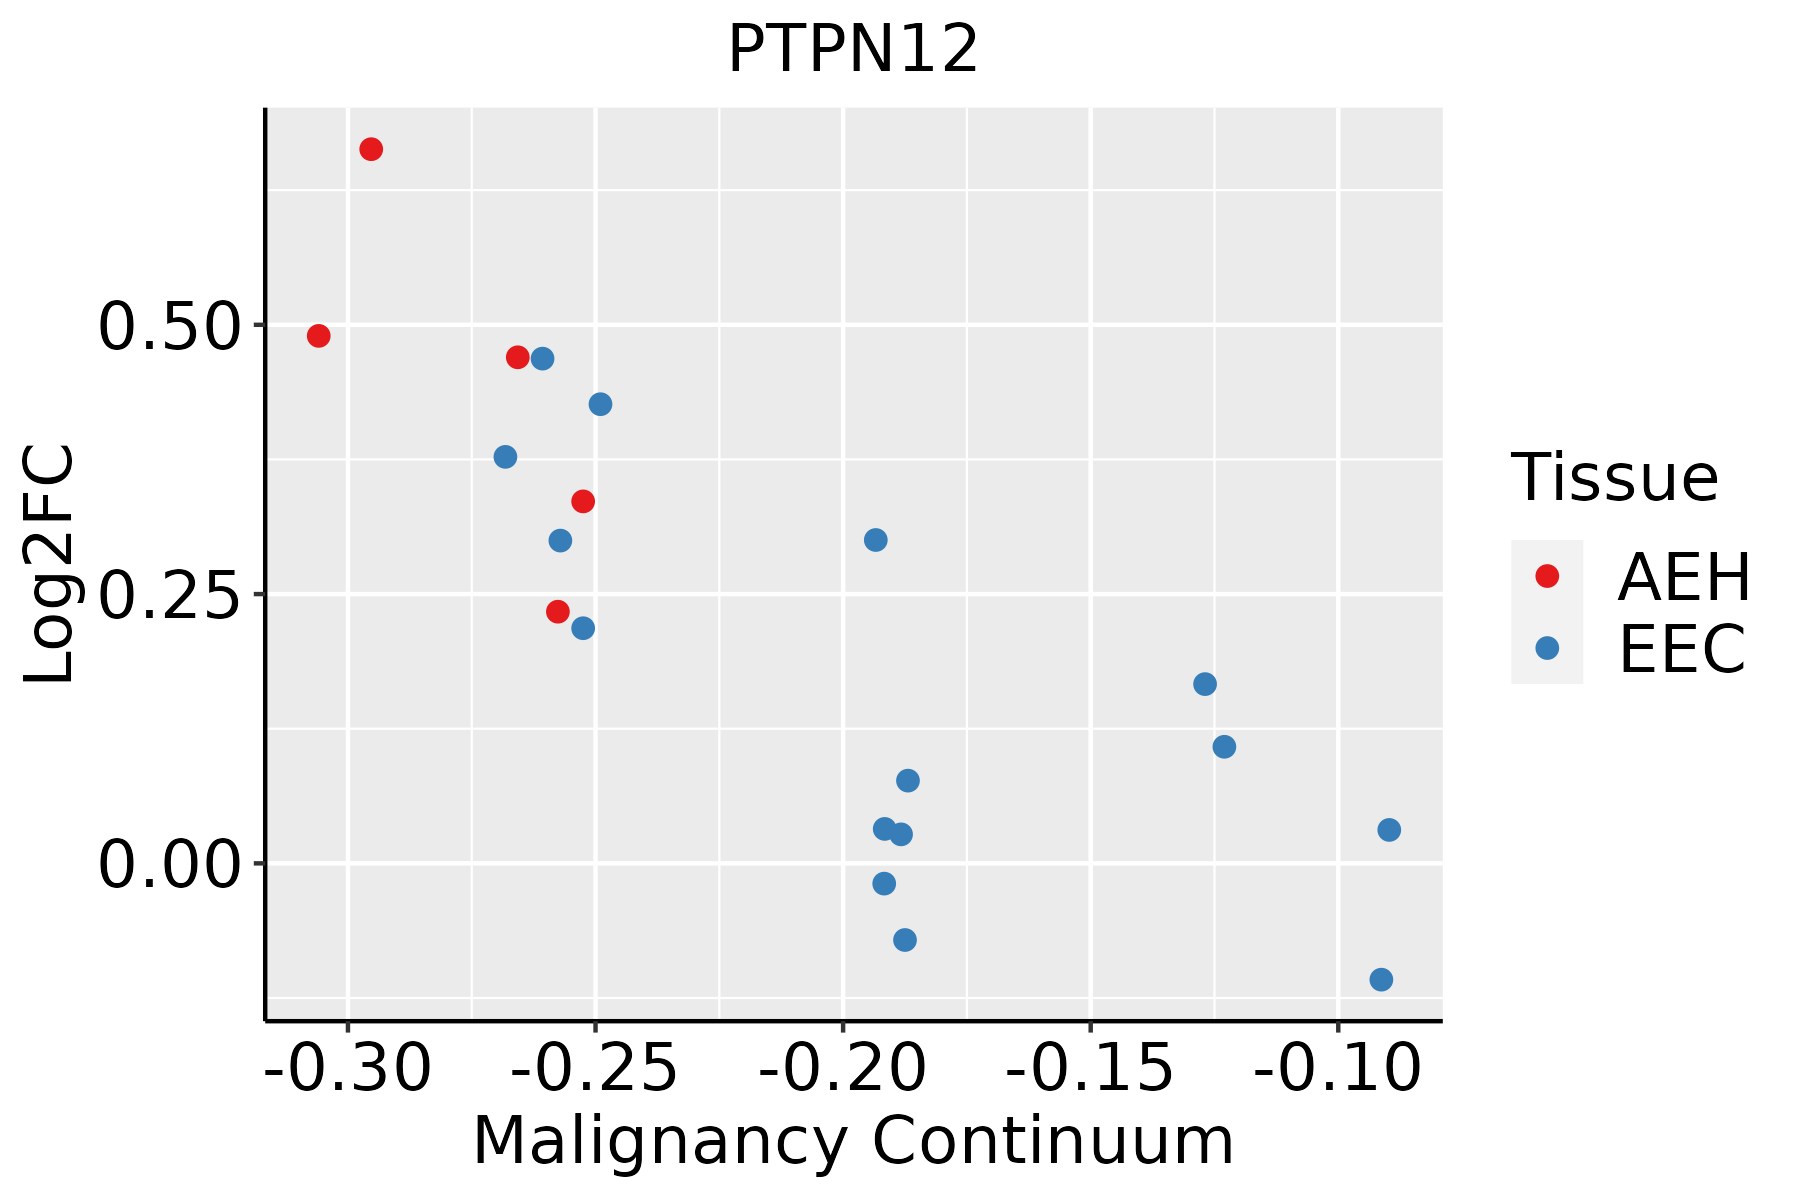 | AEH: Atypical endometrial hyperplasia |
| EEC: Endometrioid Cancer | ||
| Esophagus | 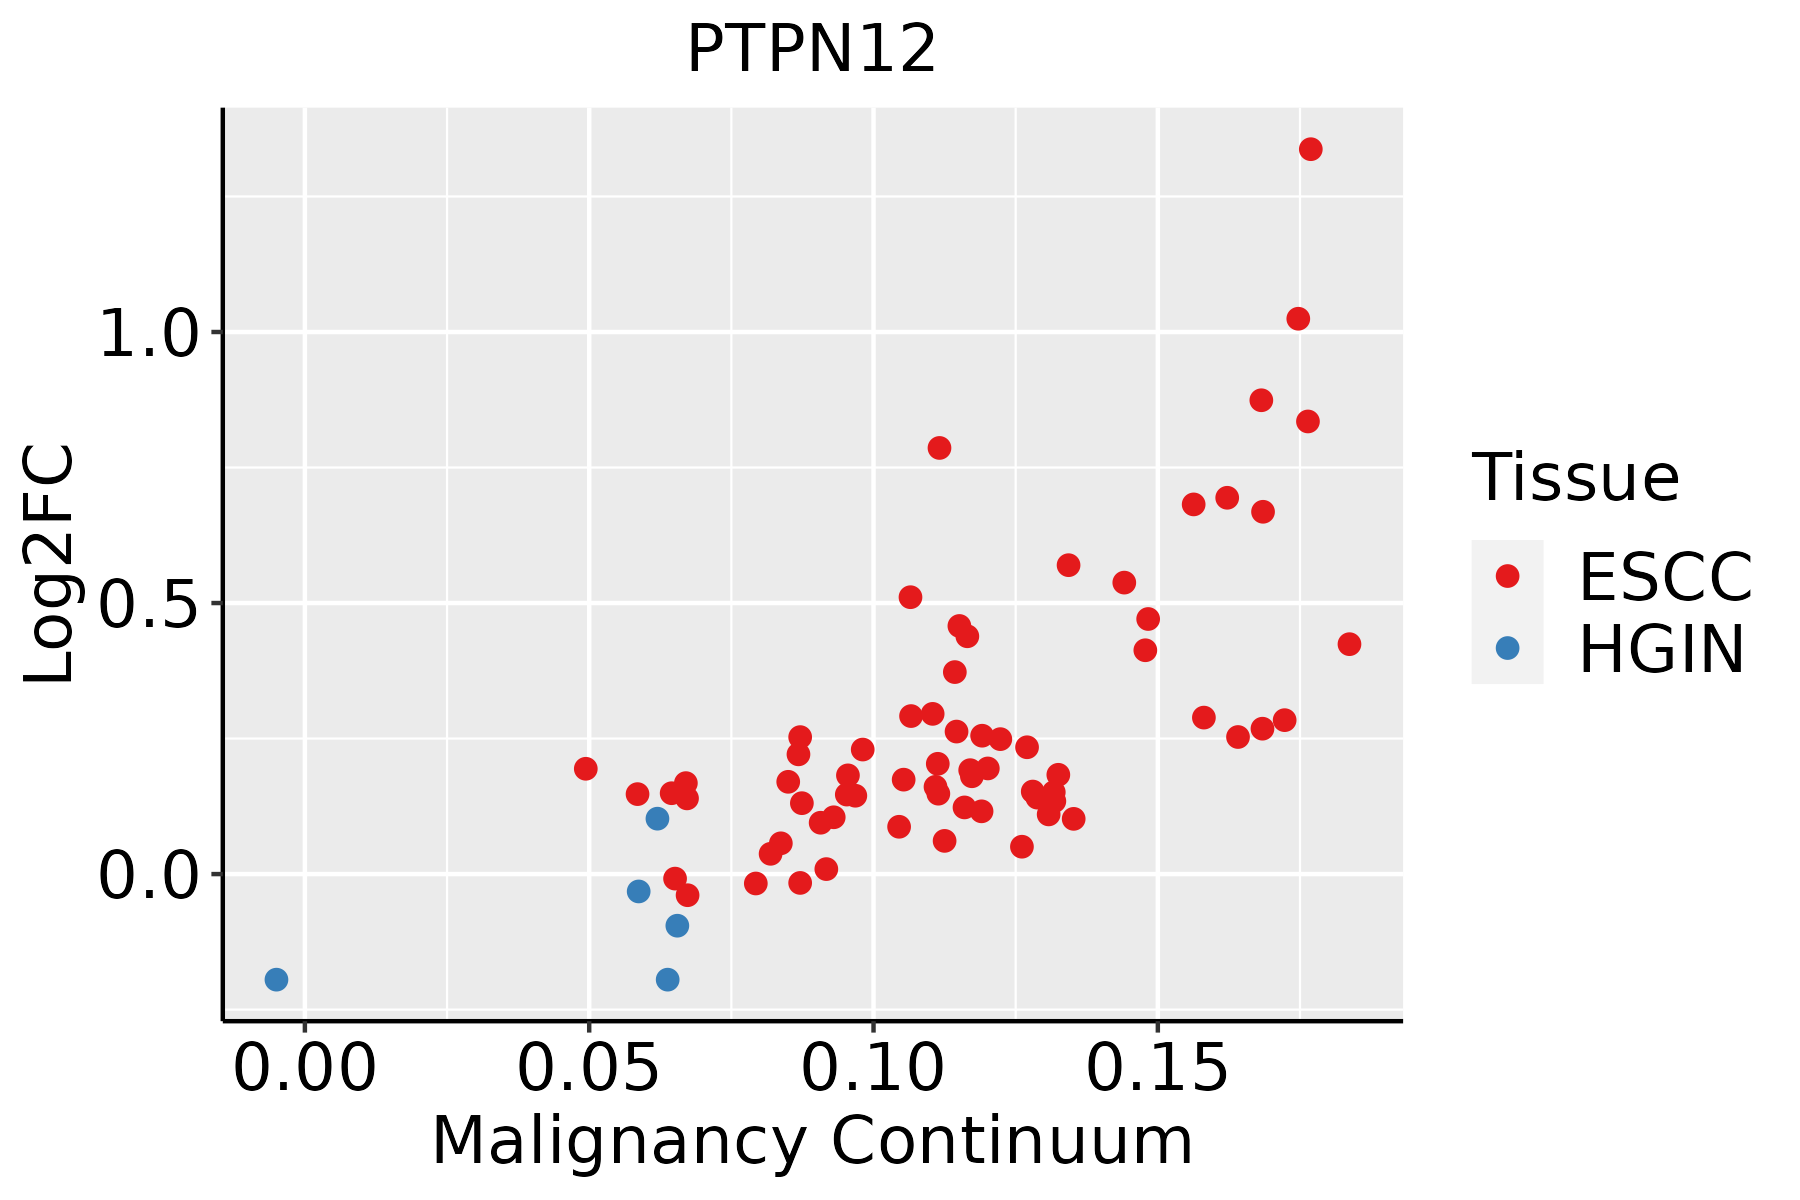 | ESCC: Esophageal squamous cell carcinoma |
| HGIN: High-grade intraepithelial neoplasias | ||
| LGIN: Low-grade intraepithelial neoplasias | ||
| Liver | 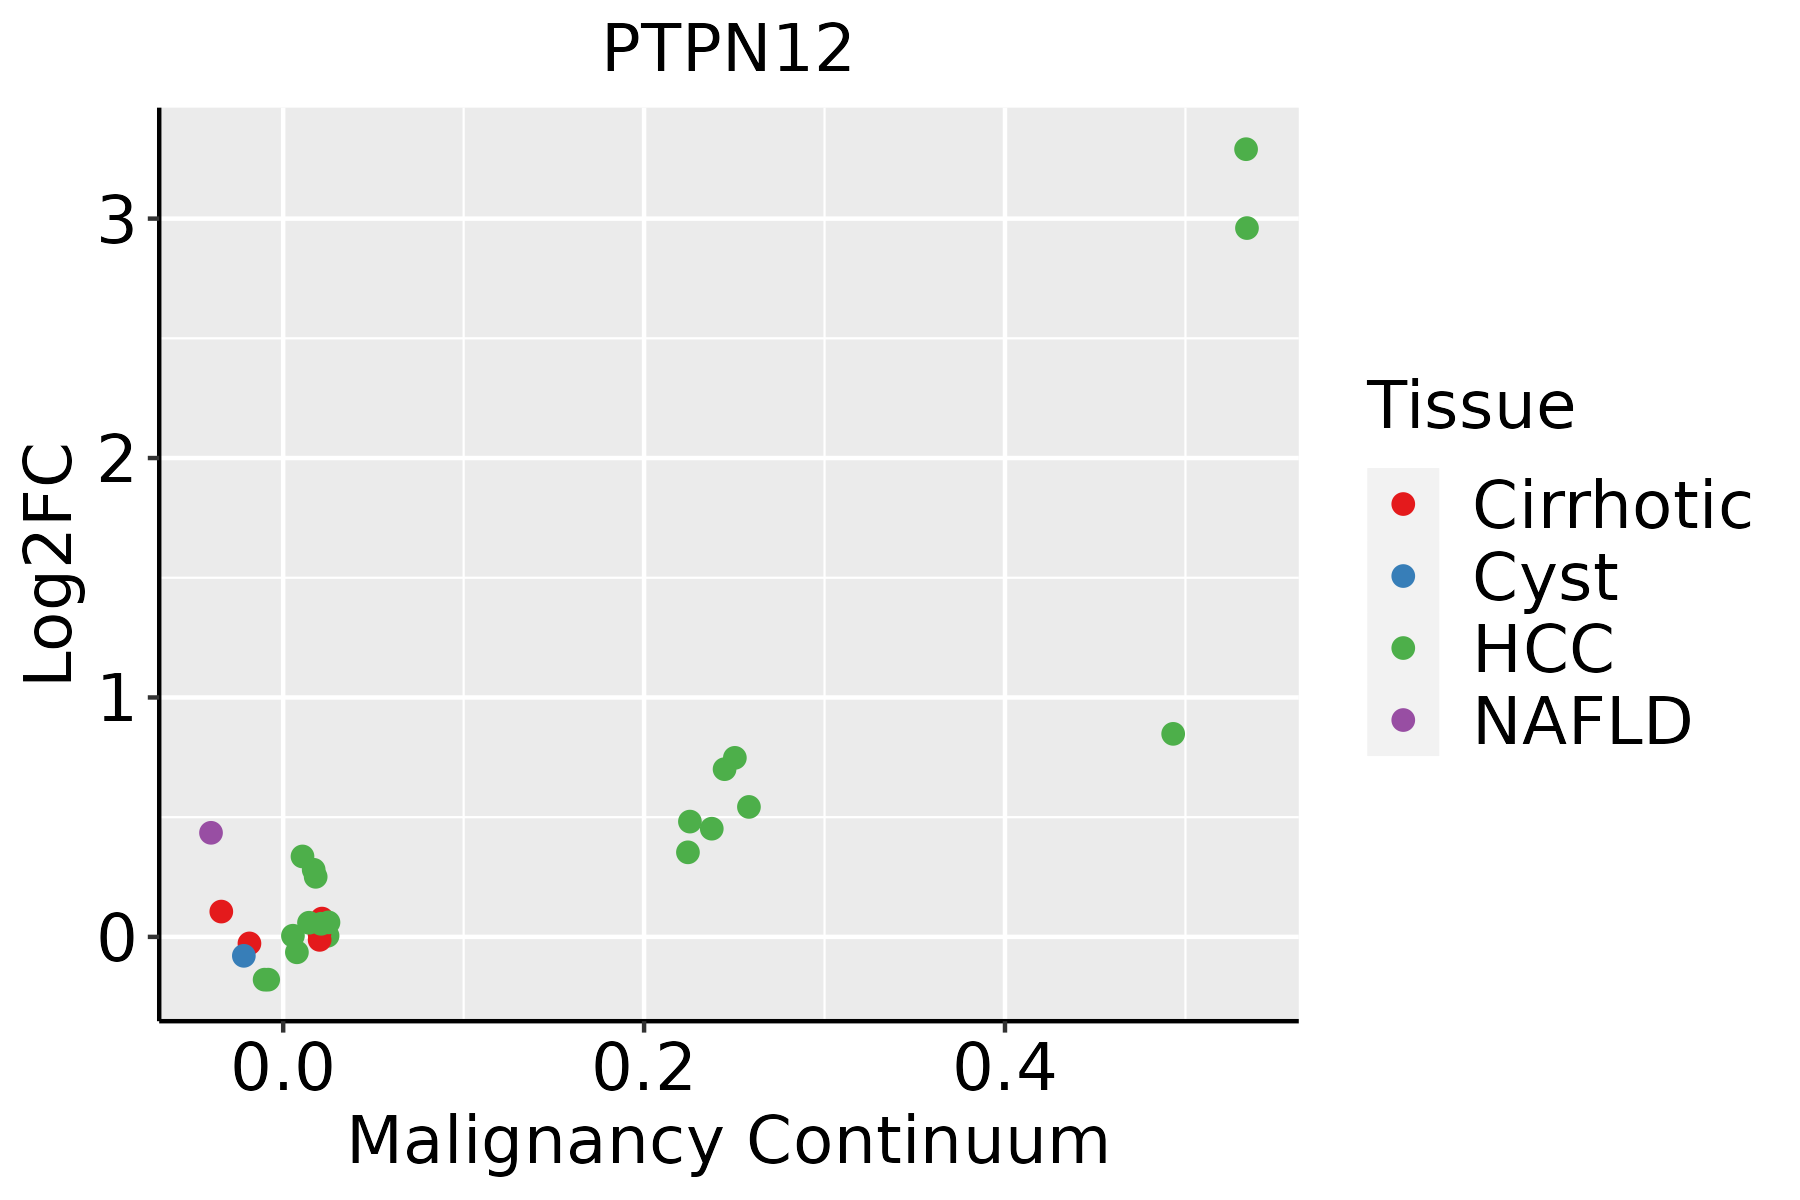 | HCC: Hepatocellular carcinoma |
| NAFLD: Non-alcoholic fatty liver disease | ||
| Lung | 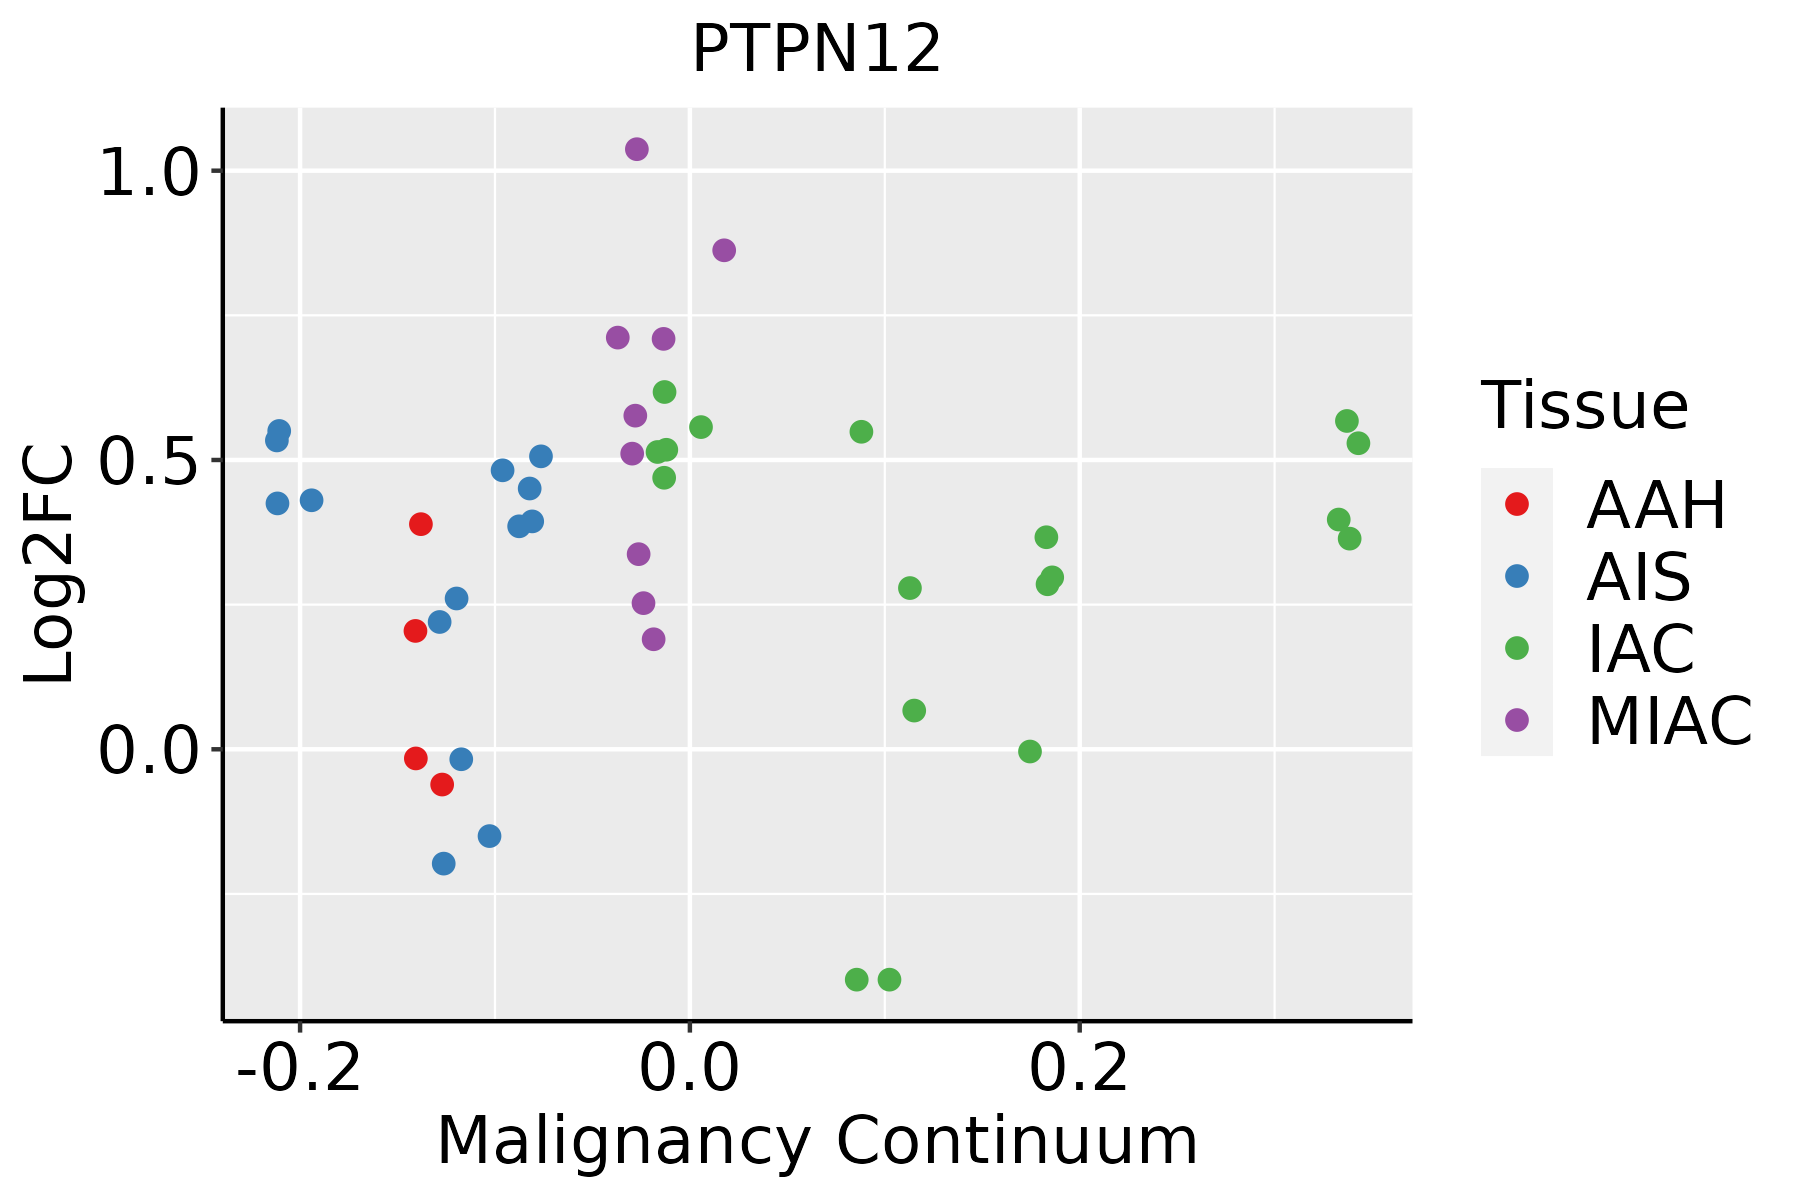 | AAH: Atypical adenomatous hyperplasia |
| AIS: Adenocarcinoma in situ | ||
| IAC: Invasive lung adenocarcinoma | ||
| MIA: Minimally invasive adenocarcinoma | ||
| Oral Cavity | 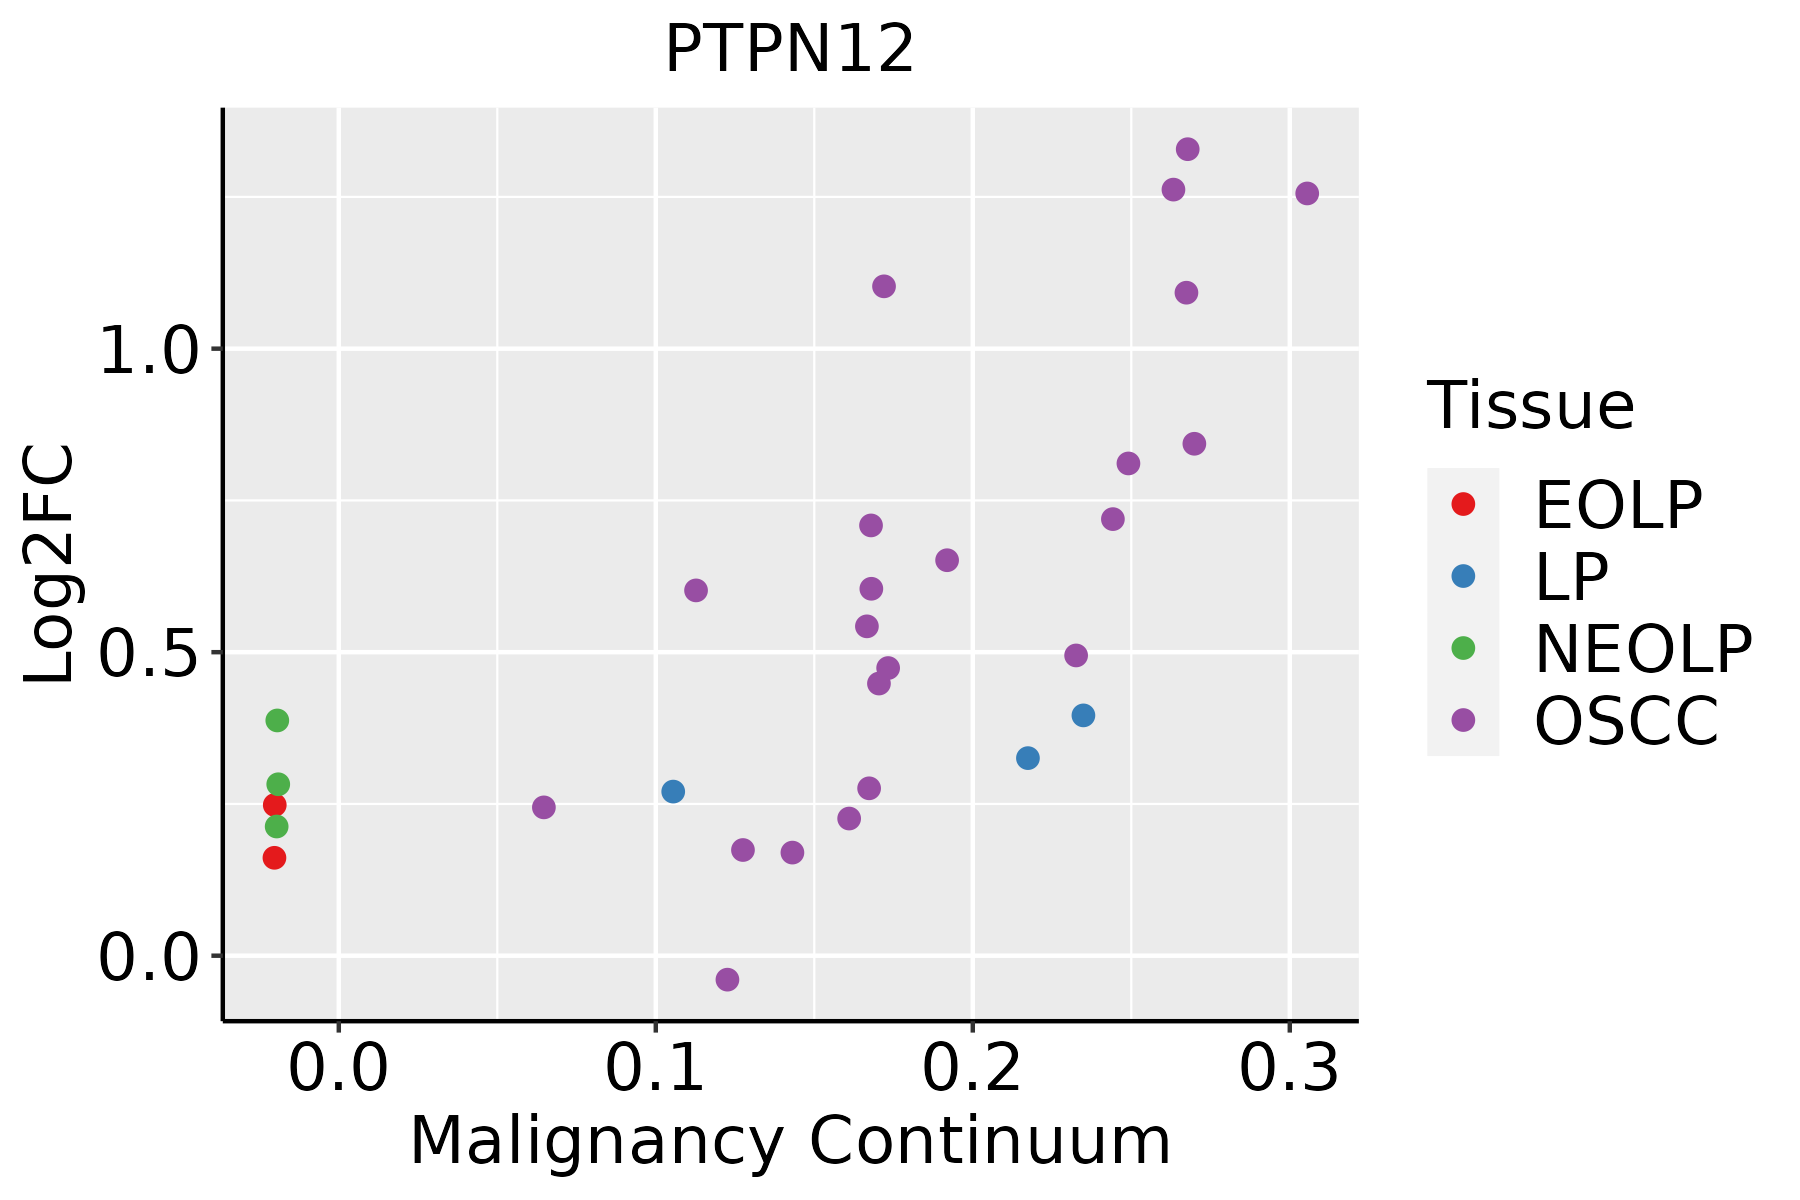 | EOLP: Erosive Oral lichen planus |
| LP: leukoplakia | ||
| NEOLP: Non-erosive oral lichen planus | ||
| OSCC: Oral squamous cell carcinoma | ||
| Skin | 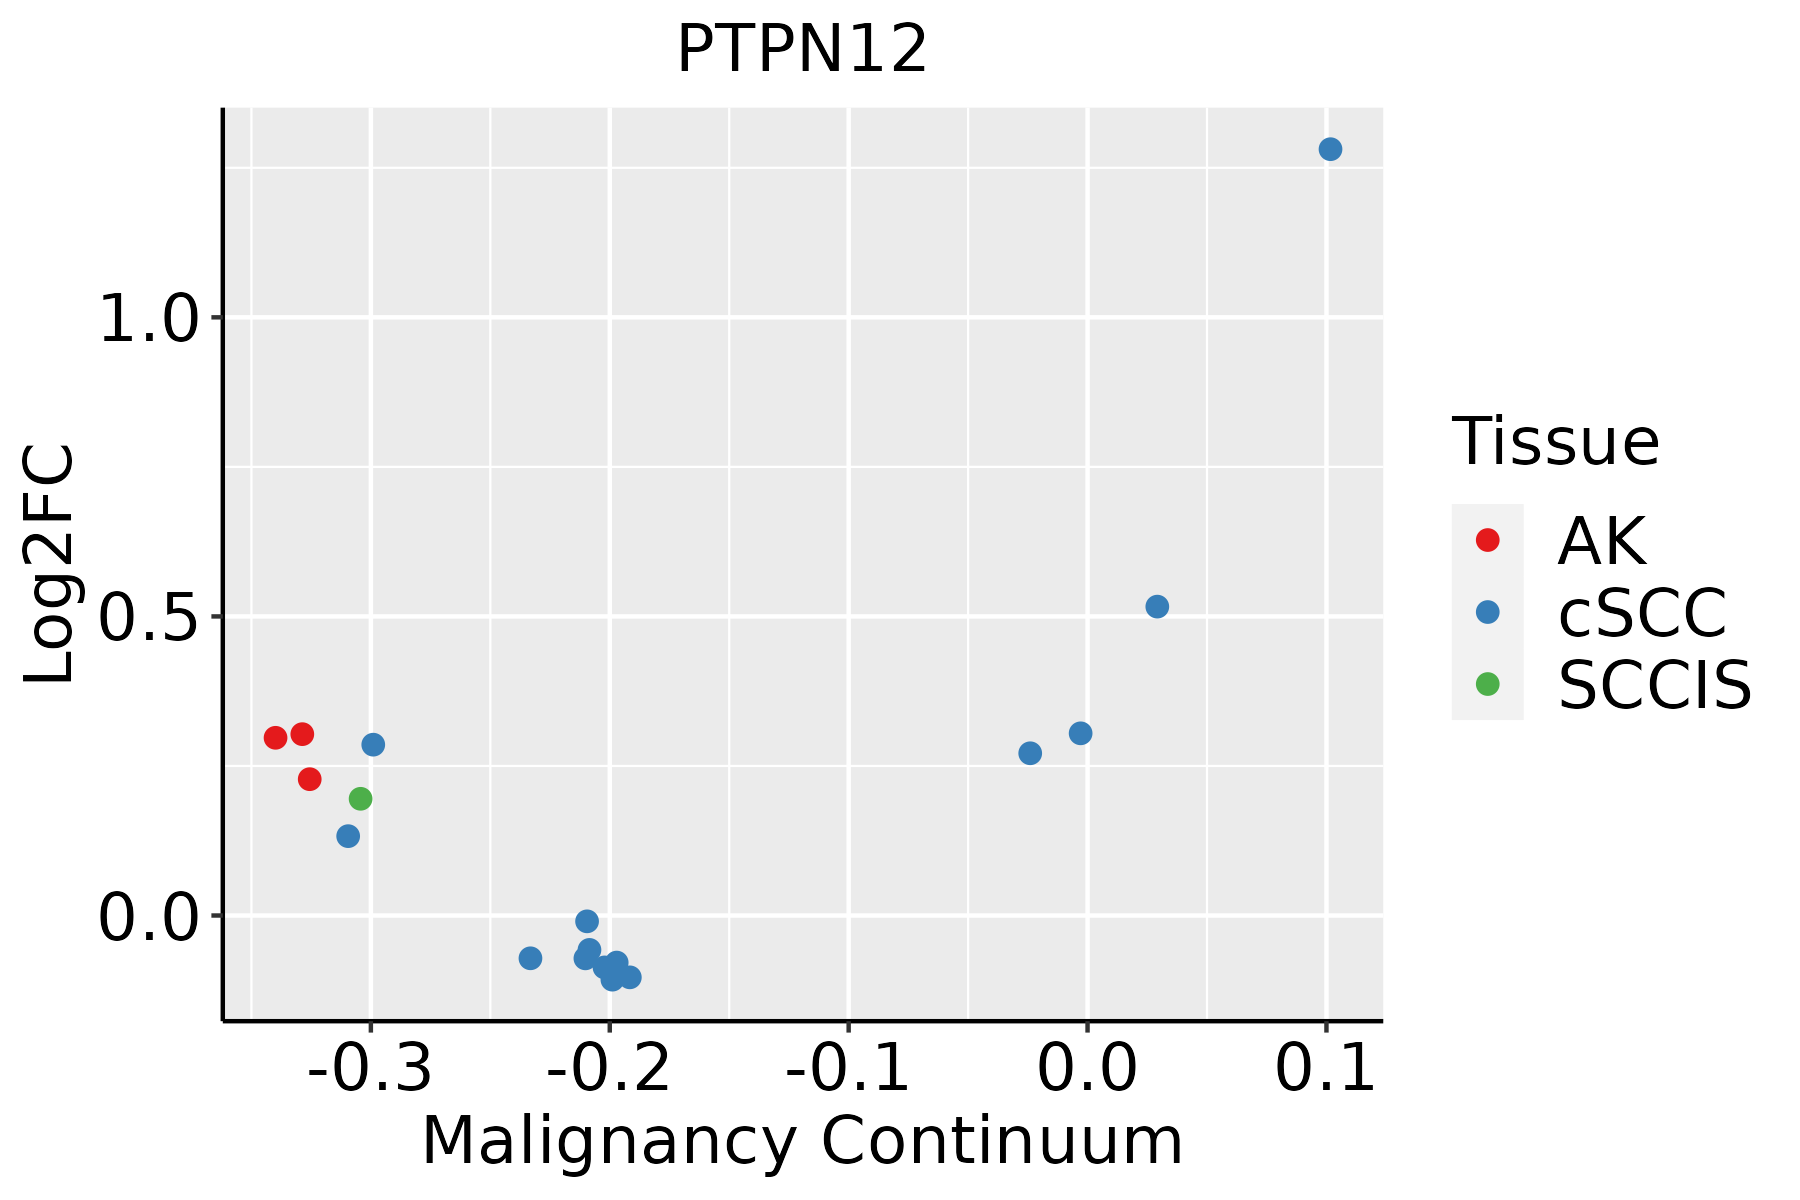 | AK: Actinic keratosis |
| cSCC: Cutaneous squamous cell carcinoma | ||
| SCCIS:squamous cell carcinoma in situ | ||
| Thyroid |  | ATC: Anaplastic thyroid cancer |
| HT: Hashimoto's thyroiditis | ||
| PTC: Papillary thyroid cancer |
| ∗log2FC in expression of this searched gene in stem-like cells from each diseased tissue sample relative to stem-like cells in normal samples in each tissue plotted against the malignancy continuum. Samples are colored based on if they are from different disease stage. |
Top |
Malignant transformation related pathway analysis |
| Find out the enriched GO biological processes and KEGG pathways involved in transition from healthy to precancer to cancer |
| Tissue | Disease Stage | Enriched GO biological Processes |
| Colorectum | AD |  |
| Colorectum | SER |  |
| Colorectum | MSS |  |
| Colorectum | MSI-H |  |
| Colorectum | FAP |  |
| ∗Top 15 enriched GO BP terms are showed in the bar plot of each disease state in each tissue. Each row represents a significant GO biological process which is colored according to the -log10(p.adjust). |
| Page: 1 2 3 4 5 6 7 8 9 |
| GO ID | Tissue | Disease Stage | Description | Gene Ratio | Bg Ratio | pvalue | p.adjust | Count |
| GO:004205810 | Thyroid | PTC | regulation of epidermal growth factor receptor signaling pathway | 38/5968 | 73/18723 | 2.69e-04 | 1.91e-03 | 38 |
| GO:0031099110 | Thyroid | PTC | regeneration | 82/5968 | 198/18723 | 2.83e-03 | 1.40e-02 | 82 |
| GO:00357912 | Thyroid | PTC | platelet-derived growth factor receptor-beta signaling pathway | 9/5968 | 14/18723 | 1.27e-02 | 4.92e-02 | 9 |
| GO:0038127111 | Thyroid | ATC | ERBB signaling pathway | 71/6293 | 121/18723 | 1.31e-08 | 2.69e-07 | 71 |
| GO:0007173111 | Thyroid | ATC | epidermal growth factor receptor signaling pathway | 63/6293 | 108/18723 | 1.15e-07 | 1.92e-06 | 63 |
| GO:007084926 | Thyroid | ATC | response to epidermal growth factor | 33/6293 | 49/18723 | 1.42e-06 | 1.77e-05 | 33 |
| GO:004800815 | Thyroid | ATC | platelet-derived growth factor receptor signaling pathway | 36/6293 | 56/18723 | 2.57e-06 | 3.00e-05 | 36 |
| GO:007136426 | Thyroid | ATC | cellular response to epidermal growth factor stimulus | 30/6293 | 45/18723 | 5.89e-06 | 6.18e-05 | 30 |
| GO:190118515 | Thyroid | ATC | negative regulation of ERBB signaling pathway | 23/6293 | 32/18723 | 1.09e-05 | 1.07e-04 | 23 |
| GO:0006470111 | Thyroid | ATC | protein dephosphorylation | 129/6293 | 281/18723 | 1.11e-05 | 1.09e-04 | 129 |
| GO:190118415 | Thyroid | ATC | regulation of ERBB signaling pathway | 45/6293 | 79/18723 | 1.68e-05 | 1.55e-04 | 45 |
| GO:004205814 | Thyroid | ATC | regulation of epidermal growth factor receptor signaling pathway | 42/6293 | 73/18723 | 2.29e-05 | 2.02e-04 | 42 |
| GO:001631117 | Thyroid | ATC | dephosphorylation | 179/6293 | 417/18723 | 3.88e-05 | 3.15e-04 | 179 |
| GO:003109932 | Thyroid | ATC | regeneration | 91/6293 | 198/18723 | 1.95e-04 | 1.31e-03 | 91 |
| GO:00357911 | Thyroid | ATC | platelet-derived growth factor receptor-beta signaling pathway | 10/6293 | 14/18723 | 4.31e-03 | 1.80e-02 | 10 |
| Page: 1 2 3 4 5 6 7 8 9 10 |
| Pathway ID | Tissue | Disease Stage | Description | Gene Ratio | Bg Ratio | pvalue | p.adjust | qvalue | Count |
| Page: 1 |
Top |
Cell-cell communication analysis |
| Identification of potential cell-cell interactions between two cell types and their ligand-receptor pairs for different disease states |
| Ligand | Receptor | LRpair | Pathway | Tissue | Disease Stage |
| Page: 1 |
Top |
Single-cell gene regulatory network inference analysis |
| Find out the significant the regulons (TFs) and the target genes of each regulon across cell types for different disease states |
| TF | Cell Type | Tissue | Disease Stage | Target Gene | RSS | Regulon Activity |
| ∗The dot plots of a searched regulon are shown for all cell subpopulations in each disease state of each tissue based on the regulon specific score inferred using pySCENIC and by calculating the average expression. |
| Page: 1 |
Top |
Somatic mutation of malignant transformation related genes |
| Annotation of somatic variants for genes involved in malignant transformation |
| Hugo Symbol | Variant Class | Variant Classification | dbSNP RS | HGVSc | HGVSp | HGVSp Short | SWISSPROT | BIOTYPE | SIFT | PolyPhen | Tumor Sample Barcode | Tissue | Histology | Sex | Age | Stage | Therapy Types | Drugs | Outcome |
| PTPN12 | SNV | Missense_Mutation | c.824N>G | p.Ser275Cys | p.S275C | Q05209 | protein_coding | deleterious(0.02) | probably_damaging(1) | TCGA-A1-A0SI-01 | Breast | breast invasive carcinoma | Female | <65 | I/II | Unknown | Unknown | SD | |
| PTPN12 | SNV | Missense_Mutation | c.263A>T | p.Tyr88Phe | p.Y88F | Q05209 | protein_coding | deleterious(0) | probably_damaging(1) | TCGA-A8-A07U-01 | Breast | breast invasive carcinoma | Female | >=65 | III/IV | Chemotherapy | 5-fluorouracil | SD | |
| PTPN12 | SNV | Missense_Mutation | c.824N>T | p.Ser275Phe | p.S275F | Q05209 | protein_coding | deleterious(0) | probably_damaging(1) | TCGA-BH-A0B6-01 | Breast | breast invasive carcinoma | Female | <65 | I/II | Unknown | Unknown | SD | |
| PTPN12 | SNV | Missense_Mutation | rs766786152 | c.1427N>G | p.Ser476Cys | p.S476C | Q05209 | protein_coding | tolerated_low_confidence(0.08) | probably_damaging(0.91) | TCGA-BH-A0DK-01 | Breast | breast invasive carcinoma | Female | <65 | I/II | Hormone Therapy | tamoxiphen | SD |
| PTPN12 | SNV | Missense_Mutation | c.2063C>T | p.Ala688Val | p.A688V | Q05209 | protein_coding | deleterious(0) | benign(0.368) | TCGA-BH-A0HF-01 | Breast | breast invasive carcinoma | Female | >=65 | I/II | Hormone Therapy | arimidex | SD | |
| PTPN12 | SNV | Missense_Mutation | c.171N>C | p.Glu57Asp | p.E57D | Q05209 | protein_coding | deleterious(0.04) | benign(0.375) | TCGA-BH-A18T-01 | Breast | breast invasive carcinoma | Female | >=65 | I/II | Unknown | Unknown | PD | |
| PTPN12 | insertion | Frame_Shift_Ins | novel | c.1281_1282insA | p.Leu430IlefsTer8 | p.L430Ifs*8 | Q05209 | protein_coding | TCGA-AN-A0AK-01 | Breast | breast invasive carcinoma | Female | >=65 | I/II | Unknown | Unknown | SD | ||
| PTPN12 | insertion | In_Frame_Ins | novel | c.1187_1188insCCAATTCTTTCTGTTTTA | p.Val396_Ser397insGlnPhePheLeuPheTyr | p.V396_S397insQFFLFY | Q05209 | protein_coding | TCGA-AN-A0FS-01 | Breast | breast invasive carcinoma | Female | <65 | I/II | Unknown | Unknown | SD | ||
| PTPN12 | SNV | Missense_Mutation | c.824C>T | p.Ser275Phe | p.S275F | Q05209 | protein_coding | deleterious(0) | probably_damaging(1) | TCGA-C5-A7X5-01 | Cervix | cervical & endocervical cancer | Female | >=65 | I/II | Chemotherapy | carboplatin | PD | |
| PTPN12 | SNV | Missense_Mutation | c.772G>C | p.Glu258Gln | p.E258Q | Q05209 | protein_coding | deleterious(0.02) | probably_damaging(0.974) | TCGA-EK-A2PI-01 | Cervix | cervical & endocervical cancer | Female | <65 | III/IV | Unknown | Unknown | SD |
| Page: 1 2 3 4 5 6 7 8 9 |
Top |
Related drugs of malignant transformation related genes |
| Identification of chemicals and drugs interact with genes involved in malignant transfromation |
| (DGIdb 4.0) |
| Entrez ID | Symbol | Category | Interaction Types | Drug Claim Name | Drug Name | PMIDs |
| 5782 | PTPN12 | PROTEIN PHOSPHATASE, DRUGGABLE GENOME, KINASE | CRIZOTINIB | CRIZOTINIB | 29578538 | |
| 5782 | PTPN12 | PROTEIN PHOSPHATASE, DRUGGABLE GENOME, KINASE | SUNITINIB | SUNITINIB | 29578538 | |
| 5782 | PTPN12 | PROTEIN PHOSPHATASE, DRUGGABLE GENOME, KINASE | GNF-PF-231 | CHEMBL601167 |
| Page: 1 |

Copyright 2023-Present -The University of Texas Health Science Center at Houston |