
|
|||||
|
 | |
| |
| |
| |
| |
| |
|
Gene: PSAP |
Gene summary for PSAP |
| Gene information | Species | Human | Gene symbol | PSAP | Gene ID | 5660 |
| Gene name | prosaposin | |
| Gene Alias | GLBA | |
| Cytomap | 10q22.1 | |
| Gene Type | protein-coding | GO ID | GO:0000003 | UniProtAcc | P07602 |
Top |
Malignant transformation analysis |
| Identification of the aberrant gene expression in precancerous and cancerous lesions by comparing the gene expression of stem-like cells in diseased tissues with normal stem cells |
| Entrez ID | Symbol | Replicates | Species | Organ | Tissue | Adj P-value | Log2FC | Malignancy |
| 5660 | PSAP | GSM4909280 | Human | Breast | Precancer | 2.92e-03 | -6.20e-01 | 0.0305 |
| 5660 | PSAP | GSM4909285 | Human | Breast | IDC | 6.36e-08 | 3.99e-01 | 0.21 |
| 5660 | PSAP | GSM4909286 | Human | Breast | IDC | 2.24e-02 | 1.64e-01 | 0.1081 |
| 5660 | PSAP | GSM4909291 | Human | Breast | IDC | 3.43e-18 | 5.77e-01 | 0.1753 |
| 5660 | PSAP | GSM4909293 | Human | Breast | IDC | 1.52e-73 | 9.13e-01 | 0.1581 |
| 5660 | PSAP | GSM4909294 | Human | Breast | IDC | 5.29e-10 | -3.93e-01 | 0.2022 |
| 5660 | PSAP | GSM4909296 | Human | Breast | IDC | 3.53e-12 | 5.37e-02 | 0.1524 |
| 5660 | PSAP | GSM4909297 | Human | Breast | IDC | 2.67e-18 | -2.35e-01 | 0.1517 |
| 5660 | PSAP | GSM4909298 | Human | Breast | IDC | 7.44e-03 | -1.58e-01 | 0.1551 |
| 5660 | PSAP | GSM4909302 | Human | Breast | IDC | 1.53e-02 | 1.73e-01 | 0.1545 |
| 5660 | PSAP | GSM4909309 | Human | Breast | IDC | 9.50e-05 | -2.30e-01 | 0.0483 |
| 5660 | PSAP | GSM4909311 | Human | Breast | IDC | 1.01e-48 | 2.74e-02 | 0.1534 |
| 5660 | PSAP | GSM4909312 | Human | Breast | IDC | 1.08e-11 | -3.31e-02 | 0.1552 |
| 5660 | PSAP | GSM4909313 | Human | Breast | IDC | 1.18e-05 | 1.05e-01 | 0.0391 |
| 5660 | PSAP | GSM4909316 | Human | Breast | IDC | 3.41e-04 | -2.73e-01 | 0.21 |
| 5660 | PSAP | GSM4909318 | Human | Breast | IDC | 1.03e-02 | -5.38e-01 | 0.2031 |
| 5660 | PSAP | GSM4909319 | Human | Breast | IDC | 8.24e-53 | -4.62e-01 | 0.1563 |
| 5660 | PSAP | GSM4909320 | Human | Breast | IDC | 1.36e-07 | -5.09e-01 | 0.1575 |
| 5660 | PSAP | GSM4909321 | Human | Breast | IDC | 1.46e-21 | -2.31e-01 | 0.1559 |
| 5660 | PSAP | brca2 | Human | Breast | Precancer | 5.82e-10 | 3.83e-01 | -0.024 |
| Page: 1 2 3 4 5 6 7 8 9 10 11 12 13 14 15 |
| Tissue | Expression Dynamics | Abbreviation |
| Breast | 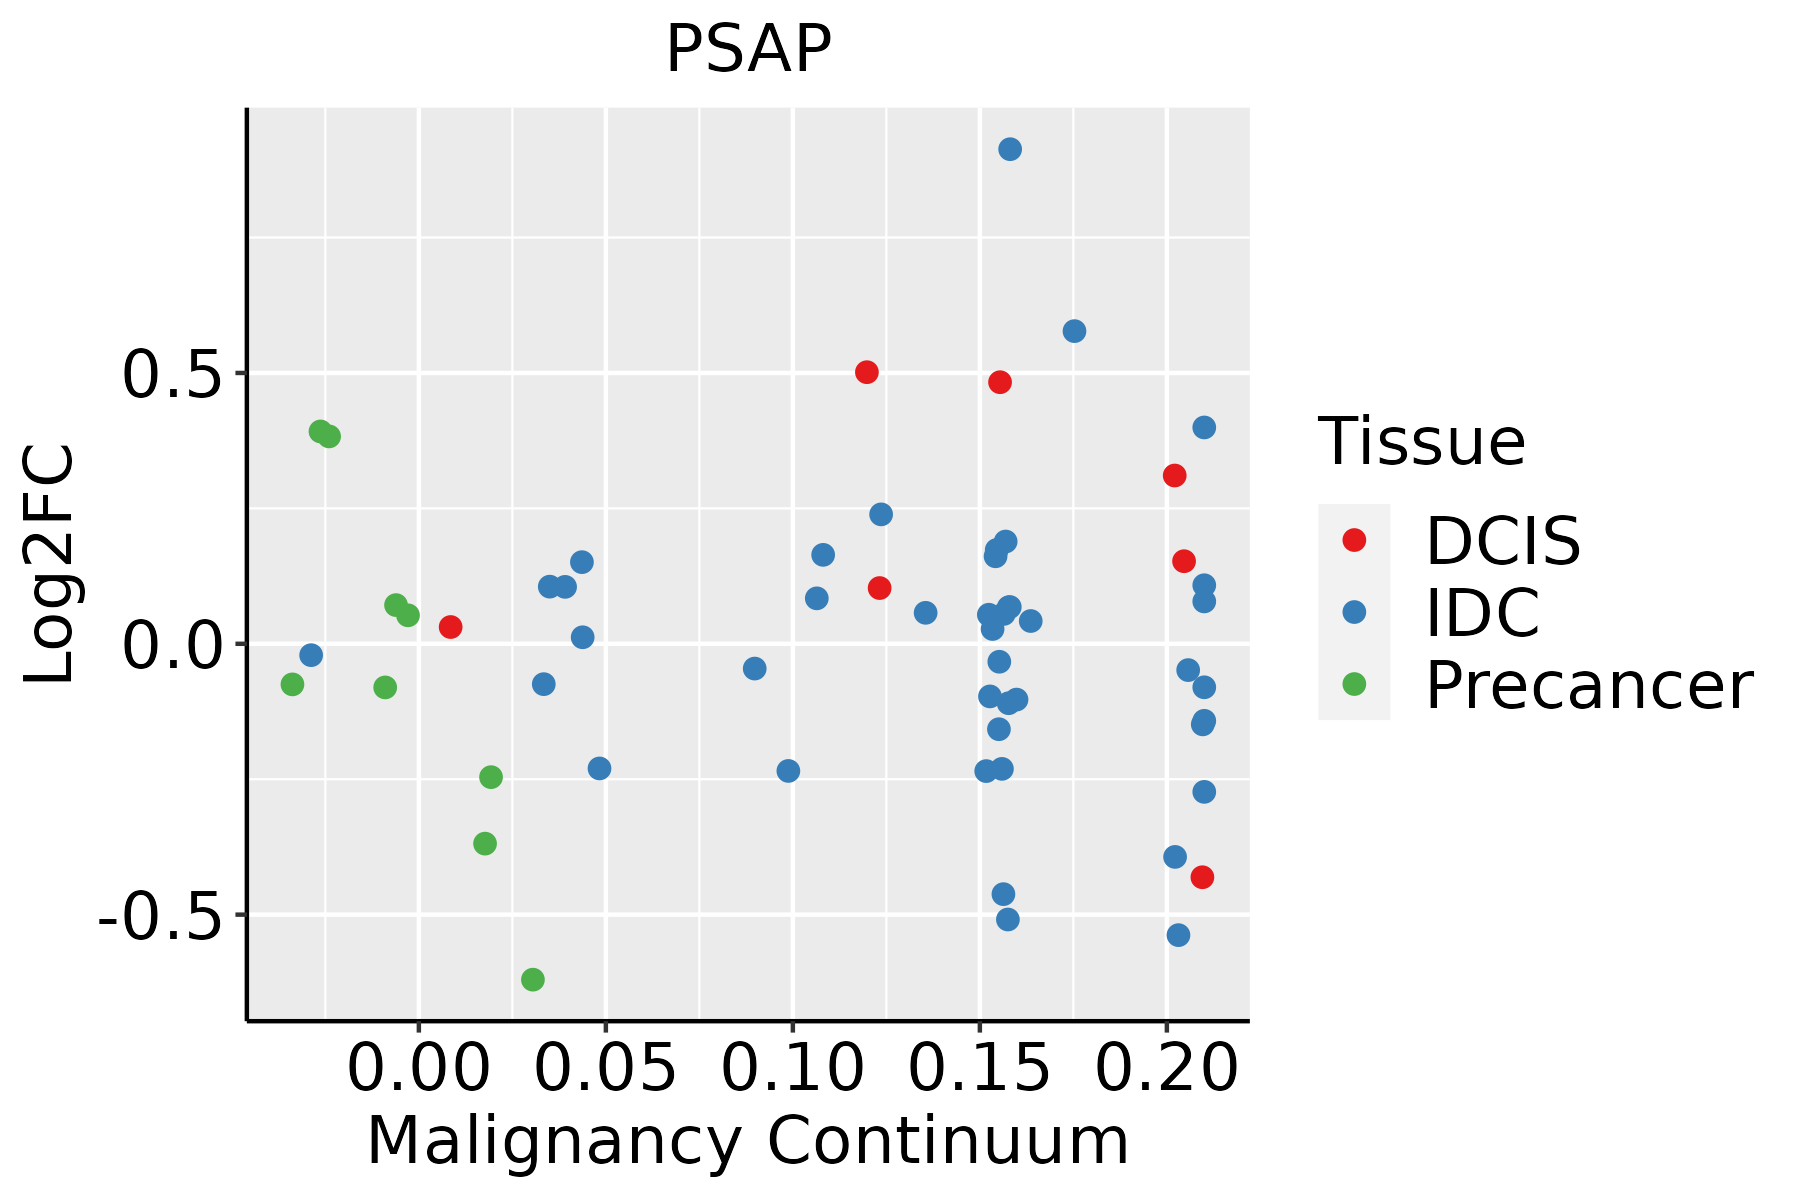 | IDC: Invasive ductal carcinoma |
| DCIS: Ductal carcinoma in situ | ||
| Precancer(BRCA1-mut): Precancerous lesion from BRCA1 mutation carriers | ||
| Cervix | 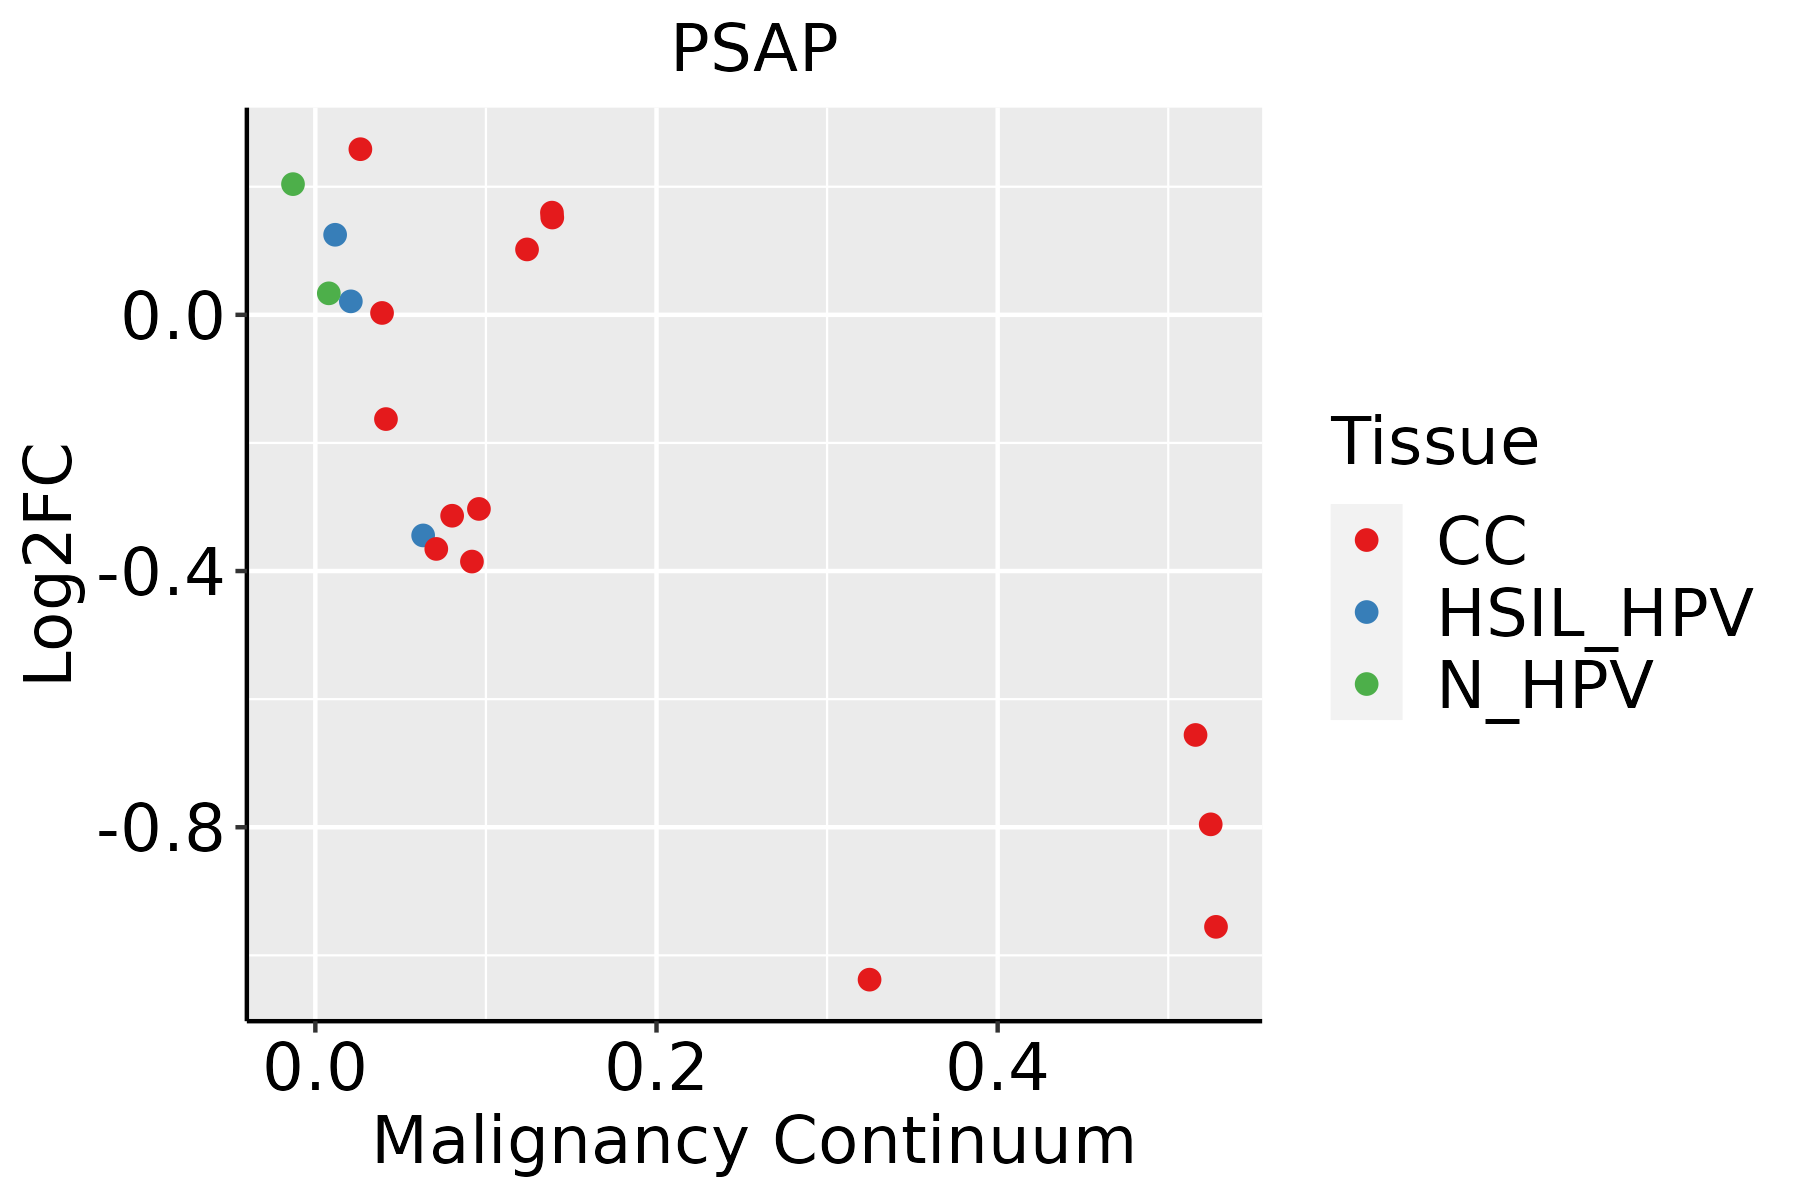 | CC: Cervix cancer |
| HSIL_HPV: HPV-infected high-grade squamous intraepithelial lesions | ||
| N_HPV: HPV-infected normal cervix | ||
| Colorectum (GSE201348) |  | FAP: Familial adenomatous polyposis |
| CRC: Colorectal cancer | ||
| Colorectum (HTA11) |  | AD: Adenomas |
| SER: Sessile serrated lesions | ||
| MSI-H: Microsatellite-high colorectal cancer | ||
| MSS: Microsatellite stable colorectal cancer | ||
| Endometrium |  | AEH: Atypical endometrial hyperplasia |
| EEC: Endometrioid Cancer | ||
| Esophagus | 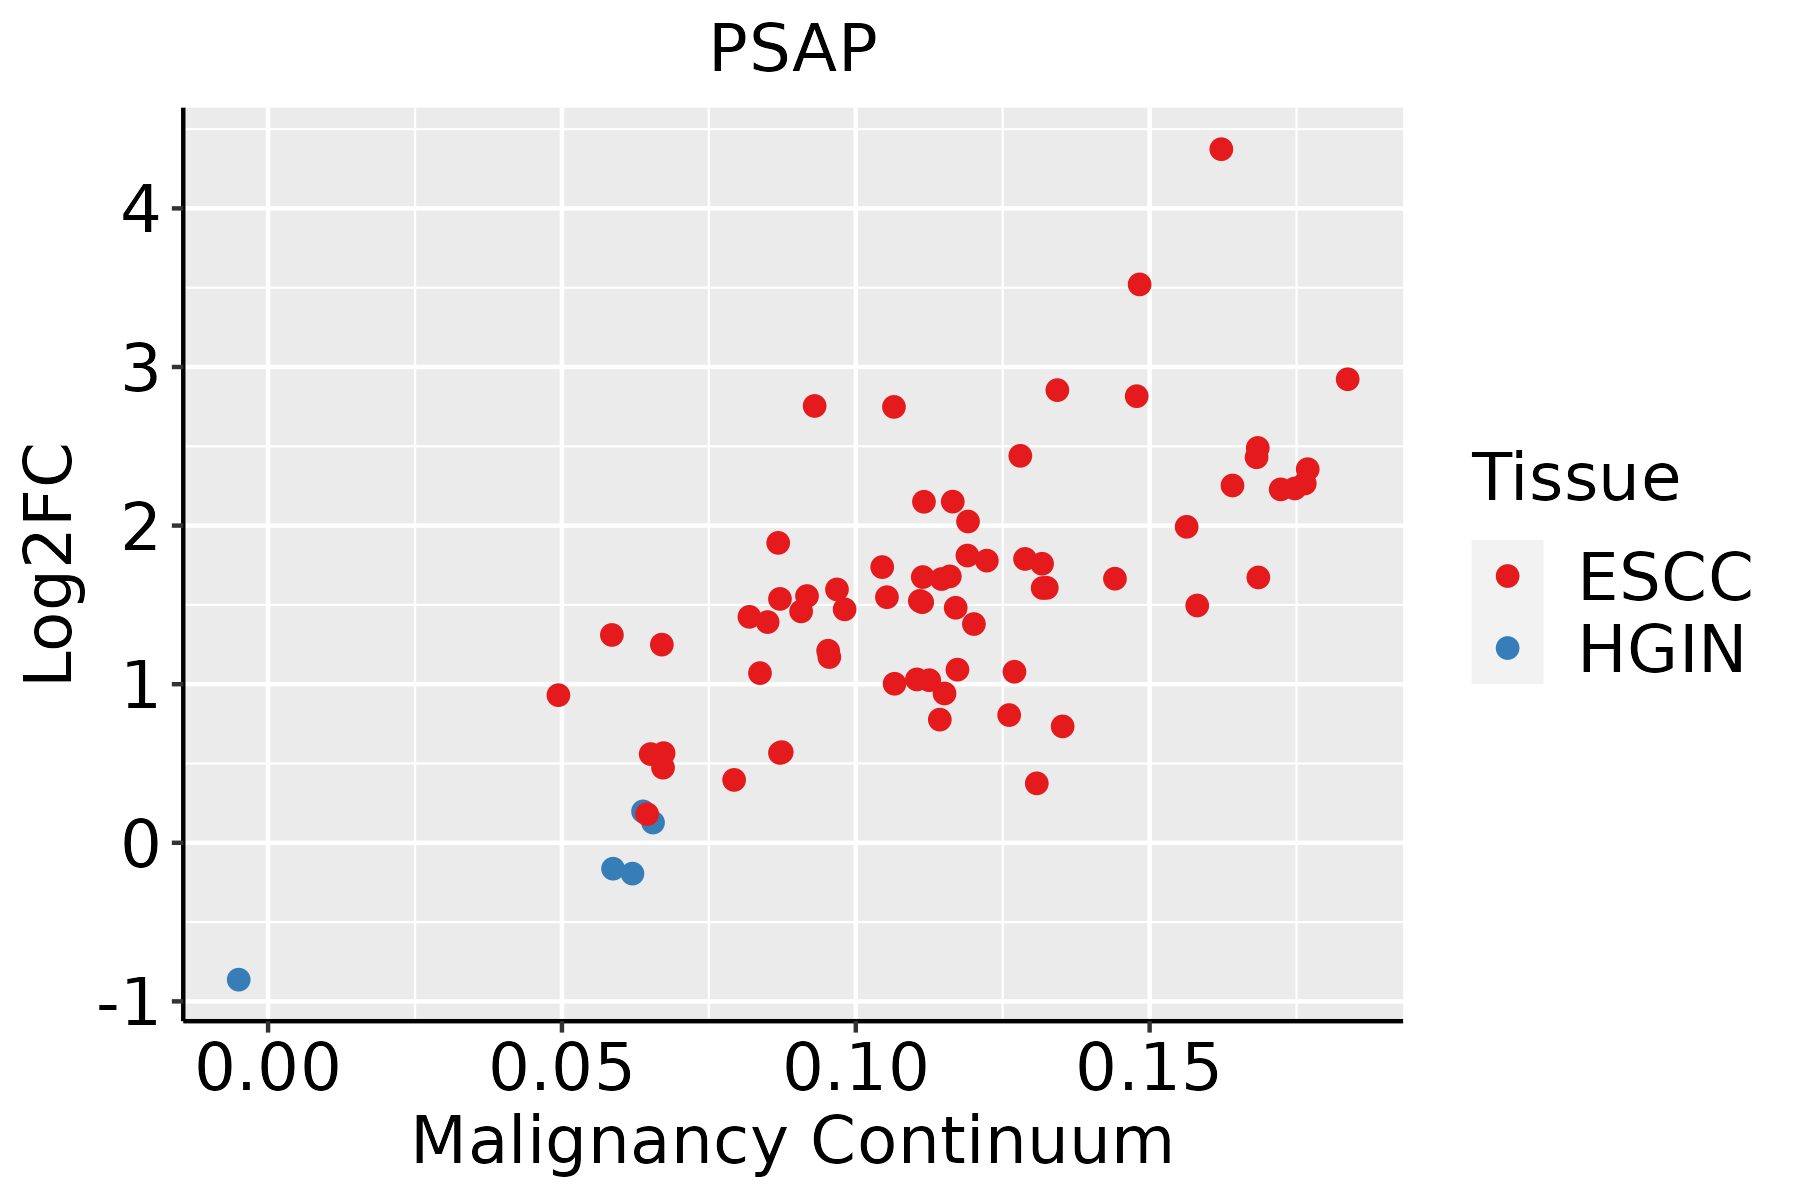 | ESCC: Esophageal squamous cell carcinoma |
| HGIN: High-grade intraepithelial neoplasias | ||
| LGIN: Low-grade intraepithelial neoplasias | ||
| Liver |  | HCC: Hepatocellular carcinoma |
| NAFLD: Non-alcoholic fatty liver disease | ||
| Oral Cavity | 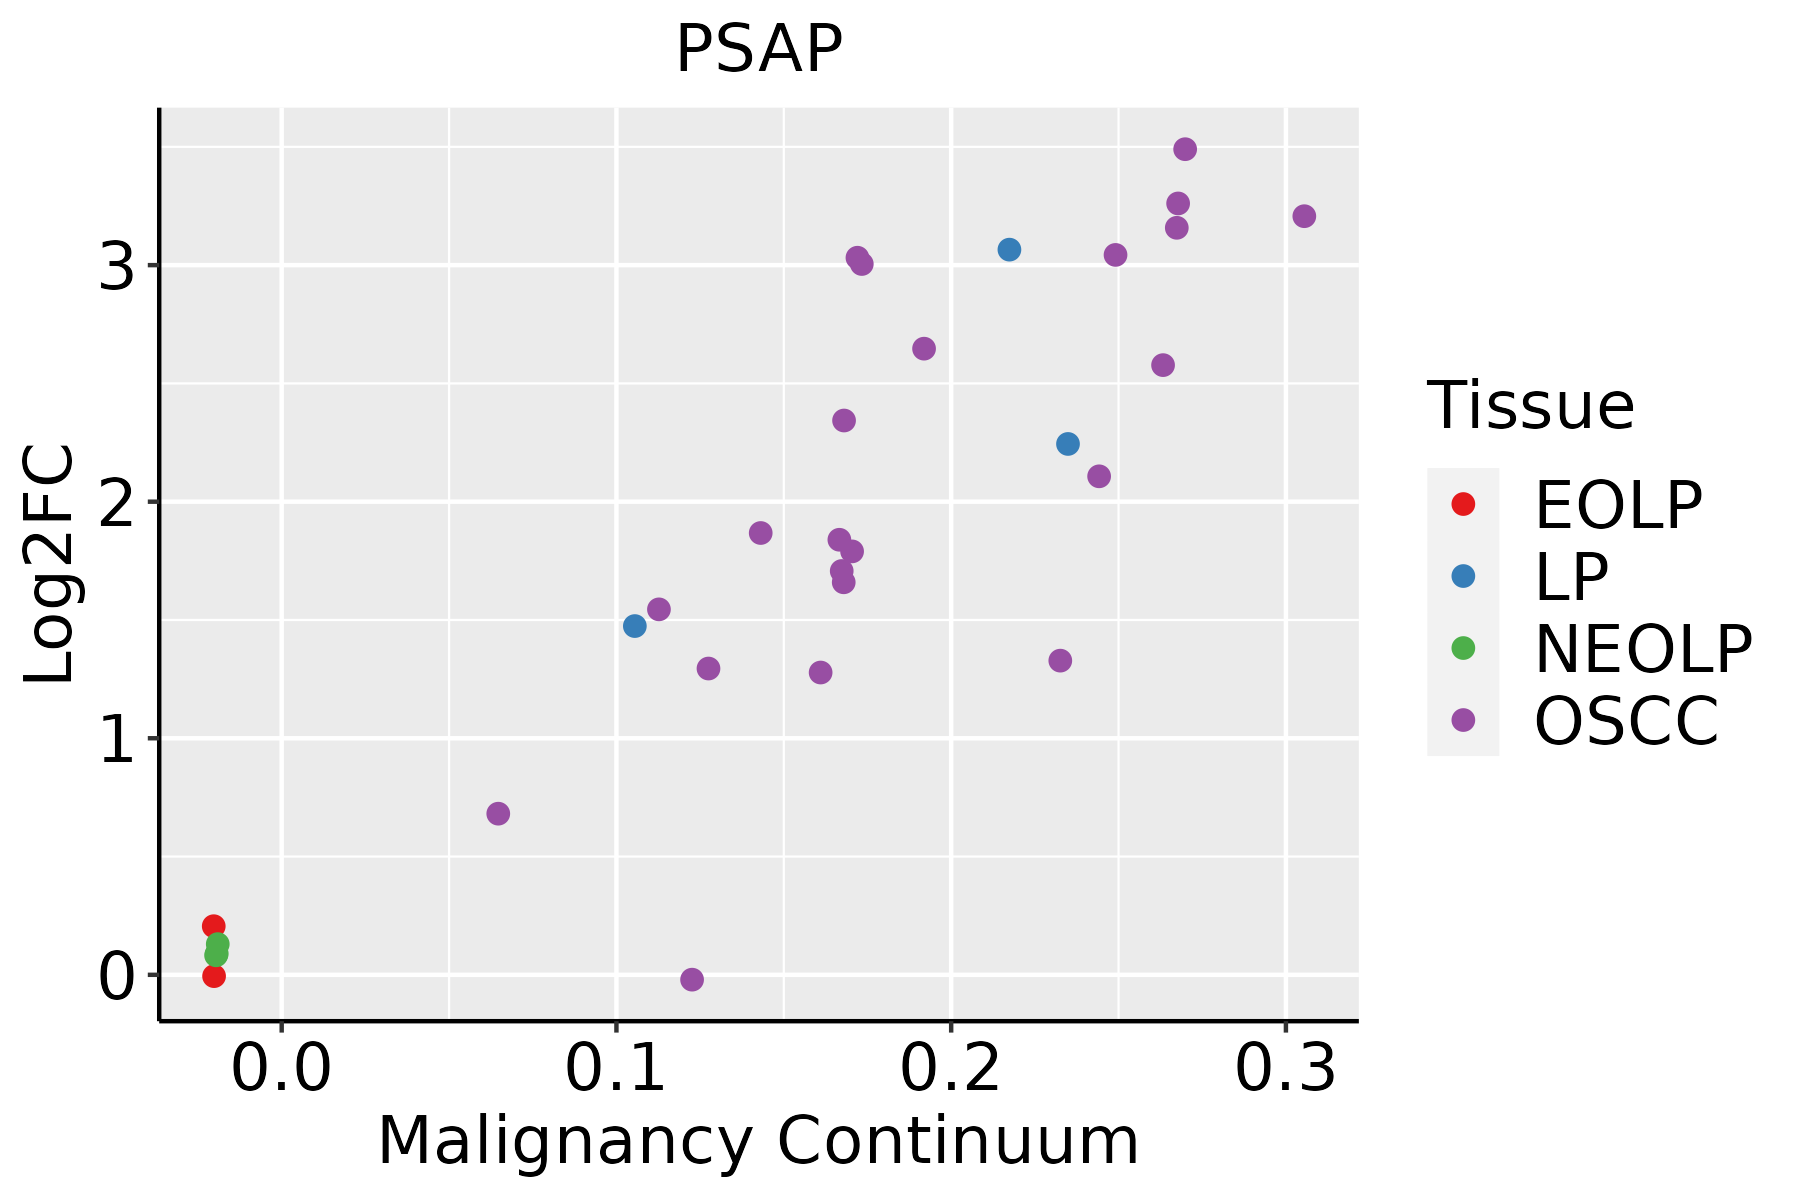 | EOLP: Erosive Oral lichen planus |
| LP: leukoplakia | ||
| NEOLP: Non-erosive oral lichen planus | ||
| OSCC: Oral squamous cell carcinoma | ||
| Prostate | 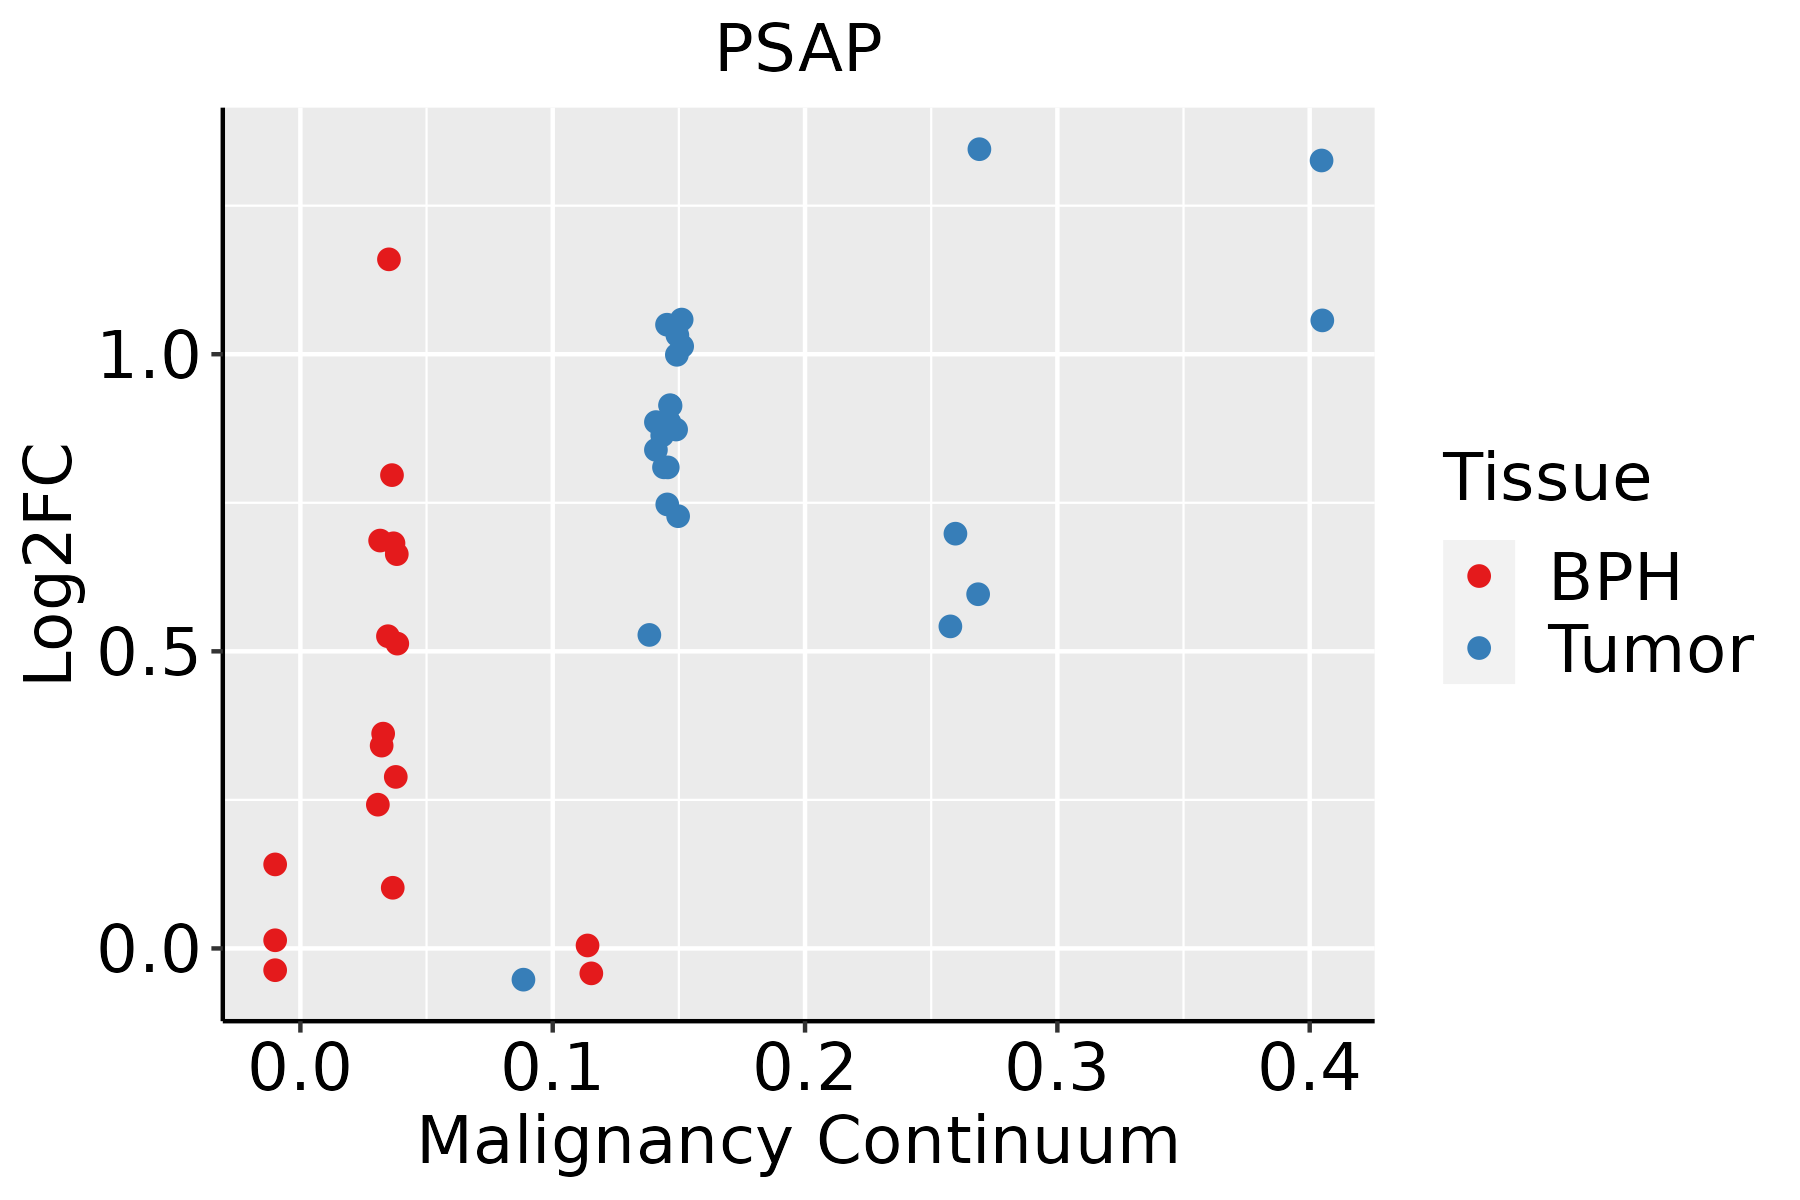 | BPH: Benign Prostatic Hyperplasia |
| Skin | 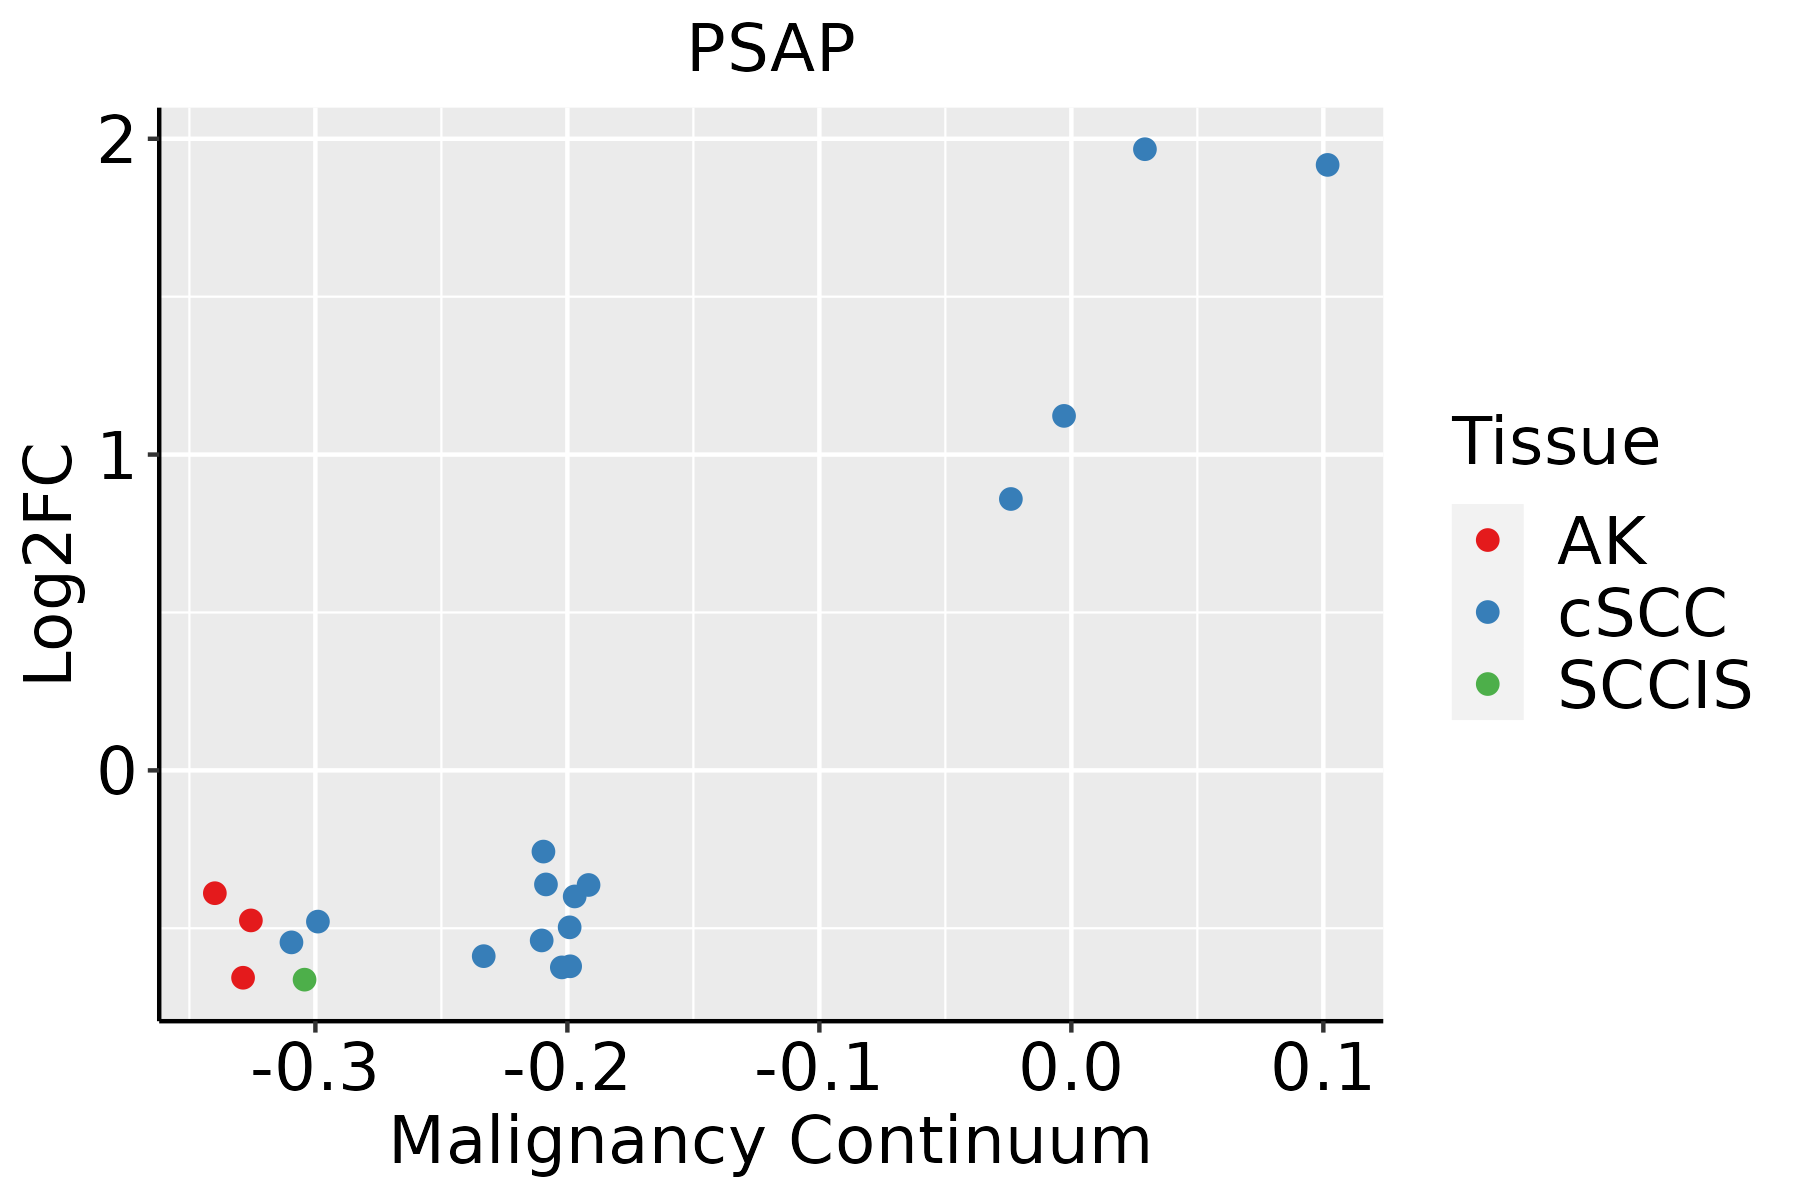 | AK: Actinic keratosis |
| cSCC: Cutaneous squamous cell carcinoma | ||
| SCCIS:squamous cell carcinoma in situ | ||
| Thyroid |  | ATC: Anaplastic thyroid cancer |
| HT: Hashimoto's thyroiditis | ||
| PTC: Papillary thyroid cancer |
| ∗log2FC in expression of this searched gene in stem-like cells from each diseased tissue sample relative to stem-like cells in normal samples in each tissue plotted against the malignancy continuum. Samples are colored based on if they are from different disease stage. |
Top |
Malignant transformation related pathway analysis |
| Find out the enriched GO biological processes and KEGG pathways involved in transition from healthy to precancer to cancer |
| Tissue | Disease Stage | Enriched GO biological Processes |
| Colorectum | AD |  |
| Colorectum | SER |  |
| Colorectum | MSS |  |
| Colorectum | MSI-H |  |
| Colorectum | FAP |  |
| ∗Top 15 enriched GO BP terms are showed in the bar plot of each disease state in each tissue. Each row represents a significant GO biological process which is colored according to the -log10(p.adjust). |
| Page: 1 2 3 4 5 6 7 8 9 |
| GO ID | Tissue | Disease Stage | Description | Gene Ratio | Bg Ratio | pvalue | p.adjust | Count |
| GO:006145831 | Oral cavity | NEOLP | reproductive system development | 91/2005 | 427/18723 | 8.18e-11 | 9.00e-09 | 91 |
| GO:004860831 | Oral cavity | NEOLP | reproductive structure development | 90/2005 | 424/18723 | 1.30e-10 | 1.33e-08 | 90 |
| GO:001050631 | Oral cavity | NEOLP | regulation of autophagy | 60/2005 | 317/18723 | 8.06e-06 | 1.57e-04 | 60 |
| GO:004873232 | Oral cavity | NEOLP | gland development | 76/2005 | 436/18723 | 1.25e-05 | 2.25e-04 | 76 |
| GO:000165514 | Oral cavity | NEOLP | urogenital system development | 58/2005 | 338/18723 | 1.97e-04 | 2.13e-03 | 58 |
| GO:000703431 | Oral cavity | NEOLP | vacuolar transport | 30/2005 | 157/18723 | 1.18e-03 | 8.72e-03 | 30 |
| GO:003085021 | Oral cavity | NEOLP | prostate gland development | 12/2005 | 45/18723 | 2.17e-03 | 1.42e-02 | 12 |
| GO:000704131 | Oral cavity | NEOLP | lysosomal transport | 22/2005 | 114/18723 | 4.42e-03 | 2.49e-02 | 22 |
| GO:003526511 | Oral cavity | NEOLP | organ growth | 30/2005 | 178/18723 | 8.07e-03 | 3.98e-02 | 30 |
| GO:006145810 | Prostate | BPH | reproductive system development | 126/3107 | 427/18723 | 1.35e-11 | 9.95e-10 | 126 |
| GO:004860810 | Prostate | BPH | reproductive structure development | 124/3107 | 424/18723 | 3.76e-11 | 2.43e-09 | 124 |
| GO:004873218 | Prostate | BPH | gland development | 122/3107 | 436/18723 | 1.13e-09 | 5.01e-08 | 122 |
| GO:00105069 | Prostate | BPH | regulation of autophagy | 86/3107 | 317/18723 | 1.29e-06 | 2.24e-05 | 86 |
| GO:00016557 | Prostate | BPH | urogenital system development | 88/3107 | 338/18723 | 6.05e-06 | 8.83e-05 | 88 |
| GO:00308504 | Prostate | BPH | prostate gland development | 19/3107 | 45/18723 | 4.29e-05 | 4.56e-04 | 19 |
| GO:00070349 | Prostate | BPH | vacuolar transport | 46/3107 | 157/18723 | 4.86e-05 | 5.07e-04 | 46 |
| GO:00607422 | Prostate | BPH | epithelial cell differentiation involved in prostate gland development | 7/3107 | 11/18723 | 6.10e-04 | 4.16e-03 | 7 |
| GO:00070417 | Prostate | BPH | lysosomal transport | 32/3107 | 114/18723 | 1.42e-03 | 8.47e-03 | 32 |
| GO:00607363 | Prostate | BPH | prostate gland growth | 6/3107 | 10/18723 | 2.38e-03 | 1.29e-02 | 6 |
| GO:006145816 | Prostate | Tumor | reproductive system development | 133/3246 | 427/18723 | 1.24e-12 | 1.15e-10 | 133 |
| Page: 1 2 3 4 5 6 7 8 9 10 11 12 13 14 15 |
| Pathway ID | Tissue | Disease Stage | Description | Gene Ratio | Bg Ratio | pvalue | p.adjust | qvalue | Count |
| hsa04142 | Colorectum | SER | Lysosome | 38/1580 | 132/8465 | 2.87e-03 | 2.03e-02 | 1.47e-02 | 38 |
| hsa041421 | Colorectum | SER | Lysosome | 38/1580 | 132/8465 | 2.87e-03 | 2.03e-02 | 1.47e-02 | 38 |
| hsa041426 | Esophagus | HGIN | Lysosome | 33/1383 | 132/8465 | 6.65e-03 | 4.37e-02 | 3.47e-02 | 33 |
| hsa0414213 | Esophagus | HGIN | Lysosome | 33/1383 | 132/8465 | 6.65e-03 | 4.37e-02 | 3.47e-02 | 33 |
| hsa0414222 | Esophagus | ESCC | Lysosome | 102/4205 | 132/8465 | 5.11e-11 | 7.13e-10 | 3.65e-10 | 102 |
| hsa006003 | Esophagus | ESCC | Sphingolipid metabolism | 36/4205 | 53/8465 | 5.41e-03 | 1.36e-02 | 6.99e-03 | 36 |
| hsa0414232 | Esophagus | ESCC | Lysosome | 102/4205 | 132/8465 | 5.11e-11 | 7.13e-10 | 3.65e-10 | 102 |
| hsa0060012 | Esophagus | ESCC | Sphingolipid metabolism | 36/4205 | 53/8465 | 5.41e-03 | 1.36e-02 | 6.99e-03 | 36 |
| hsa041424 | Liver | Cirrhotic | Lysosome | 68/2530 | 132/8465 | 1.34e-07 | 1.97e-06 | 1.21e-06 | 68 |
| hsa0414211 | Liver | Cirrhotic | Lysosome | 68/2530 | 132/8465 | 1.34e-07 | 1.97e-06 | 1.21e-06 | 68 |
| hsa041422 | Liver | HCC | Lysosome | 100/4020 | 132/8465 | 2.32e-11 | 4.31e-10 | 2.40e-10 | 100 |
| hsa00600 | Liver | HCC | Sphingolipid metabolism | 34/4020 | 53/8465 | 1.06e-02 | 2.71e-02 | 1.51e-02 | 34 |
| hsa041423 | Liver | HCC | Lysosome | 100/4020 | 132/8465 | 2.32e-11 | 4.31e-10 | 2.40e-10 | 100 |
| hsa006001 | Liver | HCC | Sphingolipid metabolism | 34/4020 | 53/8465 | 1.06e-02 | 2.71e-02 | 1.51e-02 | 34 |
| hsa041425 | Oral cavity | OSCC | Lysosome | 87/3704 | 132/8465 | 1.97e-07 | 1.35e-06 | 6.86e-07 | 87 |
| hsa006002 | Oral cavity | OSCC | Sphingolipid metabolism | 33/3704 | 53/8465 | 5.00e-03 | 1.20e-02 | 6.13e-03 | 33 |
| hsa0414212 | Oral cavity | OSCC | Lysosome | 87/3704 | 132/8465 | 1.97e-07 | 1.35e-06 | 6.86e-07 | 87 |
| hsa0060011 | Oral cavity | OSCC | Sphingolipid metabolism | 33/3704 | 53/8465 | 5.00e-03 | 1.20e-02 | 6.13e-03 | 33 |
| hsa0414221 | Oral cavity | LP | Lysosome | 67/2418 | 132/8465 | 5.13e-08 | 7.77e-07 | 5.01e-07 | 67 |
| hsa0414231 | Oral cavity | LP | Lysosome | 67/2418 | 132/8465 | 5.13e-08 | 7.77e-07 | 5.01e-07 | 67 |
| Page: 1 |
Top |
Cell-cell communication analysis |
| Identification of potential cell-cell interactions between two cell types and their ligand-receptor pairs for different disease states |
| Ligand | Receptor | LRpair | Pathway | Tissue | Disease Stage |
| PSAP | GPR37L1 | PSAP_GPR37L1 | PSAP | HNSCC | Precancer |
| Page: 1 |
Top |
Single-cell gene regulatory network inference analysis |
| Find out the significant the regulons (TFs) and the target genes of each regulon across cell types for different disease states |
| TF | Cell Type | Tissue | Disease Stage | Target Gene | RSS | Regulon Activity |
| ∗The dot plots of a searched regulon are shown for all cell subpopulations in each disease state of each tissue based on the regulon specific score inferred using pySCENIC and by calculating the average expression. |
| Page: 1 |
Top |
Somatic mutation of malignant transformation related genes |
| Annotation of somatic variants for genes involved in malignant transformation |
| Hugo Symbol | Variant Class | Variant Classification | dbSNP RS | HGVSc | HGVSp | HGVSp Short | SWISSPROT | BIOTYPE | SIFT | PolyPhen | Tumor Sample Barcode | Tissue | Histology | Sex | Age | Stage | Therapy Types | Drugs | Outcome |
| PSAP | insertion | Nonsense_Mutation | novel | c.449_450insGTAGGGCGTTCAGACAACATCCTTCTCTTTTTTC | p.His150GlnfsTer2 | p.H150Qfs*2 | P07602 | protein_coding | TCGA-A8-A07R-01 | Breast | breast invasive carcinoma | Female | >=65 | III/IV | Ancillary | zoledronic | SD | ||
| PSAP | insertion | Nonsense_Mutation | novel | c.169_170insGGTGAGC | p.Thr57ArgfsTer2 | p.T57Rfs*2 | P07602 | protein_coding | TCGA-A8-A09D-01 | Breast | breast invasive carcinoma | Female | <65 | I/II | Chemotherapy | doxorubicin | CR | ||
| PSAP | insertion | Frame_Shift_Ins | novel | c.1474_1475insTGGCCACGTGTTCCCTGTTTTTAAGTGAGATCCTGTCCTGGGT | p.Thr492MetfsTer16 | p.T492Mfs*16 | P07602 | protein_coding | TCGA-AO-A0JB-01 | Breast | breast invasive carcinoma | Female | <65 | III/IV | Chemotherapy | cyclophosphamide | SD | ||
| PSAP | insertion | Nonsense_Mutation | novel | c.604_605insGCTGAGGGTTTCTCTCTGACTTTCC | p.Ile202SerfsTer2 | p.I202Sfs*2 | P07602 | protein_coding | TCGA-BH-A0BR-01 | Breast | breast invasive carcinoma | Female | <65 | I/II | Unknown | Unknown | SD | ||
| PSAP | insertion | Frame_Shift_Ins | novel | c.1480_1481insTTTCTGTGTCCTTTATTGT | p.Lys494IlefsTer62 | p.K494Ifs*62 | P07602 | protein_coding | TCGA-BH-A0HF-01 | Breast | breast invasive carcinoma | Female | >=65 | I/II | Hormone Therapy | arimidex | SD | ||
| PSAP | insertion | Frame_Shift_Ins | novel | c.921_922insGGACACCCCCAGAGCTGGACCTGTGT | p.Pro308GlyfsTer24 | p.P308Gfs*24 | P07602 | protein_coding | TCGA-BH-A0HF-01 | Breast | breast invasive carcinoma | Female | >=65 | I/II | Hormone Therapy | arimidex | SD | ||
| PSAP | SNV | Missense_Mutation | c.916N>A | p.Glu306Lys | p.E306K | P07602 | protein_coding | tolerated(0.88) | benign(0.003) | TCGA-Q1-A73O-01 | Cervix | cervical & endocervical cancer | Female | <65 | I/II | Chemotherapy | cisplatin | CR | |
| PSAP | SNV | Missense_Mutation | rs753606836 | c.415N>A | p.Glu139Lys | p.E139K | P07602 | protein_coding | tolerated(0.5) | benign(0.046) | TCGA-AA-3510-01 | Colorectum | colon adenocarcinoma | Male | >=65 | I/II | Unknown | Unknown | SD |
| PSAP | SNV | Missense_Mutation | rs756281426 | c.926C>T | p.Ala309Val | p.A309V | P07602 | protein_coding | tolerated(0.42) | benign(0.009) | TCGA-AZ-6598-01 | Colorectum | colon adenocarcinoma | Female | >=65 | I/II | Unknown | Unknown | SD |
| PSAP | SNV | Missense_Mutation | rs545627914 | c.1559N>A | p.Arg520His | p.R520H | P07602 | protein_coding | tolerated(0.06) | possibly_damaging(0.88) | TCGA-D5-6531-01 | Colorectum | colon adenocarcinoma | Male | >=65 | I/II | Unknown | Unknown | SD |
| Page: 1 2 3 4 5 6 7 |
Top |
Related drugs of malignant transformation related genes |
| Identification of chemicals and drugs interact with genes involved in malignant transfromation |
| (DGIdb 4.0) |
| Entrez ID | Symbol | Category | Interaction Types | Drug Claim Name | Drug Name | PMIDs |
| Page: 1 |

Copyright 2023-Present -The University of Texas Health Science Center at Houston |