| Tissue | Expression Dynamics | Abbreviation |
| Cervix | 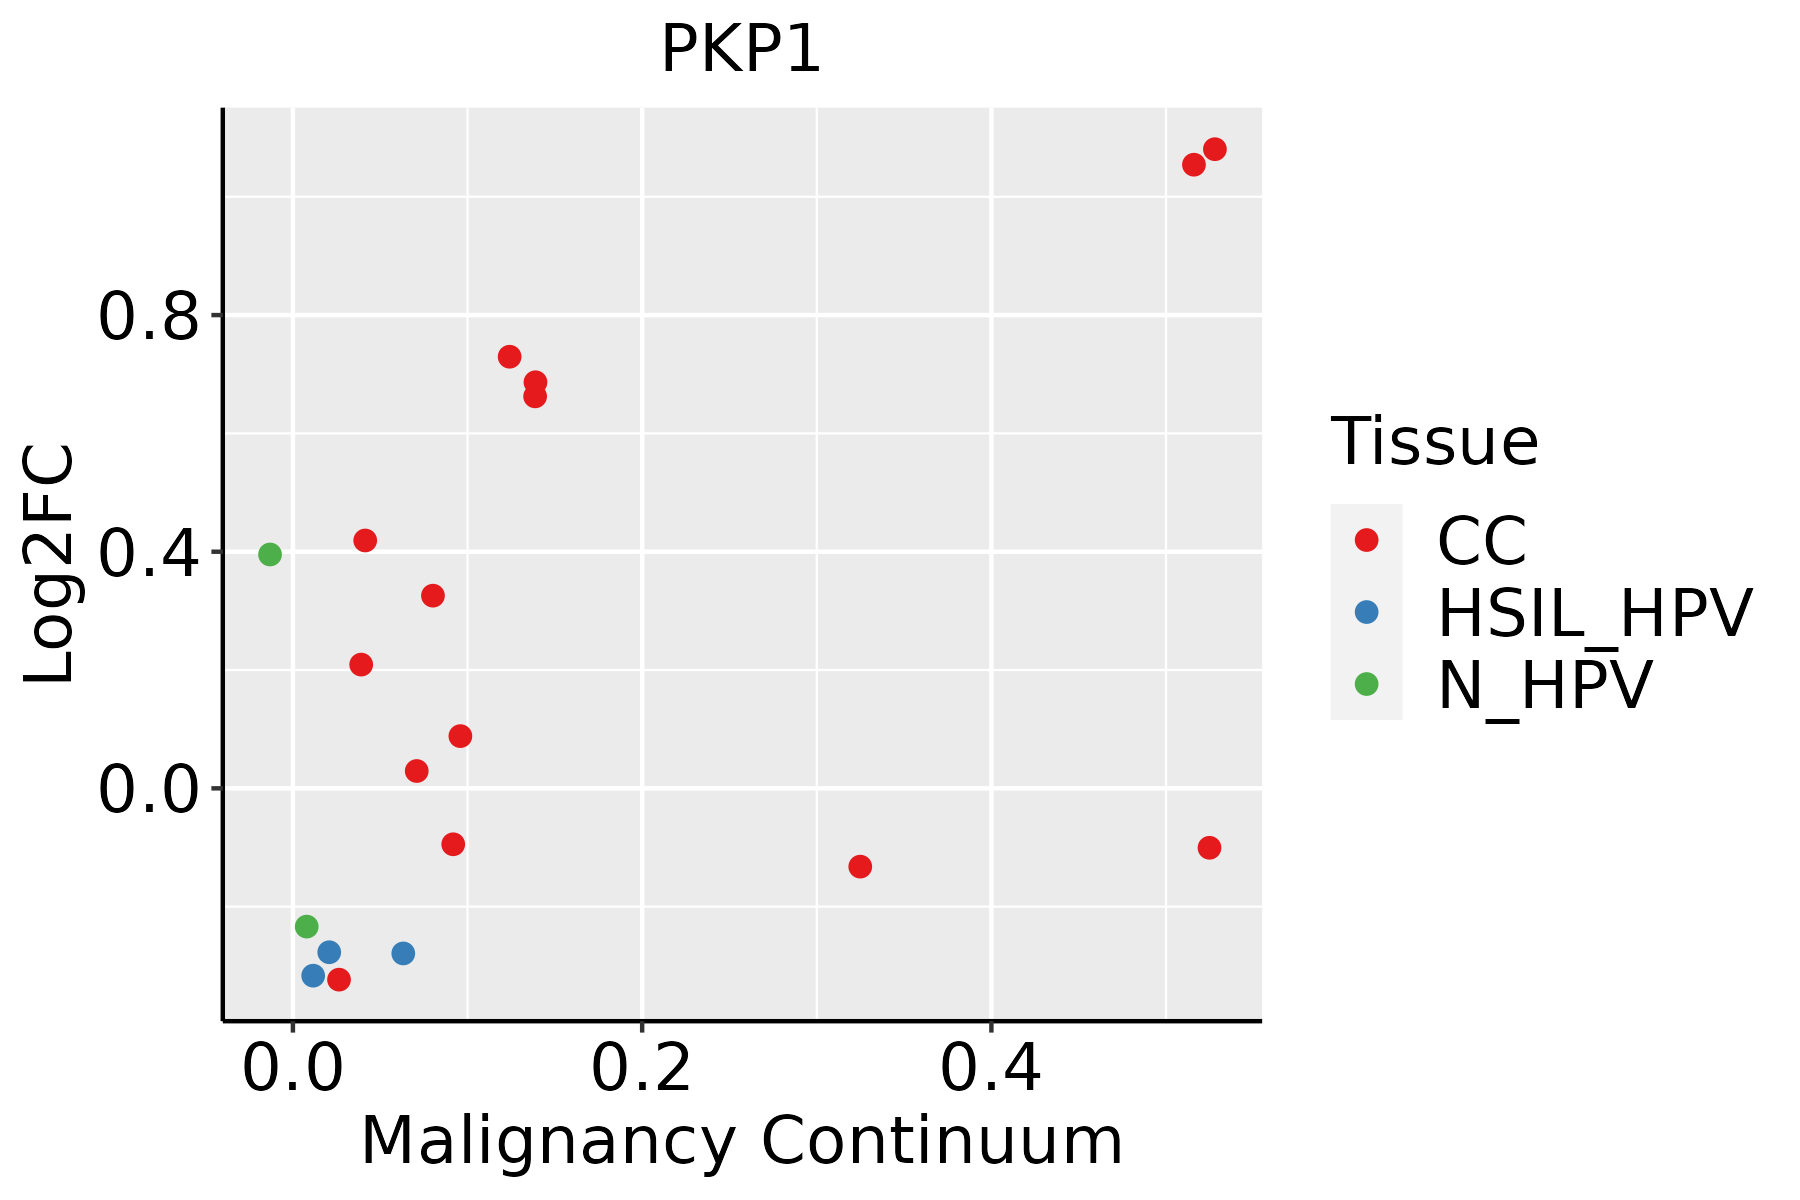 | CC: Cervix cancer |
| HSIL_HPV: HPV-infected high-grade squamous intraepithelial lesions |
| N_HPV: HPV-infected normal cervix |
| Esophagus |  | ESCC: Esophageal squamous cell carcinoma |
| HGIN: High-grade intraepithelial neoplasias |
| LGIN: Low-grade intraepithelial neoplasias |
| Oral Cavity | 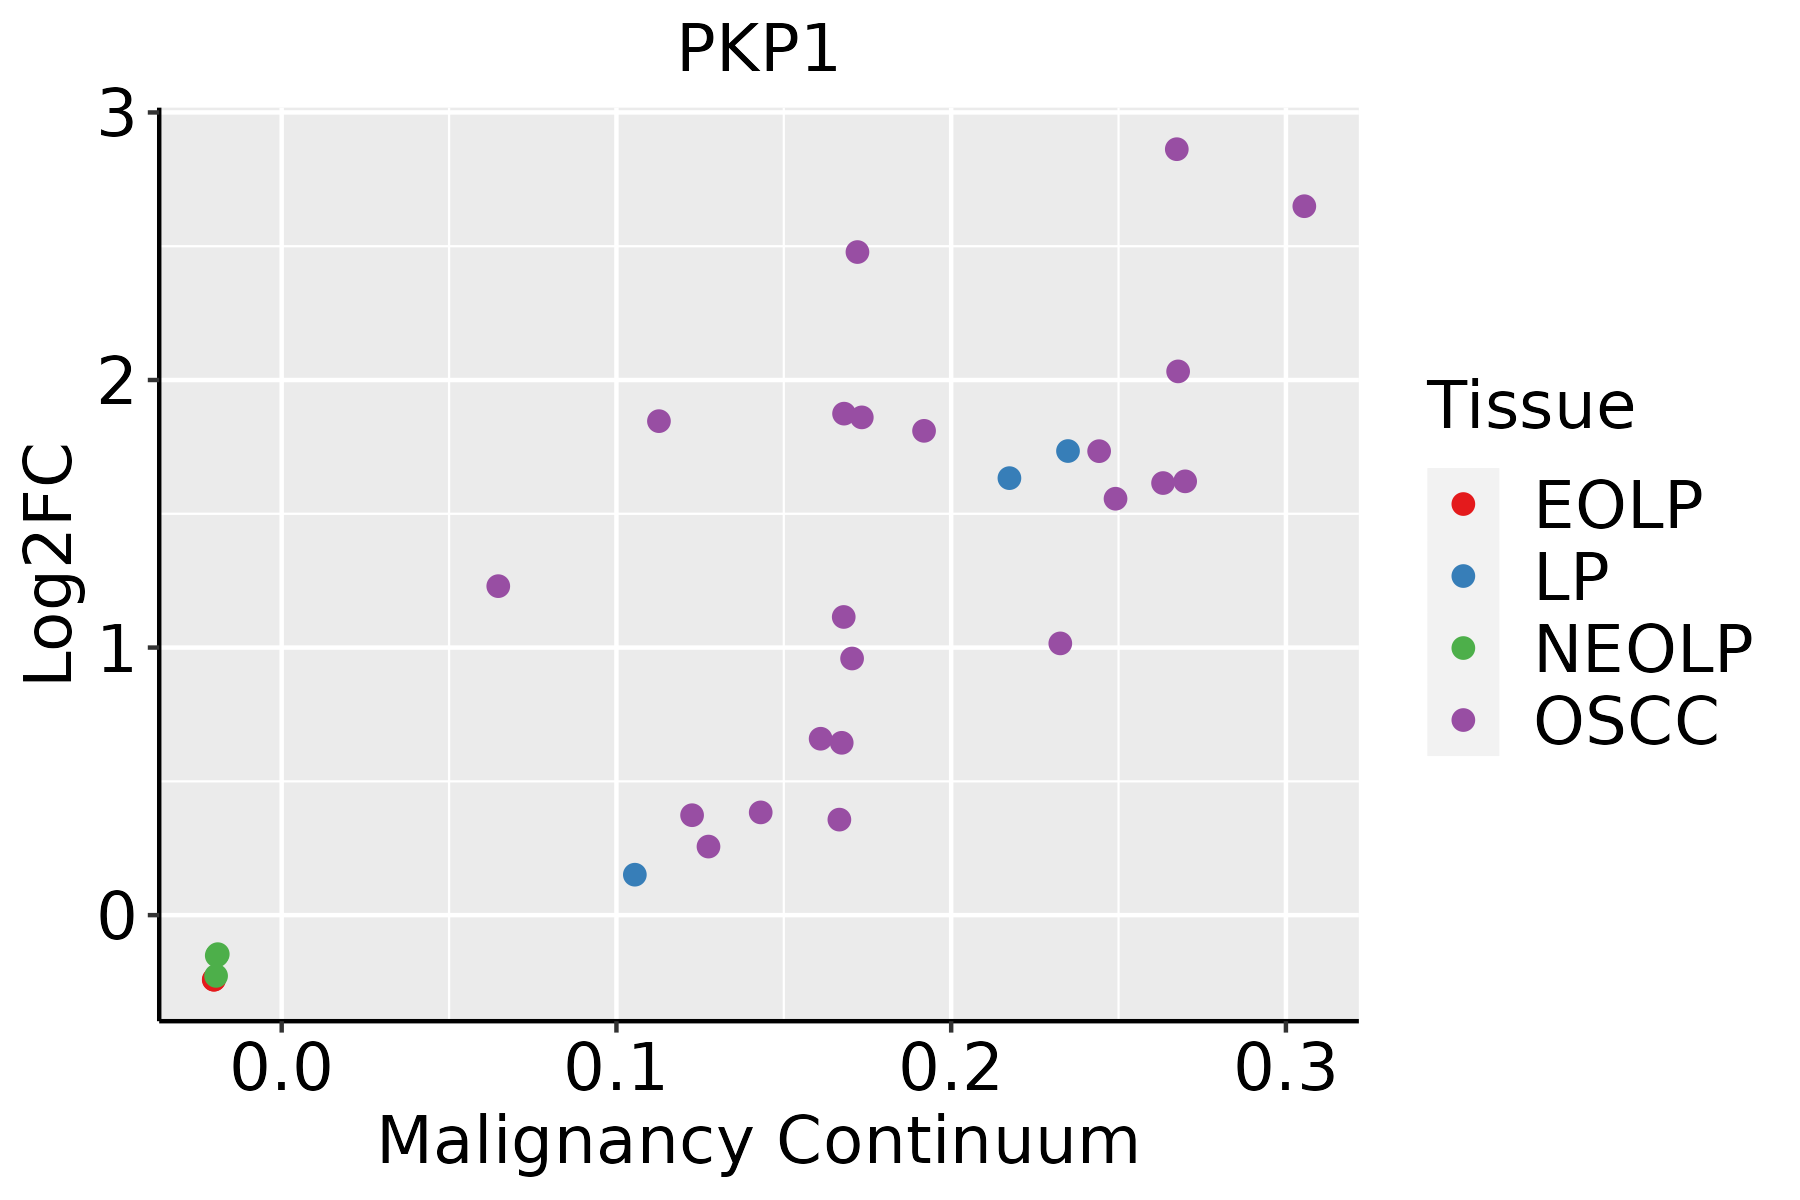 | EOLP: Erosive Oral lichen planus |
| LP: leukoplakia |
| NEOLP: Non-erosive oral lichen planus |
| OSCC: Oral squamous cell carcinoma |
| Prostate | 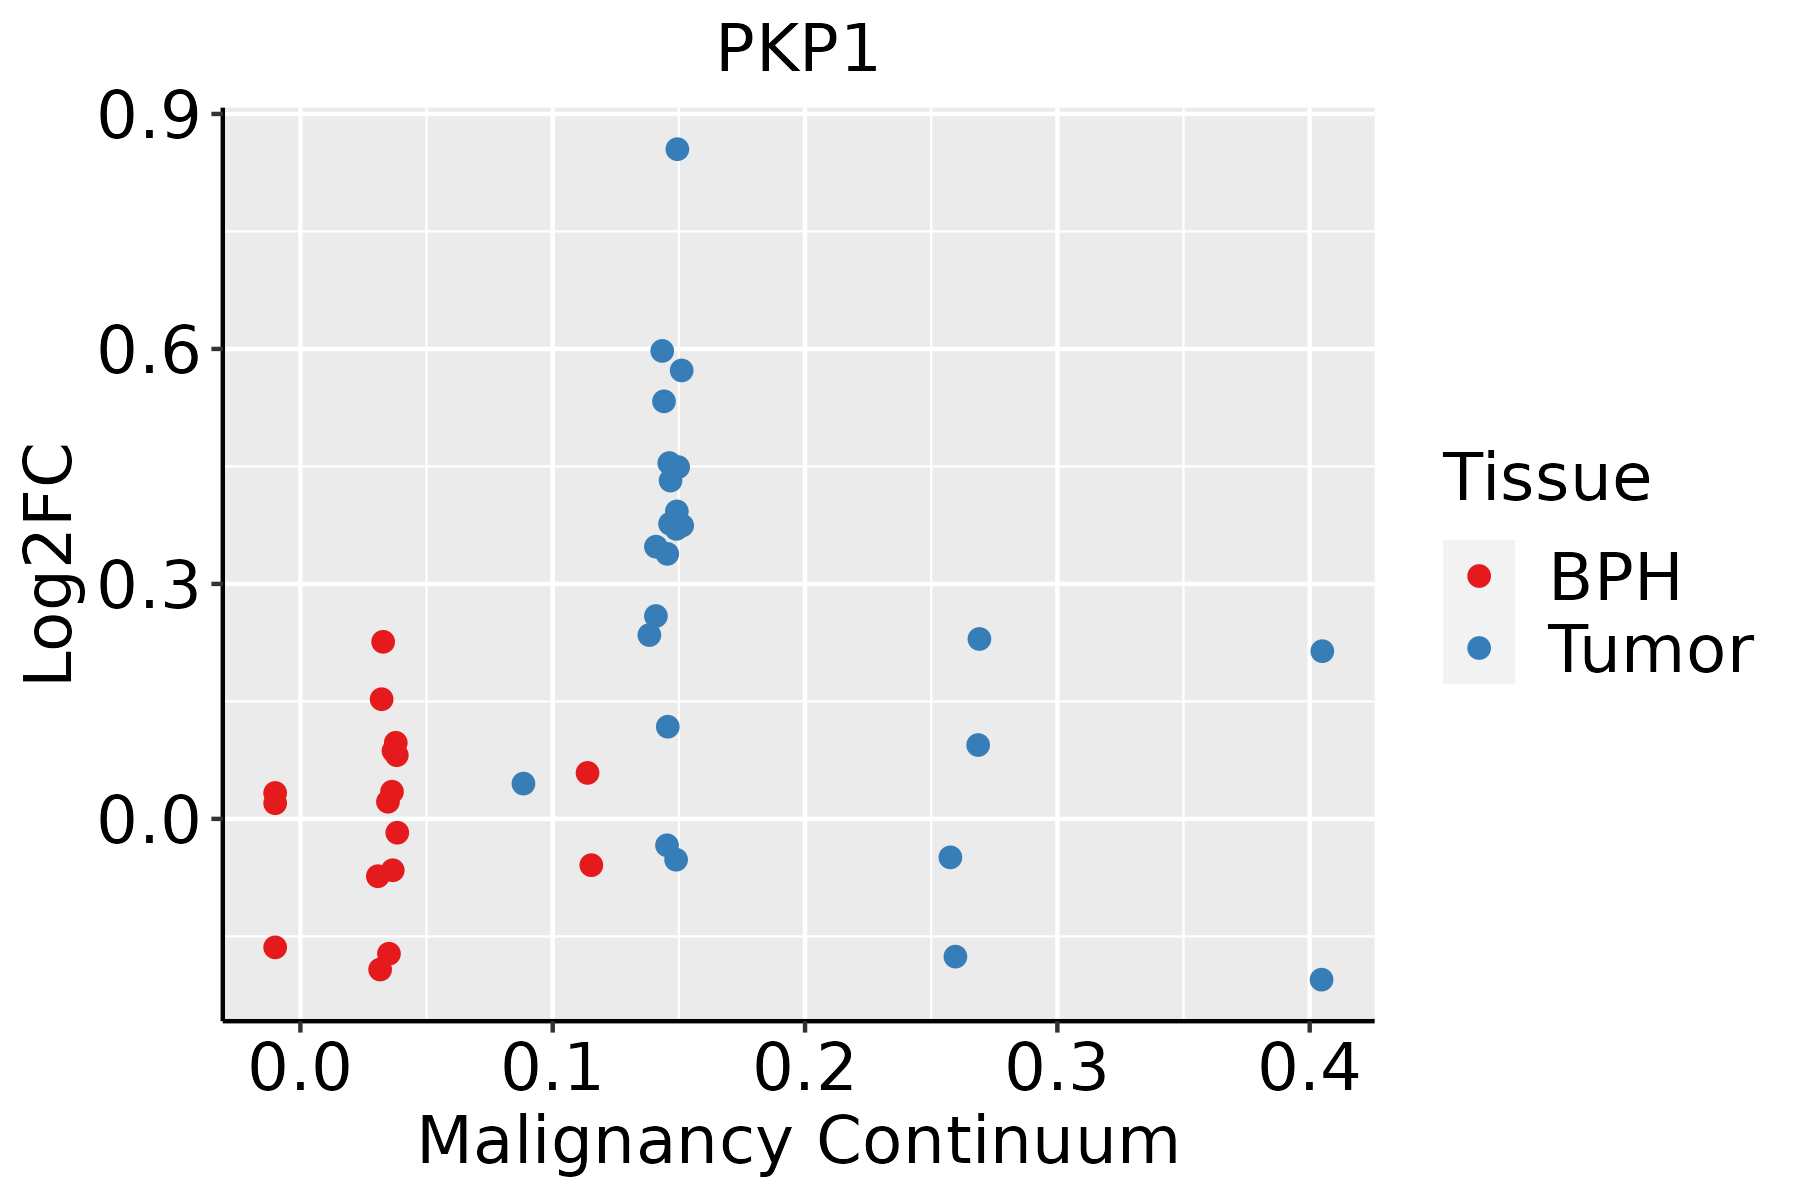 | BPH: Benign Prostatic Hyperplasia |
| Skin |  | AK: Actinic keratosis |
| cSCC: Cutaneous squamous cell carcinoma |
| SCCIS:squamous cell carcinoma in situ |
| Thyroid | 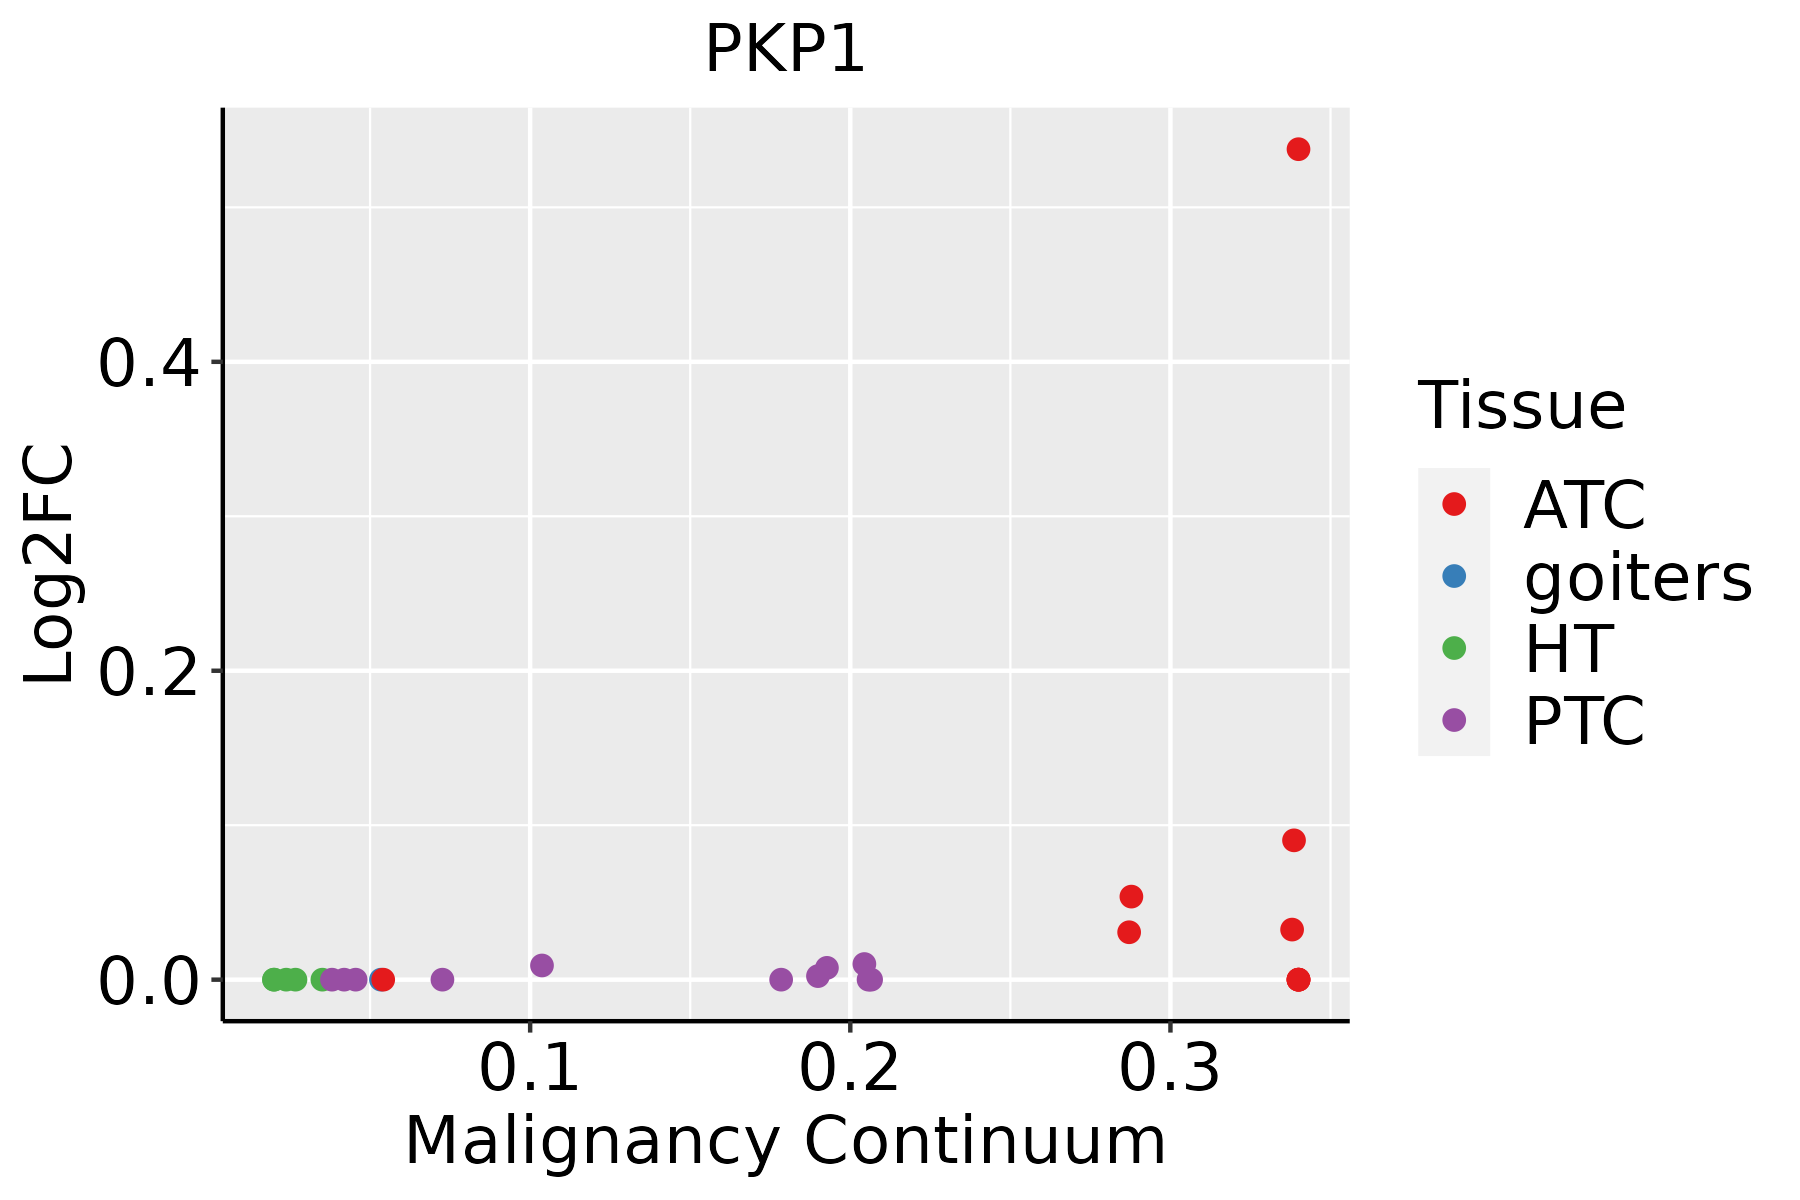 | ATC: Anaplastic thyroid cancer |
| HT: Hashimoto's thyroiditis |
| PTC: Papillary thyroid cancer |
| GO ID | Tissue | Disease Stage | Description | Gene Ratio | Bg Ratio | pvalue | p.adjust | Count |
| GO:00451045 | Skin | AK | intermediate filament cytoskeleton organization | 14/1910 | 51/18723 | 4.29e-04 | 4.05e-03 | 14 |
| GO:00451036 | Skin | AK | intermediate filament-based process | 14/1910 | 52/18723 | 5.32e-04 | 4.84e-03 | 14 |
| GO:004670019 | Skin | AK | heterocycle catabolic process | 64/1910 | 445/18723 | 3.01e-03 | 1.88e-02 | 64 |
| GO:004427020 | Skin | AK | cellular nitrogen compound catabolic process | 64/1910 | 451/18723 | 4.11e-03 | 2.41e-02 | 64 |
| GO:001943919 | Skin | AK | aromatic compound catabolic process | 65/1910 | 467/18723 | 5.99e-03 | 3.24e-02 | 65 |
| GO:190136119 | Skin | AK | organic cyclic compound catabolic process | 67/1910 | 495/18723 | 9.91e-03 | 4.80e-02 | 67 |
| GO:190331126 | Skin | cSCC | regulation of mRNA metabolic process | 162/4864 | 288/18723 | 5.90e-28 | 2.46e-25 | 162 |
| GO:0006401111 | Skin | cSCC | RNA catabolic process | 133/4864 | 278/18723 | 2.71e-15 | 2.23e-13 | 133 |
| GO:0006402111 | Skin | cSCC | mRNA catabolic process | 115/4864 | 232/18723 | 9.01e-15 | 6.57e-13 | 115 |
| GO:0034655111 | Skin | cSCC | nucleobase-containing compound catabolic process | 172/4864 | 407/18723 | 4.11e-13 | 2.43e-11 | 172 |
| GO:0046700110 | Skin | cSCC | heterocycle catabolic process | 178/4864 | 445/18723 | 4.45e-11 | 2.13e-09 | 178 |
| GO:0044270110 | Skin | cSCC | cellular nitrogen compound catabolic process | 179/4864 | 451/18723 | 8.34e-11 | 3.79e-09 | 179 |
| GO:0019439110 | Skin | cSCC | aromatic compound catabolic process | 183/4864 | 467/18723 | 1.76e-10 | 7.68e-09 | 183 |
| GO:003133028 | Skin | cSCC | negative regulation of cellular catabolic process | 115/4864 | 262/18723 | 2.03e-10 | 8.72e-09 | 115 |
| GO:000989527 | Skin | cSCC | negative regulation of catabolic process | 133/4864 | 320/18723 | 6.99e-10 | 2.77e-08 | 133 |
| GO:0061013110 | Skin | cSCC | regulation of mRNA catabolic process | 79/4864 | 166/18723 | 1.57e-09 | 5.92e-08 | 79 |
| GO:1901361110 | Skin | cSCC | organic cyclic compound catabolic process | 188/4864 | 495/18723 | 1.92e-09 | 7.01e-08 | 188 |
| GO:190331228 | Skin | cSCC | negative regulation of mRNA metabolic process | 47/4864 | 92/18723 | 2.24e-07 | 4.77e-06 | 47 |
| GO:190236918 | Skin | cSCC | negative regulation of RNA catabolic process | 33/4864 | 75/18723 | 5.35e-04 | 3.97e-03 | 33 |
| GO:004510423 | Skin | cSCC | intermediate filament cytoskeleton organization | 24/4864 | 51/18723 | 9.43e-04 | 6.42e-03 | 24 |
| Hugo Symbol | Variant Class | Variant Classification | dbSNP RS | HGVSc | HGVSp | HGVSp Short | SWISSPROT | BIOTYPE | SIFT | PolyPhen | Tumor Sample Barcode | Tissue | Histology | Sex | Age | Stage | Therapy Types | Drugs | Outcome |
| PKP1 | SNV | Missense_Mutation | | c.1309N>A | p.Ala437Thr | p.A437T | Q13835 | protein_coding | deleterious(0.01) | possibly_damaging(0.505) | TCGA-A8-A09Z-01 | Breast | breast invasive carcinoma | Female | >=65 | I/II | Unknown | Unknown | SD |
| PKP1 | SNV | Missense_Mutation | | c.1600N>C | p.Glu534Gln | p.E534Q | Q13835 | protein_coding | tolerated(0.18) | benign(0.424) | TCGA-BH-A0DZ-01 | Breast | breast invasive carcinoma | Female | <65 | I/II | Chemotherapy | docetaxel | SD |
| PKP1 | SNV | Missense_Mutation | | c.1738N>T | p.Gly580Trp | p.G580W | Q13835 | protein_coding | deleterious(0) | probably_damaging(0.999) | TCGA-BH-A0E9-01 | Breast | breast invasive carcinoma | Female | <65 | I/II | Chemotherapy | taxotere | CR |
| PKP1 | SNV | Missense_Mutation | | c.547N>T | p.Arg183Cys | p.R183C | Q13835 | protein_coding | deleterious(0) | benign(0.306) | TCGA-BH-A0HA-01 | Breast | breast invasive carcinoma | Female | <65 | I/II | Unknown | Unknown | SD |
| PKP1 | SNV | Missense_Mutation | rs781340038 | c.548N>A | p.Arg183His | p.R183H | Q13835 | protein_coding | deleterious(0.03) | benign(0) | TCGA-BH-A0HA-01 | Breast | breast invasive carcinoma | Female | <65 | I/II | Unknown | Unknown | SD |
| PKP1 | SNV | Missense_Mutation | rs751817941 | c.1454G>A | p.Arg485His | p.R485H | Q13835 | protein_coding | tolerated(0.06) | benign(0.067) | TCGA-E9-A1NC-01 | Breast | breast invasive carcinoma | Female | <65 | I/II | Chemotherapy | doxorubicin | CR |
| PKP1 | insertion | In_Frame_Ins | novel | c.1880_1881insAGGGGAAATGAGACTTCCCTCTCTCCACCCATCTGG | p.Leu627_Leu628insGlyGluMetArgLeuProSerLeuHisProSerGly | p.L627_L628insGEMRLPSLHPSG | Q13835 | protein_coding | | | TCGA-AN-A0FK-01 | Breast | breast invasive carcinoma | Female | >=65 | III/IV | Unknown | Unknown | SD |
| PKP1 | deletion | Frame_Shift_Del | novel | c.1740delG | p.Leu581Ter | p.L581* | Q13835 | protein_coding | | | TCGA-D8-A27V-01 | Breast | breast invasive carcinoma | Female | <65 | I/II | Hormone Therapy | tamoxiphen | SD |
| PKP1 | deletion | Frame_Shift_Del | novel | c.2172delA | p.Gly725ValfsTer10 | p.G725Vfs*10 | Q13835 | protein_coding | | | TCGA-D8-A27V-01 | Breast | breast invasive carcinoma | Female | <65 | I/II | Hormone Therapy | tamoxiphen | SD |
| PKP1 | SNV | Missense_Mutation | novel | c.97A>G | p.Thr33Ala | p.T33A | Q13835 | protein_coding | tolerated(0.12) | benign(0.437) | TCGA-2W-A8YY-01 | Cervix | cervical & endocervical cancer | Female | <65 | I/II | Chemotherapy | cisplatin | CR |


