
|
|||||
|
 | |
| |
| |
| |
| |
| |
|
Gene: PKD2 |
Gene summary for PKD2 |
| Gene information | Species | Human | Gene symbol | PKD2 | Gene ID | 5311 |
| Gene name | polycystin 2, transient receptor potential cation channel | |
| Gene Alias | APKD2 | |
| Cytomap | 4q22.1 | |
| Gene Type | protein-coding | GO ID | GO:0000003 | UniProtAcc | Q13563 |
Top |
Malignant transformation analysis |
| Identification of the aberrant gene expression in precancerous and cancerous lesions by comparing the gene expression of stem-like cells in diseased tissues with normal stem cells |
| Entrez ID | Symbol | Replicates | Species | Organ | Tissue | Adj P-value | Log2FC | Malignancy |
| 5311 | PKD2 | HCC1_Meng | Human | Liver | HCC | 1.01e-26 | -8.42e-03 | 0.0246 |
| 5311 | PKD2 | HCC2_Meng | Human | Liver | HCC | 5.97e-04 | -3.47e-02 | 0.0107 |
| 5311 | PKD2 | cirrhotic3 | Human | Liver | Cirrhotic | 9.98e-04 | 7.40e-02 | 0.0215 |
| 5311 | PKD2 | HCC1 | Human | Liver | HCC | 8.63e-05 | 8.80e-01 | 0.5336 |
| 5311 | PKD2 | HCC2 | Human | Liver | HCC | 3.59e-06 | 2.05e+00 | 0.5341 |
| 5311 | PKD2 | Pt13.b | Human | Liver | HCC | 2.29e-03 | 1.75e-02 | 0.0251 |
| 5311 | PKD2 | S027 | Human | Liver | HCC | 1.46e-02 | 3.13e-01 | 0.2446 |
| 5311 | PKD2 | S028 | Human | Liver | HCC | 4.86e-07 | 3.02e-01 | 0.2503 |
| 5311 | PKD2 | RNA-P17T-P17T-4 | Human | Lung | IAC | 2.39e-03 | 5.27e-01 | 0.343 |
| 5311 | PKD2 | RNA-P17T-P17T-6 | Human | Lung | IAC | 1.19e-03 | 5.20e-01 | 0.3385 |
| 5311 | PKD2 | RNA-P17T-P17T-8 | Human | Lung | IAC | 9.56e-04 | 5.85e-01 | 0.3329 |
| 5311 | PKD2 | RNA-P25T1-P25T1-1 | Human | Lung | AIS | 7.77e-03 | 2.92e-01 | -0.2116 |
| 5311 | PKD2 | RNA-P6T2-P6T2-1 | Human | Lung | IAC | 7.68e-03 | 2.27e-01 | -0.0166 |
| 5311 | PKD2 | RNA-P6T2-P6T2-3 | Human | Lung | IAC | 5.31e-06 | 2.84e-01 | -0.013 |
| 5311 | PKD2 | HTA12-15-2 | Human | Pancreas | PDAC | 4.09e-08 | 3.83e-01 | 0.2315 |
| 5311 | PKD2 | HTA12-23-1 | Human | Pancreas | PDAC | 2.93e-09 | 8.09e-01 | 0.3405 |
| 5311 | PKD2 | HTA12-25-1 | Human | Pancreas | PDAC | 3.33e-07 | 5.69e-01 | 0.313 |
| 5311 | PKD2 | HTA12-26-1 | Human | Pancreas | PDAC | 5.25e-22 | 8.82e-01 | 0.3728 |
| 5311 | PKD2 | HTA12-29-1 | Human | Pancreas | PDAC | 1.83e-50 | 9.34e-01 | 0.3722 |
| 5311 | PKD2 | HTA12-30-1 | Human | Pancreas | PDAC | 3.91e-06 | 1.05e+00 | 0.3671 |
| Page: 1 2 |
| Tissue | Expression Dynamics | Abbreviation |
| Liver | 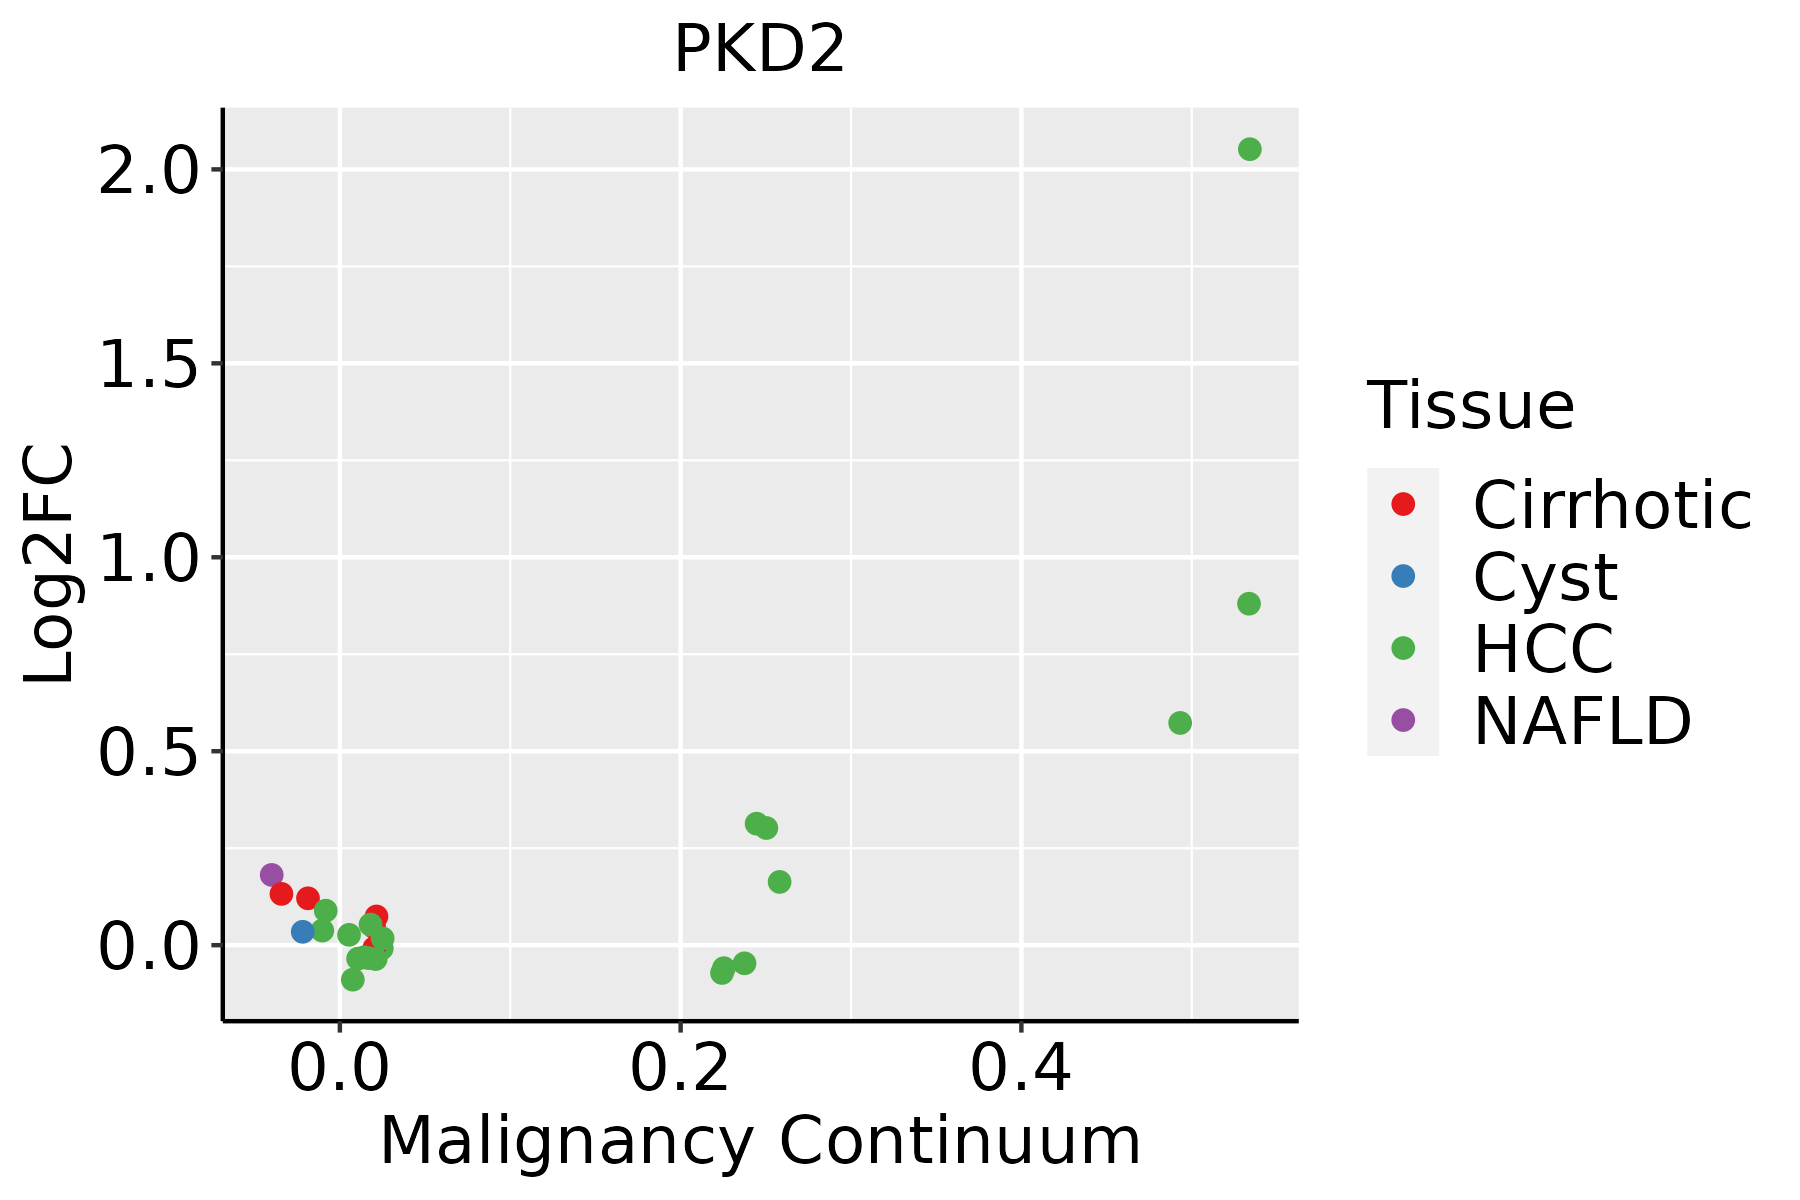 | HCC: Hepatocellular carcinoma |
| NAFLD: Non-alcoholic fatty liver disease | ||
| Lung | 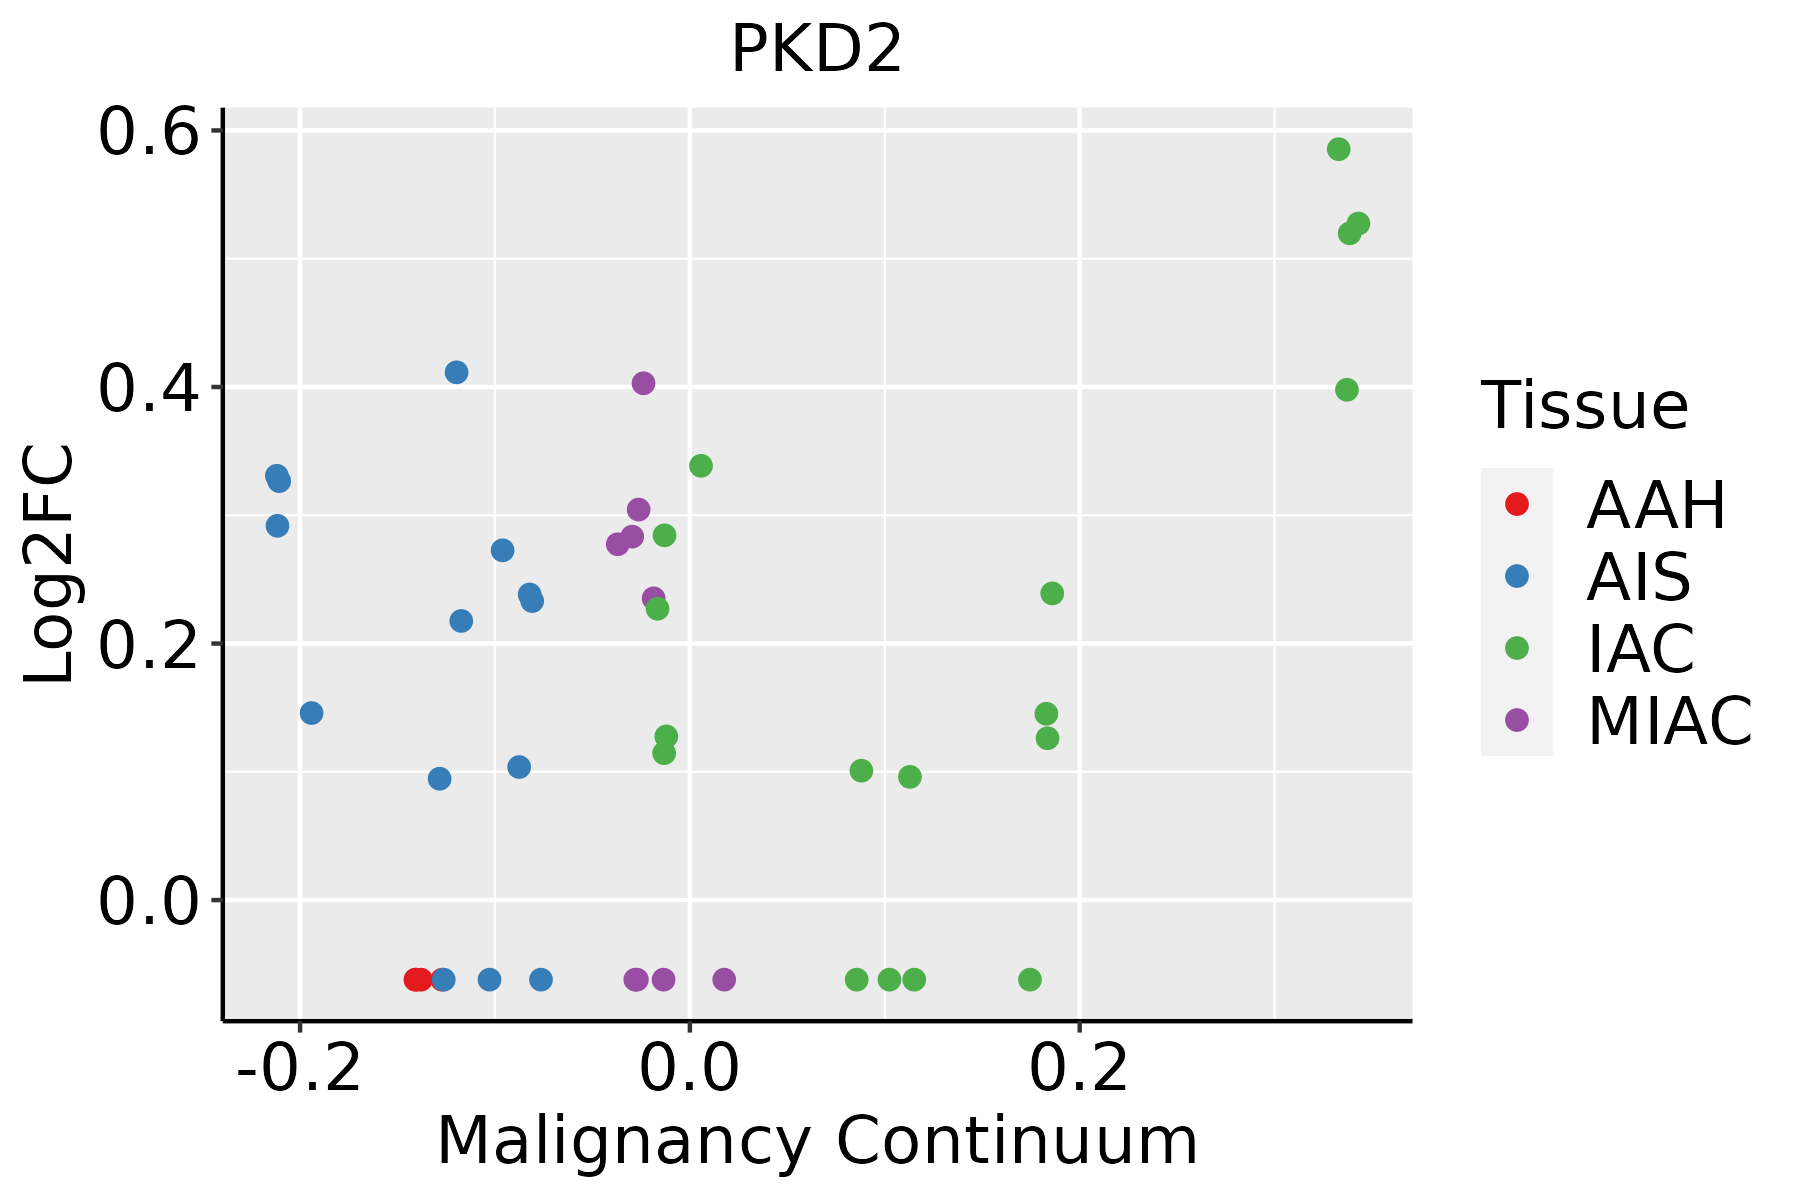 | AAH: Atypical adenomatous hyperplasia |
| AIS: Adenocarcinoma in situ | ||
| IAC: Invasive lung adenocarcinoma | ||
| MIA: Minimally invasive adenocarcinoma | ||
| Thyroid | 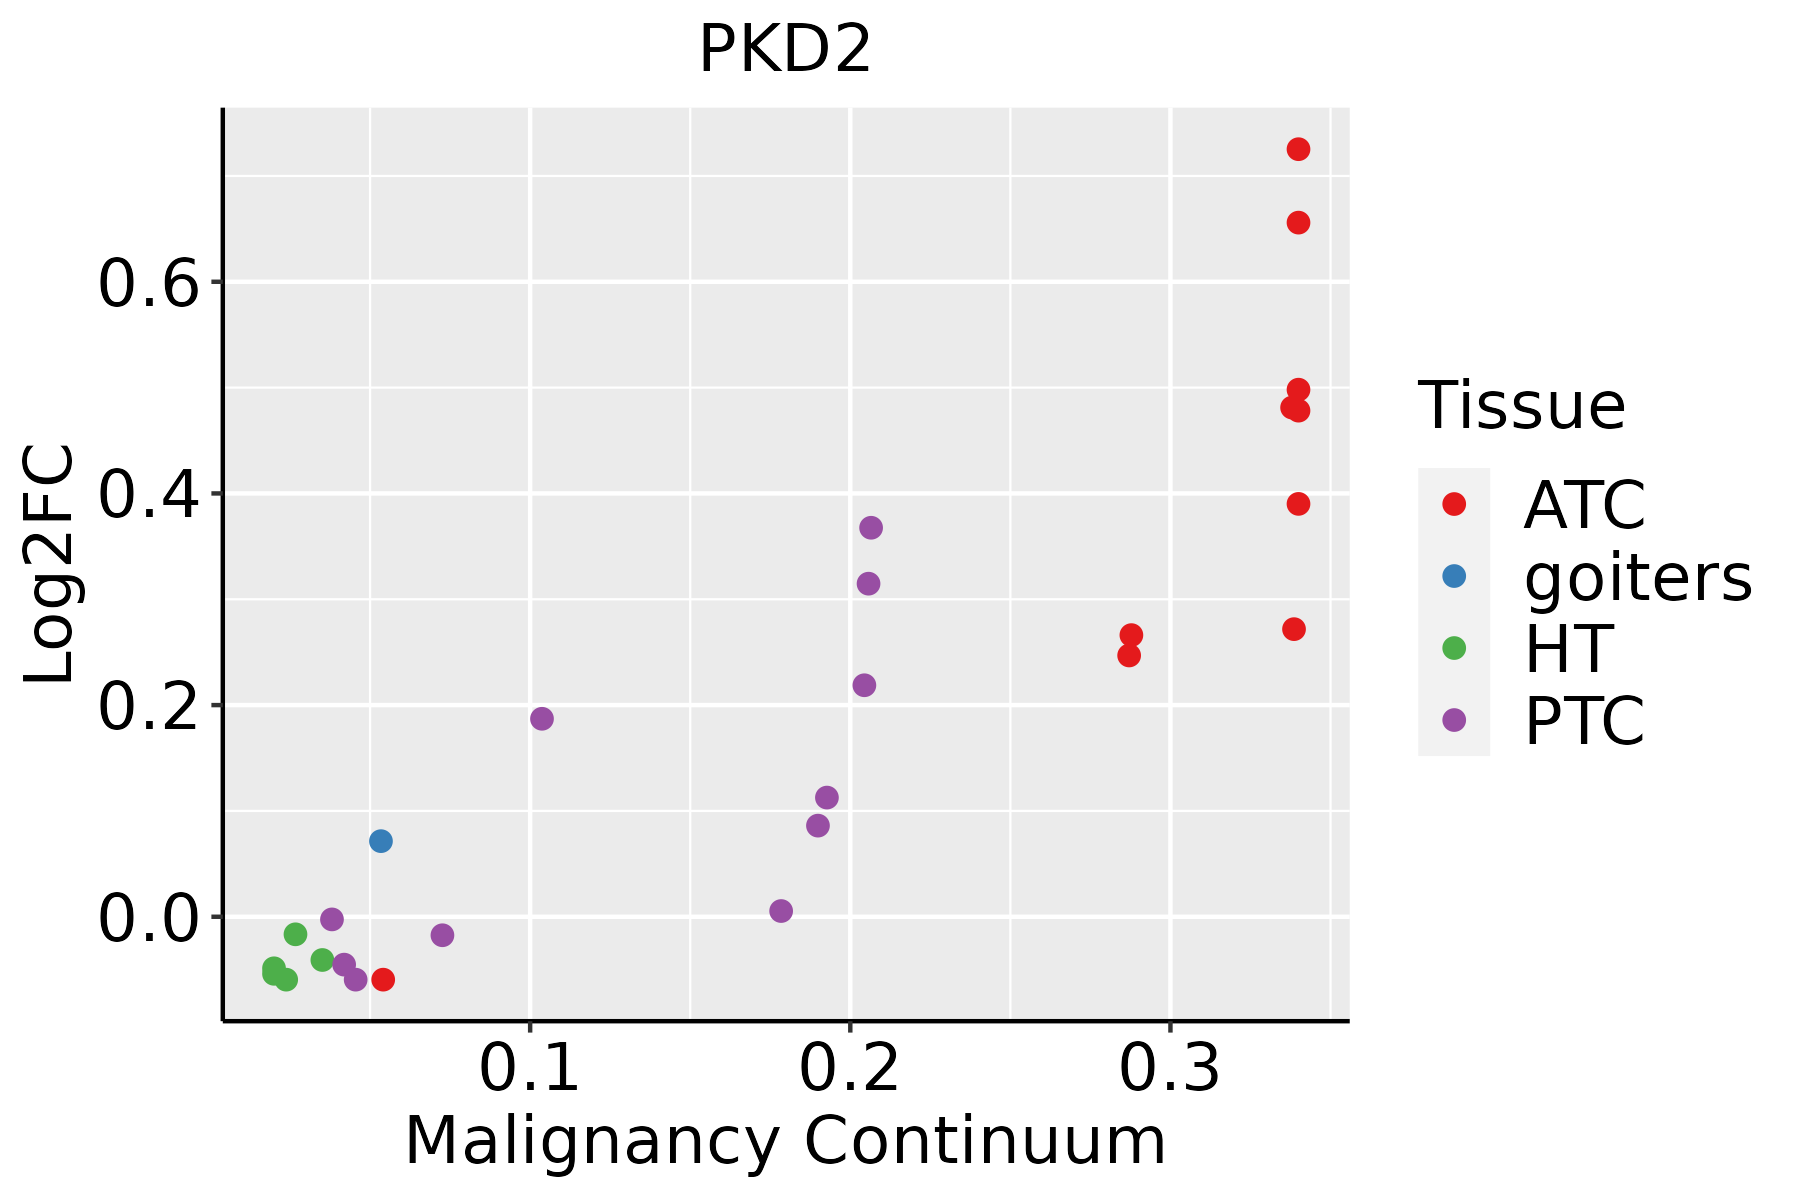 | ATC: Anaplastic thyroid cancer |
| HT: Hashimoto's thyroiditis | ||
| PTC: Papillary thyroid cancer |
| ∗log2FC in expression of this searched gene in stem-like cells from each diseased tissue sample relative to stem-like cells in normal samples in each tissue plotted against the malignancy continuum. Samples are colored based on if they are from different disease stage. |
Top |
Malignant transformation related pathway analysis |
| Find out the enriched GO biological processes and KEGG pathways involved in transition from healthy to precancer to cancer |
| Tissue | Disease Stage | Enriched GO biological Processes |
| Colorectum | AD |  |
| Colorectum | SER |  |
| Colorectum | MSS |  |
| Colorectum | MSI-H |  |
| Colorectum | FAP |  |
| ∗Top 15 enriched GO BP terms are showed in the bar plot of each disease state in each tissue. Each row represents a significant GO biological process which is colored according to the -log10(p.adjust). |
| Page: 1 2 3 4 5 6 7 8 9 |
| GO ID | Tissue | Disease Stage | Description | Gene Ratio | Bg Ratio | pvalue | p.adjust | Count |
| GO:00720063 | Lung | IAC | nephron development | 26/2061 | 142/18723 | 6.32e-03 | 4.51e-02 | 26 |
| GO:19040622 | Lung | IAC | regulation of cation transmembrane transport | 55/2061 | 357/18723 | 6.36e-03 | 4.52e-02 | 55 |
| GO:00485684 | Lung | IAC | embryonic organ development | 64/2061 | 427/18723 | 6.46e-03 | 4.59e-02 | 64 |
| GO:00109595 | Lung | IAC | regulation of metal ion transport | 61/2061 | 406/18723 | 7.31e-03 | 4.98e-02 | 61 |
| GO:001605512 | Lung | AIS | Wnt signaling pathway | 91/1849 | 444/18723 | 9.38e-12 | 5.47e-09 | 91 |
| GO:019873812 | Lung | AIS | cell-cell signaling by wnt | 91/1849 | 446/18723 | 1.22e-11 | 6.13e-09 | 91 |
| GO:000165511 | Lung | AIS | urogenital system development | 63/1849 | 338/18723 | 5.46e-07 | 4.08e-05 | 63 |
| GO:000697913 | Lung | AIS | response to oxidative stress | 75/1849 | 446/18723 | 2.97e-06 | 1.60e-04 | 75 |
| GO:003367412 | Lung | AIS | positive regulation of kinase activity | 77/1849 | 467/18723 | 4.67e-06 | 2.31e-04 | 77 |
| GO:000182211 | Lung | AIS | kidney development | 53/1849 | 293/18723 | 1.04e-05 | 4.25e-04 | 53 |
| GO:007200111 | Lung | AIS | renal system development | 54/1849 | 302/18723 | 1.21e-05 | 4.71e-04 | 54 |
| GO:006056211 | Lung | AIS | epithelial tube morphogenesis | 57/1849 | 325/18723 | 1.27e-05 | 4.78e-04 | 57 |
| GO:004586012 | Lung | AIS | positive regulation of protein kinase activity | 65/1849 | 386/18723 | 1.27e-05 | 4.78e-04 | 65 |
| GO:006145812 | Lung | AIS | reproductive system development | 70/1849 | 427/18723 | 1.52e-05 | 5.50e-04 | 70 |
| GO:007190012 | Lung | AIS | regulation of protein serine/threonine kinase activity | 61/1849 | 359/18723 | 1.76e-05 | 6.17e-04 | 61 |
| GO:006219713 | Lung | AIS | cellular response to chemical stress | 58/1849 | 337/18723 | 1.91e-05 | 6.62e-04 | 58 |
| GO:004477211 | Lung | AIS | mitotic cell cycle phase transition | 69/1849 | 424/18723 | 2.23e-05 | 7.42e-04 | 69 |
| GO:004860811 | Lung | AIS | reproductive structure development | 69/1849 | 424/18723 | 2.23e-05 | 7.42e-04 | 69 |
| GO:005123512 | Lung | AIS | maintenance of location | 55/1849 | 327/18723 | 5.93e-05 | 1.65e-03 | 55 |
| GO:007190211 | Lung | AIS | positive regulation of protein serine/threonine kinase activity | 38/1849 | 200/18723 | 6.00e-05 | 1.65e-03 | 38 |
| Page: 1 2 3 4 5 6 7 8 9 10 11 12 13 14 15 16 17 18 19 20 21 |
| Pathway ID | Tissue | Disease Stage | Description | Gene Ratio | Bg Ratio | pvalue | p.adjust | qvalue | Count |
| Page: 1 |
Top |
Cell-cell communication analysis |
| Identification of potential cell-cell interactions between two cell types and their ligand-receptor pairs for different disease states |
| Ligand | Receptor | LRpair | Pathway | Tissue | Disease Stage |
| Page: 1 |
Top |
Single-cell gene regulatory network inference analysis |
| Find out the significant the regulons (TFs) and the target genes of each regulon across cell types for different disease states |
| TF | Cell Type | Tissue | Disease Stage | Target Gene | RSS | Regulon Activity |
| ∗The dot plots of a searched regulon are shown for all cell subpopulations in each disease state of each tissue based on the regulon specific score inferred using pySCENIC and by calculating the average expression. |
| Page: 1 |
Top |
Somatic mutation of malignant transformation related genes |
| Annotation of somatic variants for genes involved in malignant transformation |
| Hugo Symbol | Variant Class | Variant Classification | dbSNP RS | HGVSc | HGVSp | HGVSp Short | SWISSPROT | BIOTYPE | SIFT | PolyPhen | Tumor Sample Barcode | Tissue | Histology | Sex | Age | Stage | Therapy Types | Drugs | Outcome |
| PKD2 | SNV | Missense_Mutation | rs748241808 | c.2615N>A | p.Arg872Gln | p.R872Q | Q13563 | protein_coding | deleterious(0.05) | benign(0.007) | TCGA-AN-A0AK-01 | Breast | breast invasive carcinoma | Female | >=65 | I/II | Unknown | Unknown | SD |
| PKD2 | SNV | Missense_Mutation | rs757656223 | c.1870N>A | p.Asp624Asn | p.D624N | Q13563 | protein_coding | tolerated(0.27) | benign(0.07) | TCGA-AR-A1AI-01 | Breast | breast invasive carcinoma | Female | <65 | I/II | Chemotherapy | cytoxan | PD |
| PKD2 | SNV | Missense_Mutation | rs770609334 | c.2668N>A | p.Glu890Lys | p.E890K | Q13563 | protein_coding | tolerated(0.07) | probably_damaging(0.981) | TCGA-BH-A0HF-01 | Breast | breast invasive carcinoma | Female | >=65 | I/II | Hormone Therapy | arimidex | SD |
| PKD2 | SNV | Missense_Mutation | c.1637C>T | p.Pro546Leu | p.P546L | Q13563 | protein_coding | deleterious(0) | benign(0.122) | TCGA-C8-A26Y-01 | Breast | breast invasive carcinoma | Female | >=65 | I/II | Unknown | Unknown | SD | |
| PKD2 | SNV | Missense_Mutation | c.2355N>C | p.Glu785Asp | p.E785D | Q13563 | protein_coding | deleterious(0.03) | benign(0.214) | TCGA-E9-A1R4-01 | Breast | breast invasive carcinoma | Female | >=65 | I/II | Chemotherapy | 5-fluorouracil | SD | |
| PKD2 | SNV | Missense_Mutation | rs761597786 | c.2449N>A | p.Asp817Asn | p.D817N | Q13563 | protein_coding | tolerated(0.16) | benign(0.02) | TCGA-LL-A740-01 | Breast | breast invasive carcinoma | Female | <65 | I/II | Chemotherapy | adriamycin | CR |
| PKD2 | SNV | Missense_Mutation | rs144590958 | c.2729N>A | p.Arg910His | p.R910H | Q13563 | protein_coding | deleterious(0) | probably_damaging(0.925) | TCGA-WT-AB44-01 | Breast | breast invasive carcinoma | Female | >=65 | I/II | Hormone Therapy | arimidex | SD |
| PKD2 | SNV | Missense_Mutation | c.1069N>T | p.Pro357Ser | p.P357S | Q13563 | protein_coding | tolerated(0.35) | benign(0.115) | TCGA-EK-A3GJ-01 | Cervix | cervical & endocervical cancer | Female | <65 | I/II | Unknown | Unknown | SD | |
| PKD2 | SNV | Missense_Mutation | rs755031837 | c.2534G>A | p.Arg845Gln | p.R845Q | Q13563 | protein_coding | tolerated(0.07) | probably_damaging(0.978) | TCGA-A6-6781-01 | Colorectum | colon adenocarcinoma | Male | <65 | III/IV | Chemotherapy | oxaliplatin | SD |
| PKD2 | SNV | Missense_Mutation | c.1904C>T | p.Thr635Ile | p.T635I | Q13563 | protein_coding | deleterious(0) | probably_damaging(0.993) | TCGA-AA-3663-01 | Colorectum | colon adenocarcinoma | Male | <65 | I/II | Unknown | Unknown | SD |
| Page: 1 2 3 4 5 6 7 8 9 10 11 |
Top |
Related drugs of malignant transformation related genes |
| Identification of chemicals and drugs interact with genes involved in malignant transfromation |
| (DGIdb 4.0) |
| Entrez ID | Symbol | Category | Interaction Types | Drug Claim Name | Drug Name | PMIDs |
| 5311 | PKD2 | DRUGGABLE GENOME, TUMOR SUPPRESSOR, ION CHANNEL, TRANSPORTER | allopurinol | ALLOPURINOL | 30924126 |
| Page: 1 |

Copyright 2023-Present -The University of Texas Health Science Center at Houston |