
|
|||||
|
 | |
| |
| |
| |
| |
| |
|
Gene: PAN3 |
Gene summary for PAN3 |
| Gene information | Species | Human | Gene symbol | PAN3 | Gene ID | 255967 |
| Gene name | poly(A) specific ribonuclease subunit PAN3 | |
| Gene Alias | PAN3 | |
| Cytomap | 13q12.2 | |
| Gene Type | protein-coding | GO ID | GO:0000288 | UniProtAcc | Q58A45 |
Top |
Malignant transformation analysis |
| Identification of the aberrant gene expression in precancerous and cancerous lesions by comparing the gene expression of stem-like cells in diseased tissues with normal stem cells |
| Entrez ID | Symbol | Replicates | Species | Organ | Tissue | Adj P-value | Log2FC | Malignancy |
| 255967 | PAN3 | CCI_1 | Human | Cervix | CC | 1.81e-09 | 1.10e+00 | 0.528 |
| 255967 | PAN3 | CCI_2 | Human | Cervix | CC | 7.52e-13 | 1.86e+00 | 0.5249 |
| 255967 | PAN3 | CCI_3 | Human | Cervix | CC | 9.35e-20 | 1.22e+00 | 0.516 |
| 255967 | PAN3 | HTA11_3410_2000001011 | Human | Colorectum | AD | 3.49e-34 | -7.85e-01 | 0.0155 |
| 255967 | PAN3 | HTA11_2487_2000001011 | Human | Colorectum | SER | 2.85e-04 | -5.18e-01 | -0.1808 |
| 255967 | PAN3 | HTA11_2951_2000001011 | Human | Colorectum | AD | 3.08e-04 | -8.62e-01 | 0.0216 |
| 255967 | PAN3 | HTA11_347_2000001011 | Human | Colorectum | AD | 2.03e-04 | 4.10e-01 | -0.1954 |
| 255967 | PAN3 | HTA11_3361_2000001011 | Human | Colorectum | AD | 4.48e-05 | -5.20e-01 | -0.1207 |
| 255967 | PAN3 | HTA11_696_2000001011 | Human | Colorectum | AD | 7.62e-05 | -3.29e-01 | -0.1464 |
| 255967 | PAN3 | HTA11_2992_2000001011 | Human | Colorectum | SER | 8.41e-04 | -5.46e-01 | -0.1706 |
| 255967 | PAN3 | HTA11_5212_2000001011 | Human | Colorectum | AD | 3.22e-10 | -8.75e-01 | -0.2061 |
| 255967 | PAN3 | HTA11_5216_2000001011 | Human | Colorectum | SER | 9.55e-05 | -6.25e-01 | -0.1462 |
| 255967 | PAN3 | HTA11_9341_2000001011 | Human | Colorectum | SER | 1.82e-02 | -7.72e-01 | -0.00410000000000005 |
| 255967 | PAN3 | HTA11_866_3004761011 | Human | Colorectum | AD | 5.76e-06 | -4.94e-01 | 0.096 |
| 255967 | PAN3 | HTA11_10711_2000001011 | Human | Colorectum | AD | 3.45e-11 | -5.71e-01 | 0.0338 |
| 255967 | PAN3 | HTA11_7696_3000711011 | Human | Colorectum | AD | 6.15e-06 | -4.91e-01 | 0.0674 |
| 255967 | PAN3 | HTA11_99999970781_79442 | Human | Colorectum | MSS | 1.96e-05 | -4.31e-01 | 0.294 |
| 255967 | PAN3 | HTA11_99999965104_69814 | Human | Colorectum | MSS | 7.45e-35 | 1.56e+00 | 0.281 |
| 255967 | PAN3 | HTA11_99999971662_82457 | Human | Colorectum | MSS | 6.18e-05 | 6.33e-01 | 0.3859 |
| 255967 | PAN3 | HTA11_99999973899_84307 | Human | Colorectum | MSS | 2.62e-04 | 9.88e-01 | 0.2585 |
| Page: 1 2 3 4 5 6 7 |
| Tissue | Expression Dynamics | Abbreviation |
| Cervix |  | CC: Cervix cancer |
| HSIL_HPV: HPV-infected high-grade squamous intraepithelial lesions | ||
| N_HPV: HPV-infected normal cervix | ||
| Colorectum (GSE201348) |  | FAP: Familial adenomatous polyposis |
| CRC: Colorectal cancer | ||
| Colorectum (HTA11) | 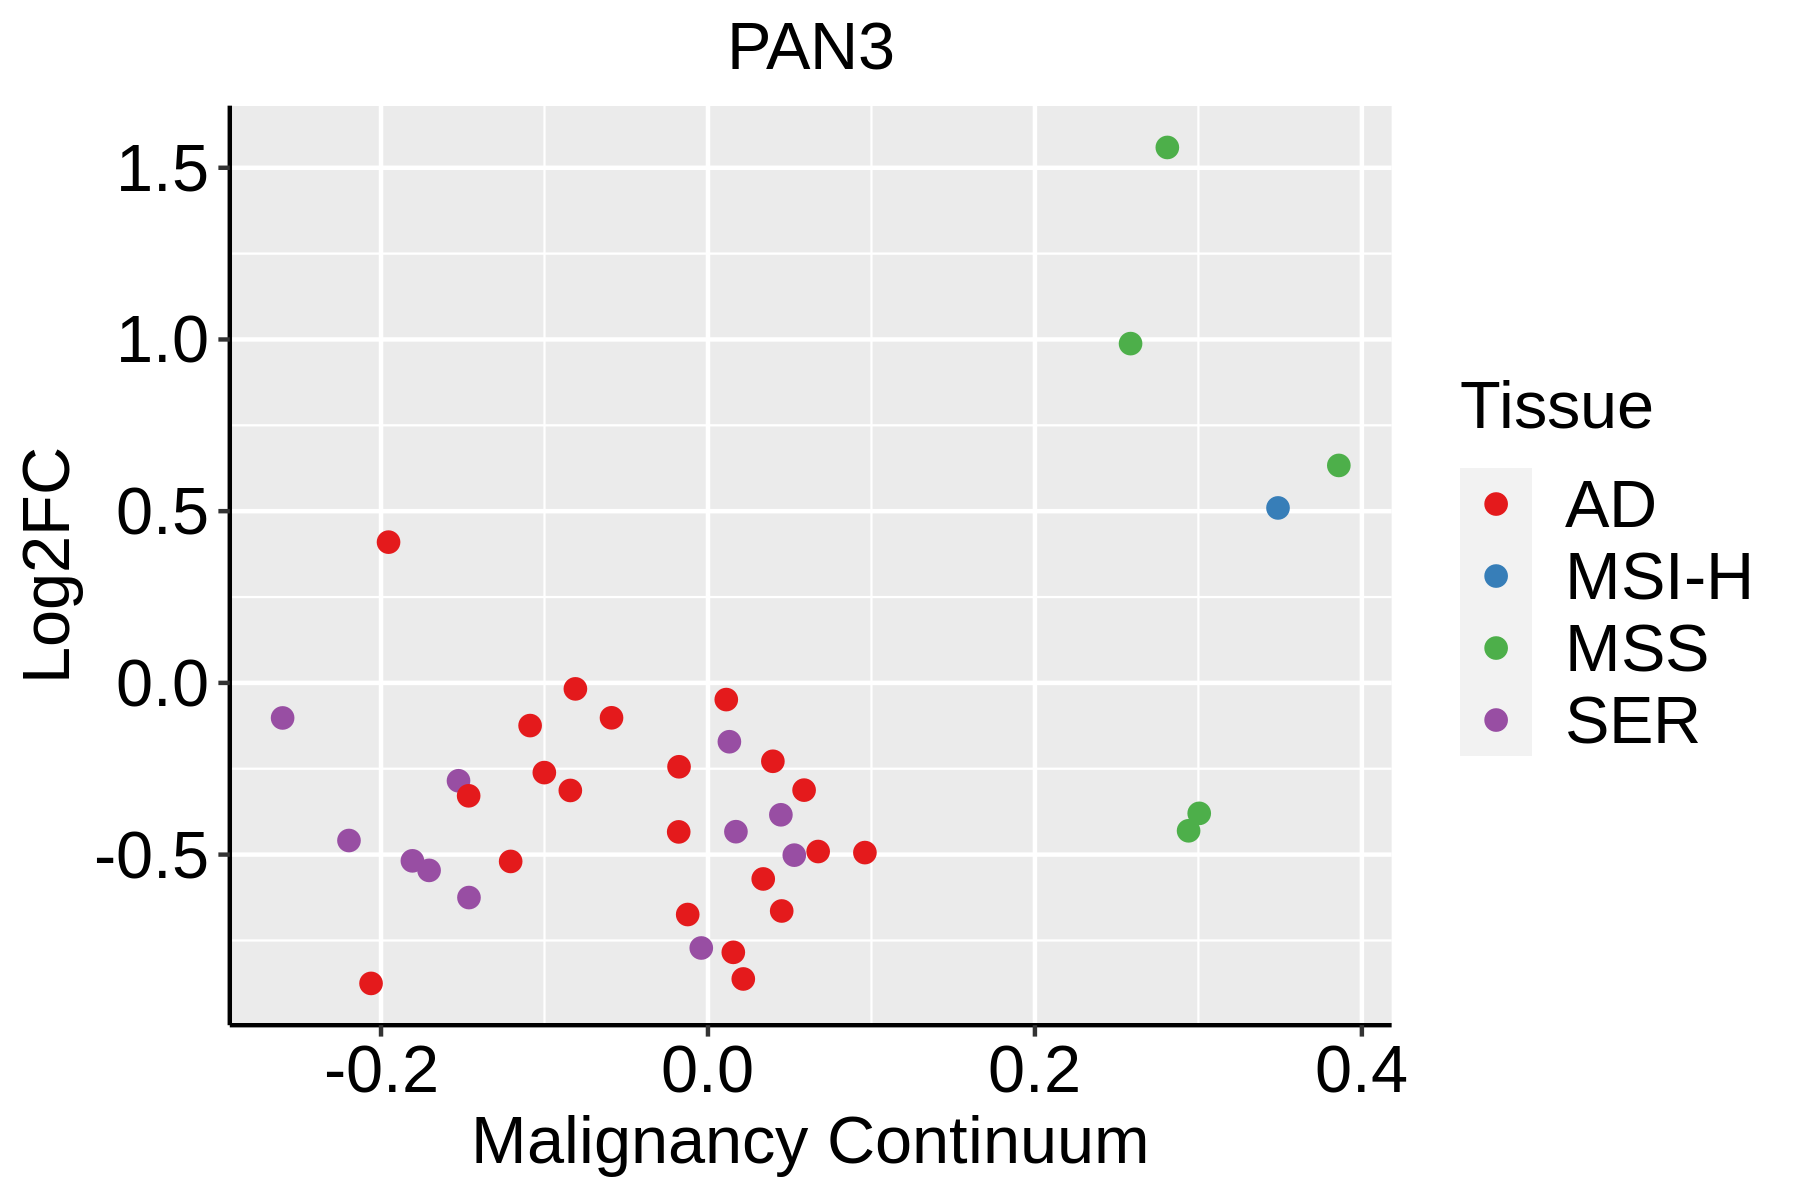 | AD: Adenomas |
| SER: Sessile serrated lesions | ||
| MSI-H: Microsatellite-high colorectal cancer | ||
| MSS: Microsatellite stable colorectal cancer | ||
| Endometrium | 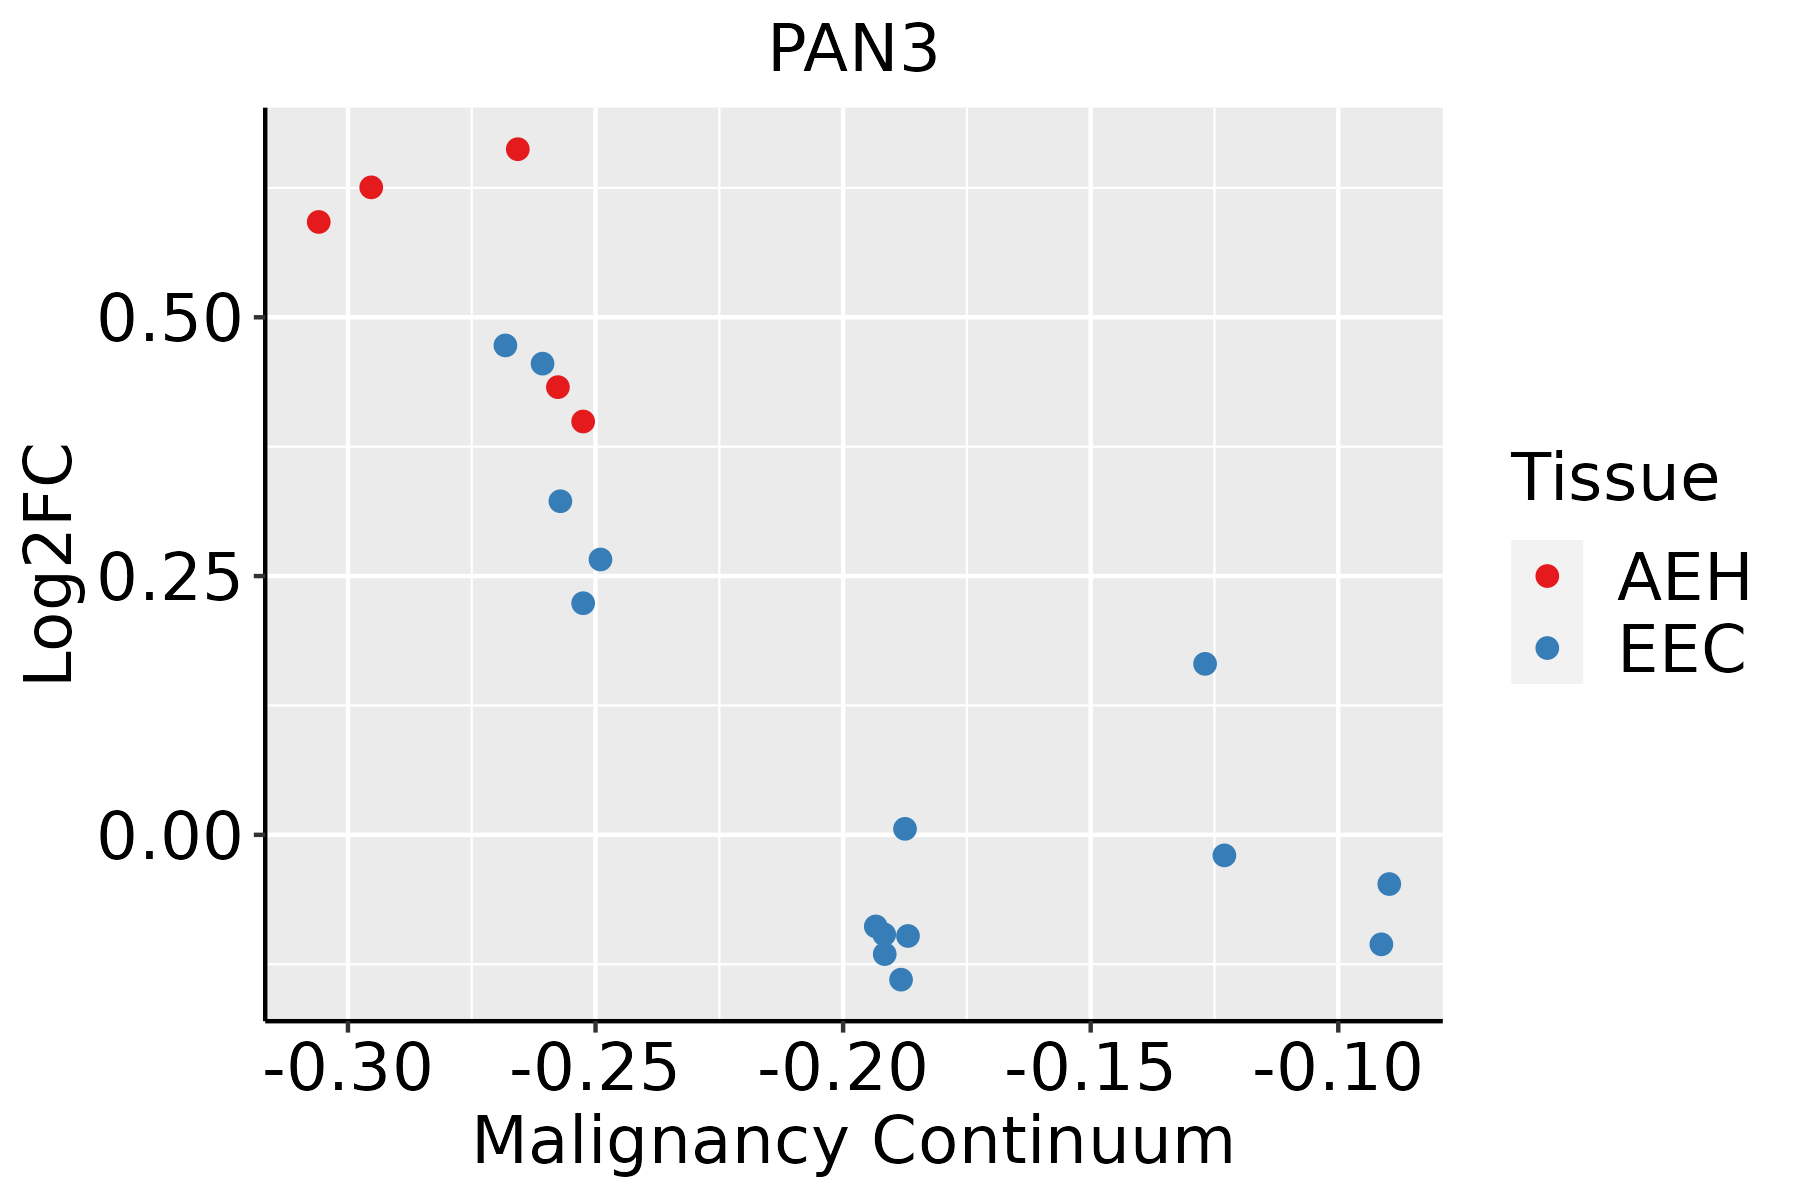 | AEH: Atypical endometrial hyperplasia |
| EEC: Endometrioid Cancer | ||
| Liver | 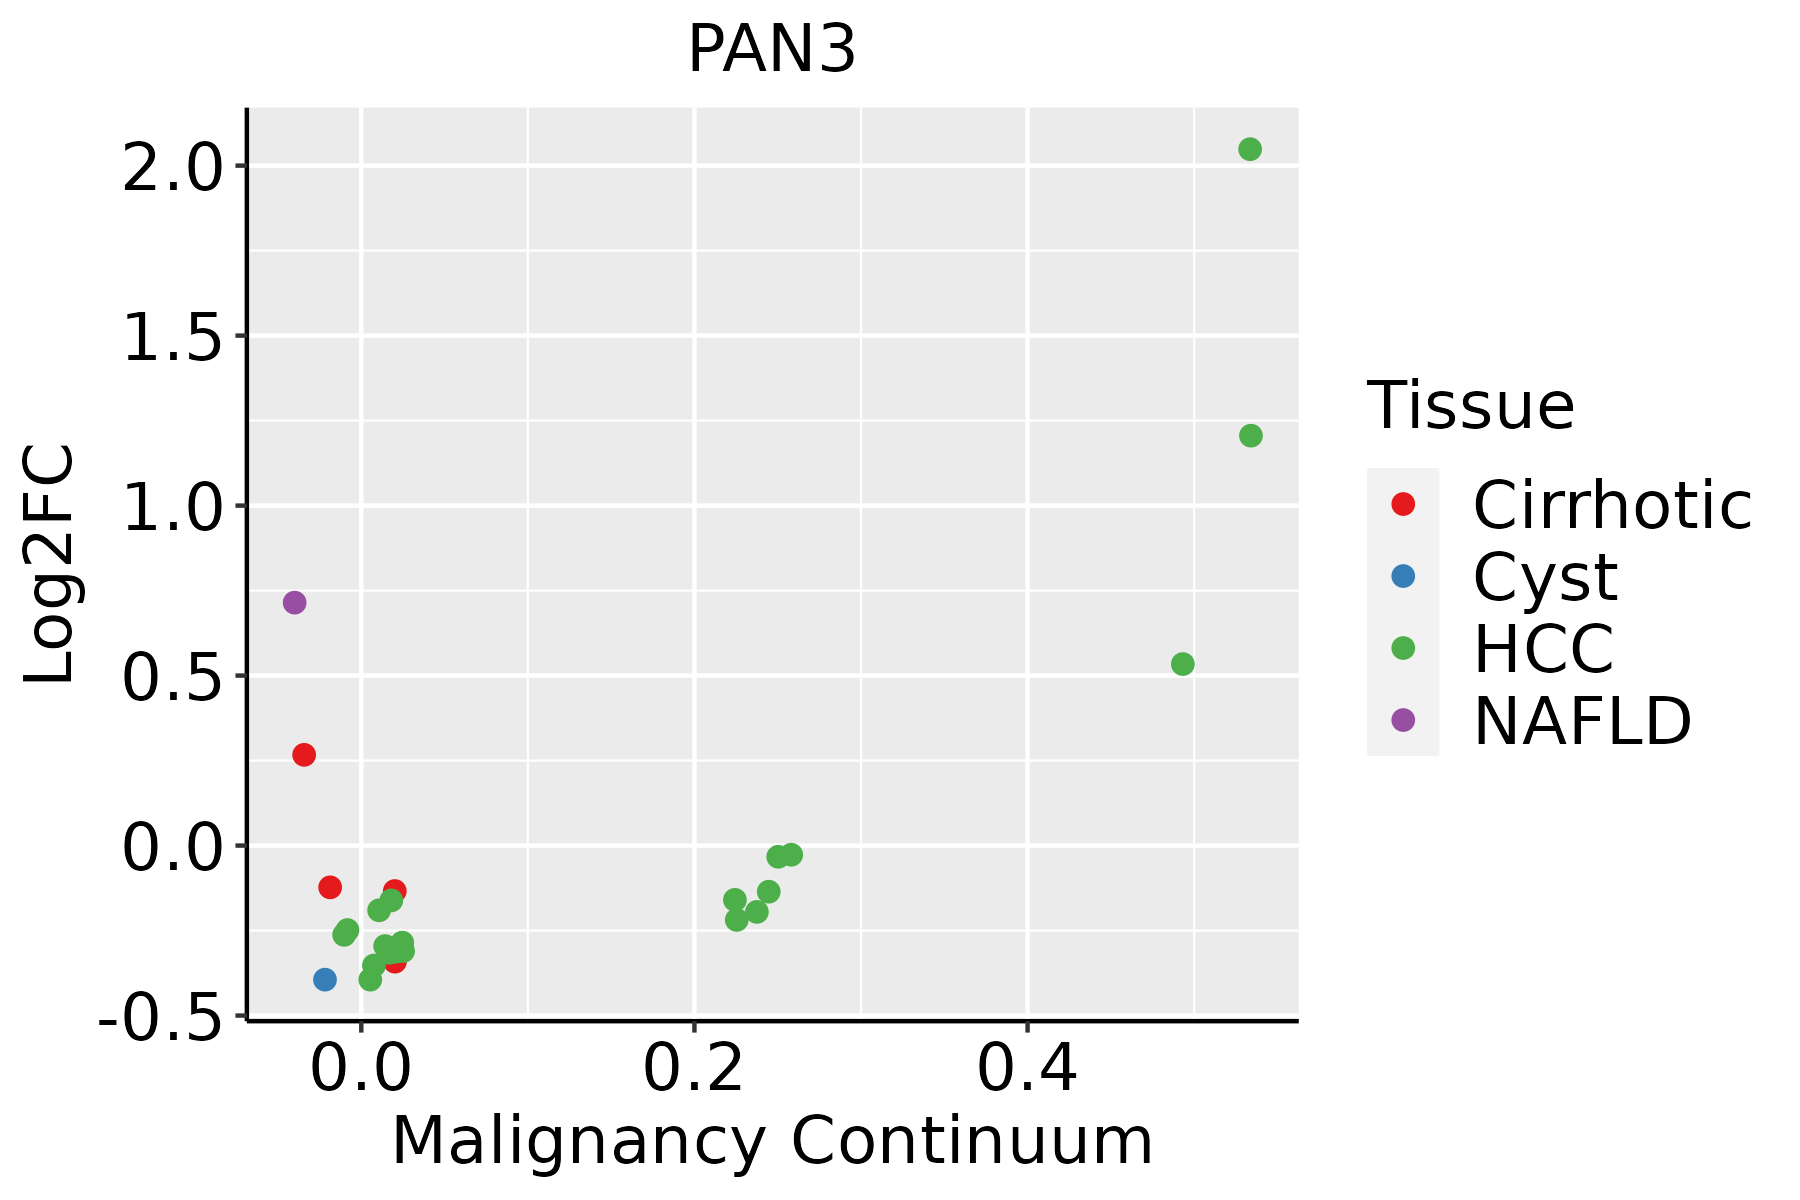 | HCC: Hepatocellular carcinoma |
| NAFLD: Non-alcoholic fatty liver disease | ||
| Lung |  | AAH: Atypical adenomatous hyperplasia |
| AIS: Adenocarcinoma in situ | ||
| IAC: Invasive lung adenocarcinoma | ||
| MIA: Minimally invasive adenocarcinoma | ||
| Oral Cavity |  | EOLP: Erosive Oral lichen planus |
| LP: leukoplakia | ||
| NEOLP: Non-erosive oral lichen planus | ||
| OSCC: Oral squamous cell carcinoma | ||
| Prostate | 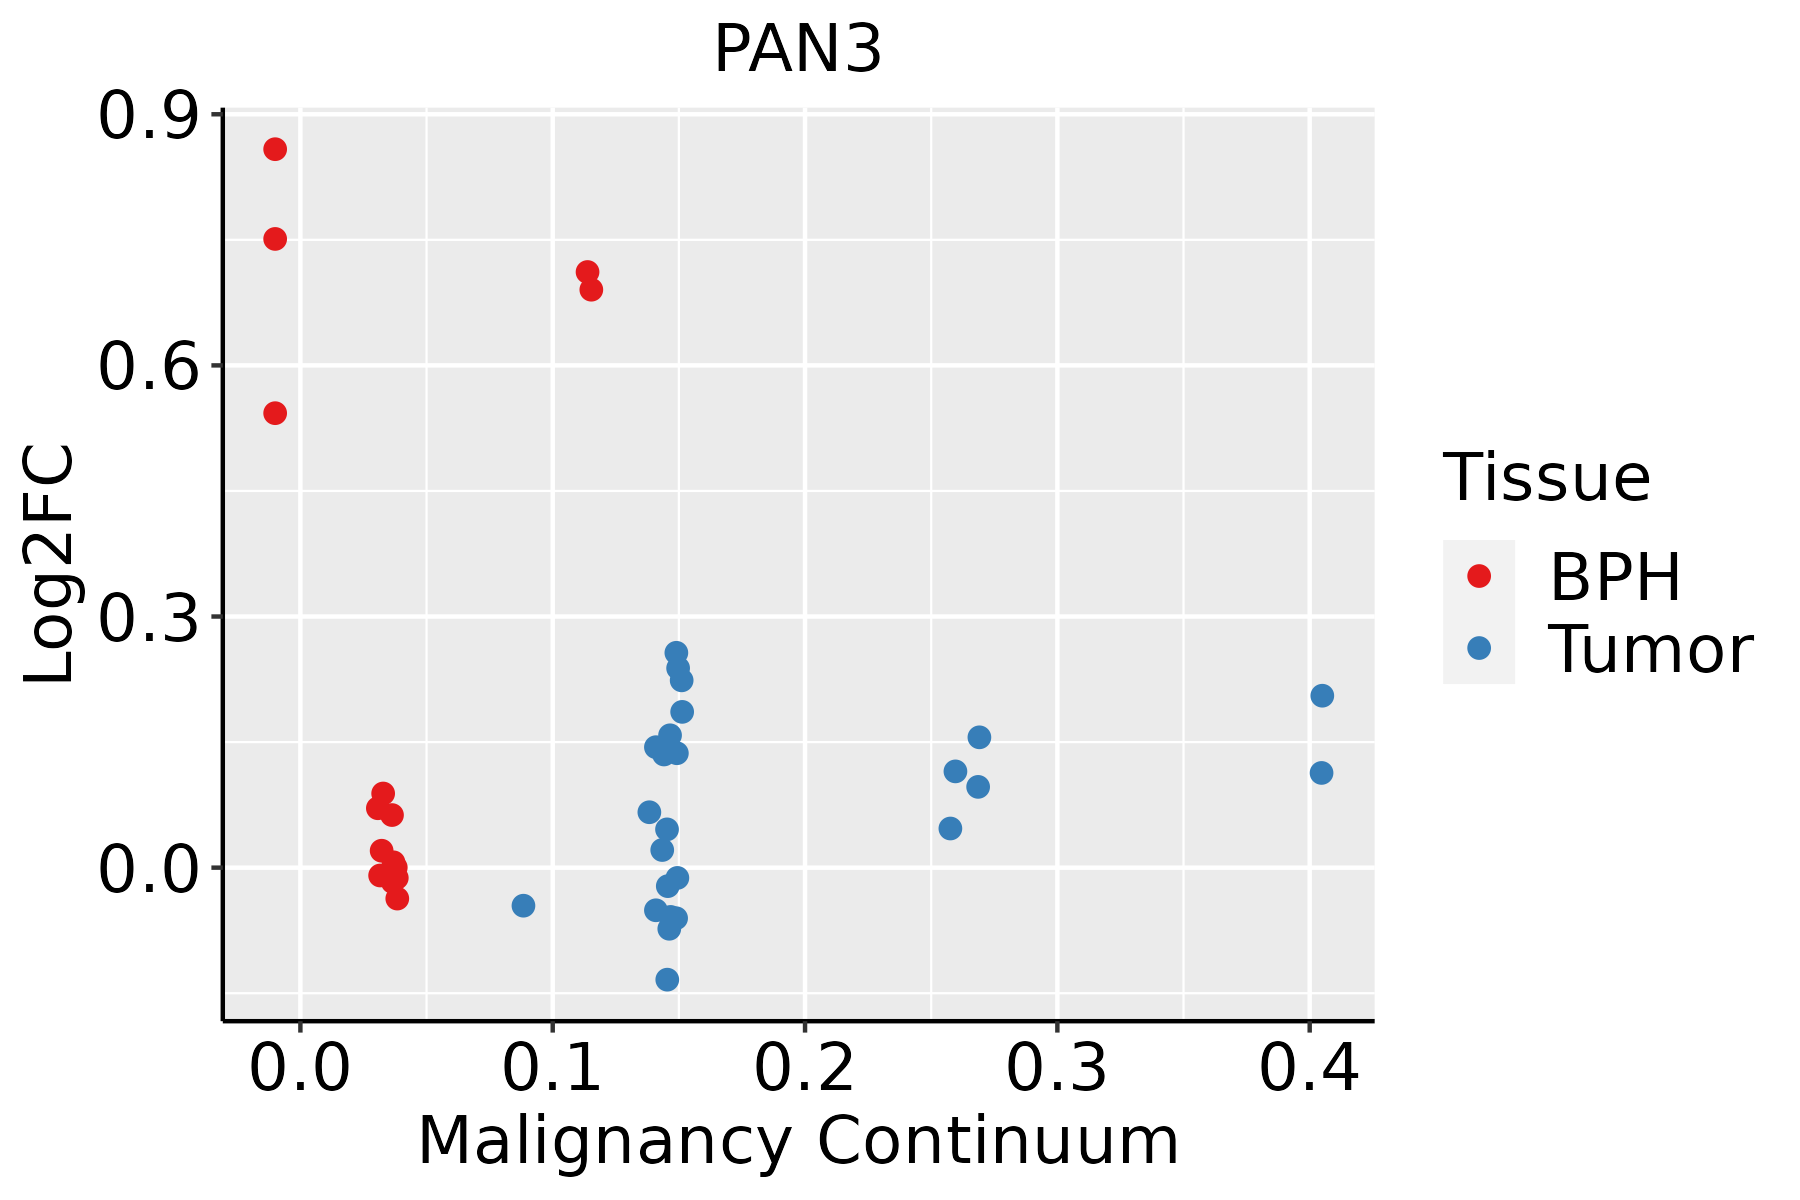 | BPH: Benign Prostatic Hyperplasia |
| ∗log2FC in expression of this searched gene in stem-like cells from each diseased tissue sample relative to stem-like cells in normal samples in each tissue plotted against the malignancy continuum. Samples are colored based on if they are from different disease stage. |
Top |
Malignant transformation related pathway analysis |
| Find out the enriched GO biological processes and KEGG pathways involved in transition from healthy to precancer to cancer |
| Tissue | Disease Stage | Enriched GO biological Processes |
| Colorectum | AD |  |
| Colorectum | SER |  |
| Colorectum | MSS |  |
| Colorectum | MSI-H |  |
| Colorectum | FAP |  |
| ∗Top 15 enriched GO BP terms are showed in the bar plot of each disease state in each tissue. Each row represents a significant GO biological process which is colored according to the -log10(p.adjust). |
| Page: 1 2 3 4 5 6 7 8 9 |
| GO ID | Tissue | Disease Stage | Description | Gene Ratio | Bg Ratio | pvalue | p.adjust | Count |
| GO:00442707 | Liver | NAFLD | cellular nitrogen compound catabolic process | 93/1882 | 451/18723 | 1.04e-11 | 4.34e-09 | 93 |
| GO:00467006 | Liver | NAFLD | heterocycle catabolic process | 92/1882 | 445/18723 | 1.16e-11 | 4.52e-09 | 92 |
| GO:19033116 | Liver | NAFLD | regulation of mRNA metabolic process | 66/1882 | 288/18723 | 1.06e-10 | 2.96e-08 | 66 |
| GO:00064026 | Liver | NAFLD | mRNA catabolic process | 56/1882 | 232/18723 | 3.49e-10 | 9.27e-08 | 56 |
| GO:00346556 | Liver | NAFLD | nucleobase-containing compound catabolic process | 80/1882 | 407/18723 | 3.07e-09 | 4.61e-07 | 80 |
| GO:00064016 | Liver | NAFLD | RNA catabolic process | 61/1882 | 278/18723 | 3.26e-09 | 4.76e-07 | 61 |
| GO:00610136 | Liver | NAFLD | regulation of mRNA catabolic process | 42/1882 | 166/18723 | 1.27e-08 | 1.65e-06 | 42 |
| GO:00064177 | Liver | NAFLD | regulation of translation | 85/1882 | 468/18723 | 4.58e-08 | 4.54e-06 | 85 |
| GO:00434886 | Liver | NAFLD | regulation of mRNA stability | 39/1882 | 158/18723 | 8.49e-08 | 7.09e-06 | 39 |
| GO:00434876 | Liver | NAFLD | regulation of RNA stability | 40/1882 | 170/18723 | 2.32e-07 | 1.58e-05 | 40 |
| GO:00610144 | Liver | NAFLD | positive regulation of mRNA catabolic process | 24/1882 | 87/18723 | 3.17e-06 | 1.27e-04 | 24 |
| GO:00611574 | Liver | NAFLD | mRNA destabilization | 23/1882 | 84/18723 | 5.79e-06 | 2.05e-04 | 23 |
| GO:19033134 | Liver | NAFLD | positive regulation of mRNA metabolic process | 28/1882 | 118/18723 | 1.21e-05 | 3.70e-04 | 28 |
| GO:00507794 | Liver | NAFLD | RNA destabilization | 23/1882 | 88/18723 | 1.34e-05 | 3.97e-04 | 23 |
| GO:00009564 | Liver | NAFLD | nuclear-transcribed mRNA catabolic process | 26/1882 | 112/18723 | 3.68e-05 | 9.23e-04 | 26 |
| GO:00171483 | Liver | NAFLD | negative regulation of translation | 43/1882 | 245/18723 | 2.05e-04 | 3.56e-03 | 43 |
| GO:00342493 | Liver | NAFLD | negative regulation of cellular amide metabolic process | 46/1882 | 273/18723 | 3.27e-04 | 5.04e-03 | 46 |
| GO:00002894 | Liver | NAFLD | nuclear-transcribed mRNA poly(A) tail shortening | 10/1882 | 29/18723 | 3.42e-04 | 5.22e-03 | 10 |
| GO:00002884 | Liver | NAFLD | nuclear-transcribed mRNA catabolic process, deadenylation-dependent decay | 14/1882 | 56/18723 | 1.03e-03 | 1.21e-02 | 14 |
| GO:000989612 | Liver | Cirrhotic | positive regulation of catabolic process | 215/4634 | 492/18723 | 1.13e-20 | 3.56e-18 | 215 |
| Page: 1 2 3 4 5 6 7 8 9 10 11 12 13 14 15 16 17 18 19 20 21 22 |
| Pathway ID | Tissue | Disease Stage | Description | Gene Ratio | Bg Ratio | pvalue | p.adjust | qvalue | Count |
| hsa030187 | Endometrium | EEC | RNA degradation | 20/1237 | 79/8465 | 8.36e-03 | 3.88e-02 | 2.89e-02 | 20 |
| hsa0301812 | Endometrium | EEC | RNA degradation | 20/1237 | 79/8465 | 8.36e-03 | 3.88e-02 | 2.89e-02 | 20 |
| hsa03018 | Liver | Cirrhotic | RNA degradation | 44/2530 | 79/8465 | 1.43e-06 | 1.65e-05 | 1.02e-05 | 44 |
| hsa030181 | Liver | Cirrhotic | RNA degradation | 44/2530 | 79/8465 | 1.43e-06 | 1.65e-05 | 1.02e-05 | 44 |
| hsa030182 | Liver | HCC | RNA degradation | 58/4020 | 79/8465 | 2.29e-06 | 2.19e-05 | 1.22e-05 | 58 |
| hsa030183 | Liver | HCC | RNA degradation | 58/4020 | 79/8465 | 2.29e-06 | 2.19e-05 | 1.22e-05 | 58 |
| hsa030189 | Oral cavity | OSCC | RNA degradation | 59/3704 | 79/8465 | 2.05e-08 | 1.91e-07 | 9.70e-08 | 59 |
| hsa0301814 | Oral cavity | OSCC | RNA degradation | 59/3704 | 79/8465 | 2.05e-08 | 1.91e-07 | 9.70e-08 | 59 |
| hsa0301841 | Oral cavity | EOLP | RNA degradation | 22/1218 | 79/8465 | 1.33e-03 | 4.80e-03 | 2.83e-03 | 22 |
| hsa0301851 | Oral cavity | EOLP | RNA degradation | 22/1218 | 79/8465 | 1.33e-03 | 4.80e-03 | 2.83e-03 | 22 |
| hsa0301861 | Oral cavity | NEOLP | RNA degradation | 18/1112 | 79/8465 | 1.25e-02 | 4.06e-02 | 2.56e-02 | 18 |
| hsa0301871 | Oral cavity | NEOLP | RNA degradation | 18/1112 | 79/8465 | 1.25e-02 | 4.06e-02 | 2.56e-02 | 18 |
| hsa030188 | Prostate | BPH | RNA degradation | 29/1718 | 79/8465 | 5.17e-04 | 2.67e-03 | 1.65e-03 | 29 |
| hsa0301813 | Prostate | BPH | RNA degradation | 29/1718 | 79/8465 | 5.17e-04 | 2.67e-03 | 1.65e-03 | 29 |
| hsa0301822 | Prostate | Tumor | RNA degradation | 30/1791 | 79/8465 | 4.48e-04 | 2.35e-03 | 1.46e-03 | 30 |
| hsa0301832 | Prostate | Tumor | RNA degradation | 30/1791 | 79/8465 | 4.48e-04 | 2.35e-03 | 1.46e-03 | 30 |
| Page: 1 |
Top |
Cell-cell communication analysis |
| Identification of potential cell-cell interactions between two cell types and their ligand-receptor pairs for different disease states |
| Ligand | Receptor | LRpair | Pathway | Tissue | Disease Stage |
| Page: 1 |
Top |
Single-cell gene regulatory network inference analysis |
| Find out the significant the regulons (TFs) and the target genes of each regulon across cell types for different disease states |
| TF | Cell Type | Tissue | Disease Stage | Target Gene | RSS | Regulon Activity |
| ∗The dot plots of a searched regulon are shown for all cell subpopulations in each disease state of each tissue based on the regulon specific score inferred using pySCENIC and by calculating the average expression. |
| Page: 1 |
Top |
Somatic mutation of malignant transformation related genes |
| Annotation of somatic variants for genes involved in malignant transformation |
| Hugo Symbol | Variant Class | Variant Classification | dbSNP RS | HGVSc | HGVSp | HGVSp Short | SWISSPROT | BIOTYPE | SIFT | PolyPhen | Tumor Sample Barcode | Tissue | Histology | Sex | Age | Stage | Therapy Types | Drugs | Outcome |
| PAN3 | SNV | Missense_Mutation | novel | c.2433N>T | p.Leu811Phe | p.L811F | Q58A45 | protein_coding | deleterious(0) | probably_damaging(0.999) | TCGA-AR-A2LE-01 | Breast | breast invasive carcinoma | Female | >=65 | I/II | Hormone Therapy | tamoxiphen | PD |
| PAN3 | SNV | Missense_Mutation | novel | c.2436A>C | p.Lys812Asn | p.K812N | Q58A45 | protein_coding | deleterious(0) | probably_damaging(0.997) | TCGA-B6-A0IN-01 | Breast | breast invasive carcinoma | Female | <65 | I/II | Unknown | Unknown | PD |
| PAN3 | SNV | Missense_Mutation | c.1202C>T | p.Thr401Met | p.T401M | Q58A45 | protein_coding | deleterious(0.01) | probably_damaging(0.999) | TCGA-2W-A8YY-01 | Cervix | cervical & endocervical cancer | Female | <65 | I/II | Chemotherapy | cisplatin | CR | |
| PAN3 | SNV | Missense_Mutation | c.2561C>T | p.Ser854Phe | p.S854F | Q58A45 | protein_coding | deleterious(0) | probably_damaging(0.987) | TCGA-C5-A1BL-01 | Cervix | cervical & endocervical cancer | Female | <65 | I/II | Unknown | Unknown | SD | |
| PAN3 | SNV | Missense_Mutation | novel | c.1734G>A | p.Met578Ile | p.M578I | Q58A45 | protein_coding | deleterious(0.02) | benign(0.019) | TCGA-C5-A2LZ-01 | Cervix | cervical & endocervical cancer | Female | >=65 | III/IV | Unknown | Unknown | PD |
| PAN3 | SNV | Missense_Mutation | rs769103468 | c.2219N>A | p.Arg740Gln | p.R740Q | Q58A45 | protein_coding | deleterious(0.03) | possibly_damaging(0.73) | TCGA-FU-A3HZ-01 | Cervix | cervical & endocervical cancer | Female | <65 | I/II | Chemotherapy | cisplatin | CR |
| PAN3 | SNV | Missense_Mutation | c.1856N>T | p.Ala619Val | p.A619V | Q58A45 | protein_coding | deleterious(0.02) | possibly_damaging(0.672) | TCGA-A6-5661-01 | Colorectum | colon adenocarcinoma | Female | >=65 | I/II | Unknown | Unknown | SD | |
| PAN3 | SNV | Missense_Mutation | c.1549N>T | p.Pro517Ser | p.P517S | Q58A45 | protein_coding | tolerated(0.18) | benign(0.384) | TCGA-AA-3492-01 | Colorectum | colon adenocarcinoma | Female | >=65 | I/II | Unknown | Unknown | SD | |
| PAN3 | SNV | Missense_Mutation | c.2231N>G | p.Asp744Gly | p.D744G | Q58A45 | protein_coding | deleterious(0.04) | probably_damaging(0.999) | TCGA-AA-3492-01 | Colorectum | colon adenocarcinoma | Female | >=65 | I/II | Unknown | Unknown | SD | |
| PAN3 | SNV | Missense_Mutation | rs765586023 | c.1318N>A | p.Ala440Thr | p.A440T | Q58A45 | protein_coding | tolerated(0.16) | possibly_damaging(0.748) | TCGA-AA-3845-01 | Colorectum | colon adenocarcinoma | Female | >=65 | I/II | Unknown | Unknown | PD |
| Page: 1 2 3 4 5 6 7 8 9 |
Top |
Related drugs of malignant transformation related genes |
| Identification of chemicals and drugs interact with genes involved in malignant transfromation |
| (DGIdb 4.0) |
| Entrez ID | Symbol | Category | Interaction Types | Drug Claim Name | Drug Name | PMIDs |
| Page: 1 |

Copyright 2023-Present -The University of Texas Health Science Center at Houston |