Schematic overview of the cellular and molecular mechanisms involved in the cancer progression, including the proposed cellular and molecular mechanisms in cancer cells trajectory. AT1: alveolar type 1 cells; AT2: alveolar type 2 cells; AAH: atypical adenomatous hyperplasia; AIS: adenocarcinoma in situ; MIA: minimally invasive adenocarcinoma; IA: invasive adenocarcinoma; EMT: epithelial-mesenchymal transition

Home

Download

Statistics

Help

Contact

Center for Computational Systems Medicine
leaf

Gene summary

leaf

Malignant transformation analysis

leaf

Malignant transformation related pathway analysis

leaf

Cell-cell communication analysis

leaf

Single-cell gene regulatory network inference analysis

leaf

Somatic mutation of malignant transformation related genes

leaf

Related drugs of malignant transformation related genes

Gene: NUDT8

Gene summary for NUDT8

check button Gene summary.

Gene informationSpeciesHuman
Gene symbol

NUDT8

Gene ID

254552

Gene namenudix hydrolase 8
Gene AliasNUDT8
Cytomap11q13.2
Gene Typeprotein-coding
GO ID

GO:0006082

UniProtAcc

Q8WV74


Top

Malignant transformation analysis

check button Identification of the aberrant gene expression in precancerous and cancerous lesions by comparing the gene expression of stem-like cells in diseased tissues with normal stem cells
check button Malignant transformation involving gene list.
Entrez IDSymbolReplicatesSpeciesOrganTissueAdj P-valueLog2FCMalignancy
254552NUDT8GSM4909282HumanBreastIDC2.77e-074.14e-01-0.0288
254552NUDT8GSM4909290HumanBreastIDC5.31e-431.03e+000.2096
254552NUDT8GSM4909294HumanBreastIDC7.39e-177.04e-010.2022
254552NUDT8GSM4909296HumanBreastIDC2.05e-02-6.05e-020.1524
254552NUDT8GSM4909297HumanBreastIDC2.25e-03-9.53e-020.1517
254552NUDT8GSM4909311HumanBreastIDC1.38e-04-9.11e-020.1534
254552NUDT8GSM4909312HumanBreastIDC1.69e-02-2.53e-020.1552
254552NUDT8GSM4909315HumanBreastIDC6.96e-196.61e-010.21
254552NUDT8GSM4909316HumanBreastIDC7.65e-054.49e-010.21
254552NUDT8GSM4909319HumanBreastIDC6.19e-10-3.63e-020.1563
254552NUDT8GSM4909321HumanBreastIDC1.89e-03-3.68e-020.1559
254552NUDT8NCCBC6HumanBreastDCIS1.48e-241.30e+000.2095
254552NUDT8DCIS2HumanBreastDCIS1.16e-145.65e-020.0085
254552NUDT8LZE4THumanEsophagusESCC4.06e-061.13e-010.0811
254552NUDT8LZE20THumanEsophagusESCC7.57e-247.62e-010.0662
254552NUDT8LZE22D1HumanEsophagusHGIN1.39e-074.50e-010.0595
254552NUDT8LZE22THumanEsophagusESCC3.60e-086.14e-010.068
254552NUDT8LZE24THumanEsophagusESCC2.76e-134.40e-010.0596
254552NUDT8LZE21THumanEsophagusESCC8.25e-073.48e-010.0655
254552NUDT8P1T-EHumanEsophagusESCC5.18e-167.63e-010.0875
Page: 1 2 3 4 5 6 7 

check button Transcriptomic changes along malignancy continuum.
TissueExpression DynamicsAbbreviation
BreastThe image shows the transcriptomic changes along malignancy continuum.log2FC in expression of this searched gene in stem-like cells from each diseased tissue sample relative to stem-like cells in normal samples in each tissue plotted against the malignancy continuum. Samples are colored based on if they are from different disease stage.
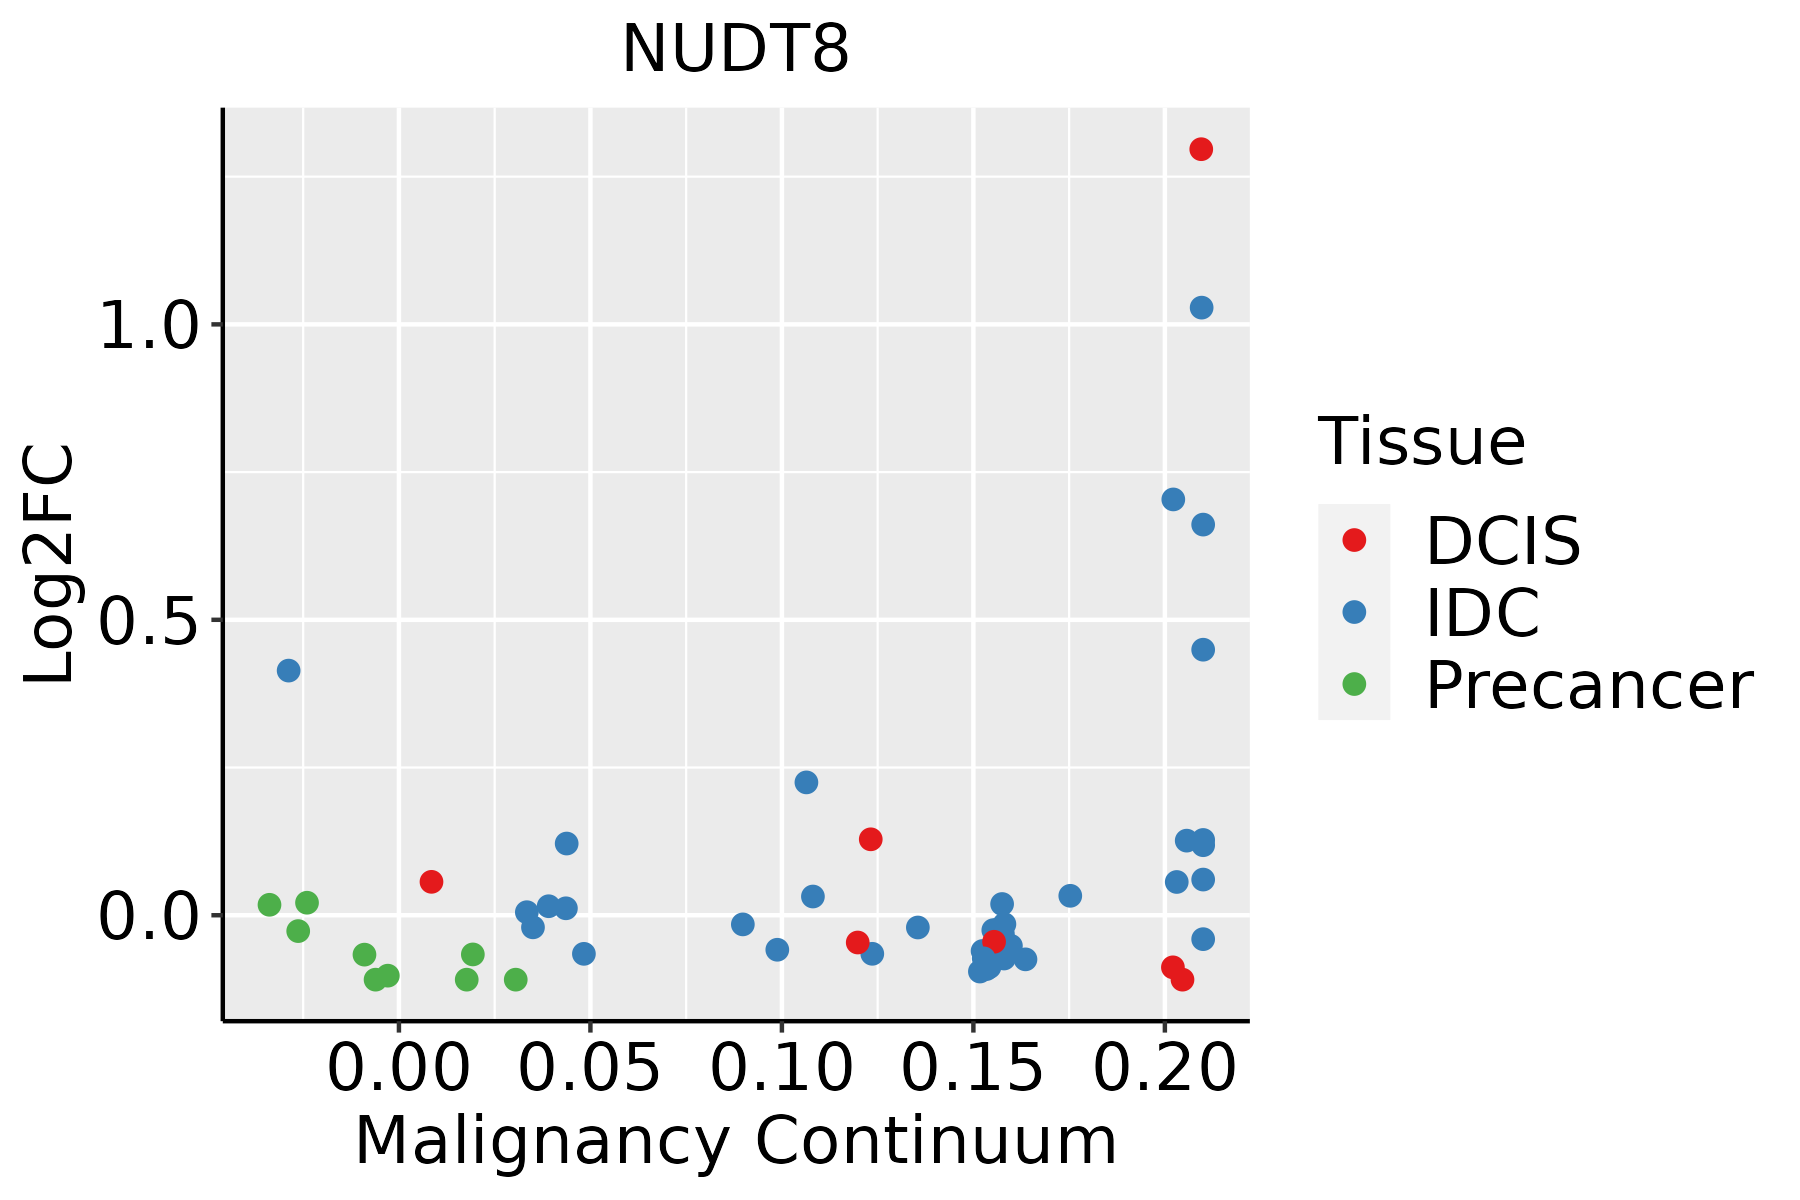
IDC: Invasive ductal carcinoma
DCIS: Ductal carcinoma in situ
Precancer(BRCA1-mut): Precancerous lesion from BRCA1 mutation carriers
EsophagusThe image shows the transcriptomic changes along malignancy continuum.log2FC in expression of this searched gene in stem-like cells from each diseased tissue sample relative to stem-like cells in normal samples in each tissue plotted against the malignancy continuum. Samples are colored based on if they are from different disease stage.
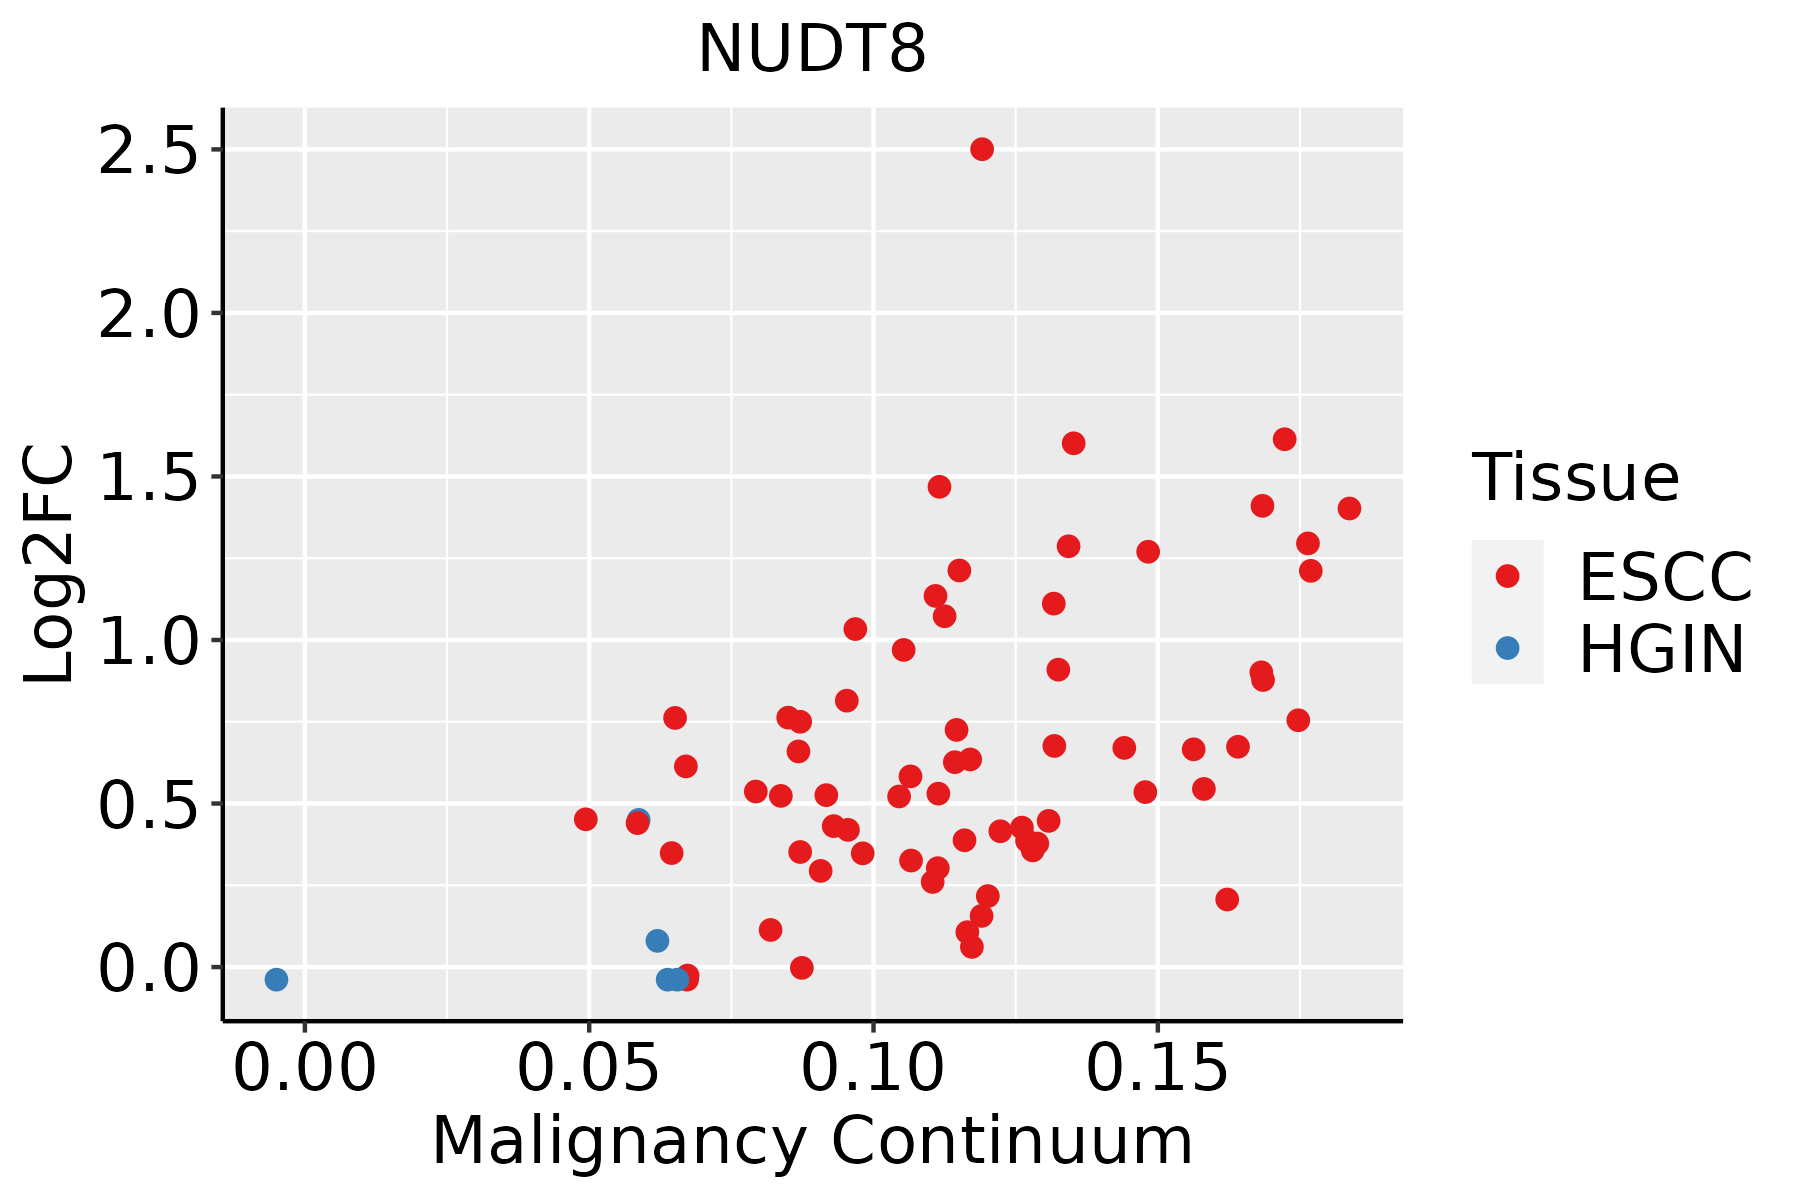
ESCC: Esophageal squamous cell carcinoma
HGIN: High-grade intraepithelial neoplasias
LGIN: Low-grade intraepithelial neoplasias
GCThe image shows the transcriptomic changes along malignancy continuum.log2FC in expression of this searched gene in stem-like cells from each diseased tissue sample relative to stem-like cells in normal samples in each tissue plotted against the malignancy continuum. Samples are colored based on if they are from different disease stage.CAG: Chronic atrophic gastritis
CAG with IM: Chronic atrophic gastritis with intestinal metaplasia
CSG: Chronic superficial gastritis
GC: Gastric cancer
SIM: Severe intestinal metaplasia
WIM: Wild intestinal metaplasia
LiverThe image shows the transcriptomic changes along malignancy continuum.log2FC in expression of this searched gene in stem-like cells from each diseased tissue sample relative to stem-like cells in normal samples in each tissue plotted against the malignancy continuum. Samples are colored based on if they are from different disease stage.
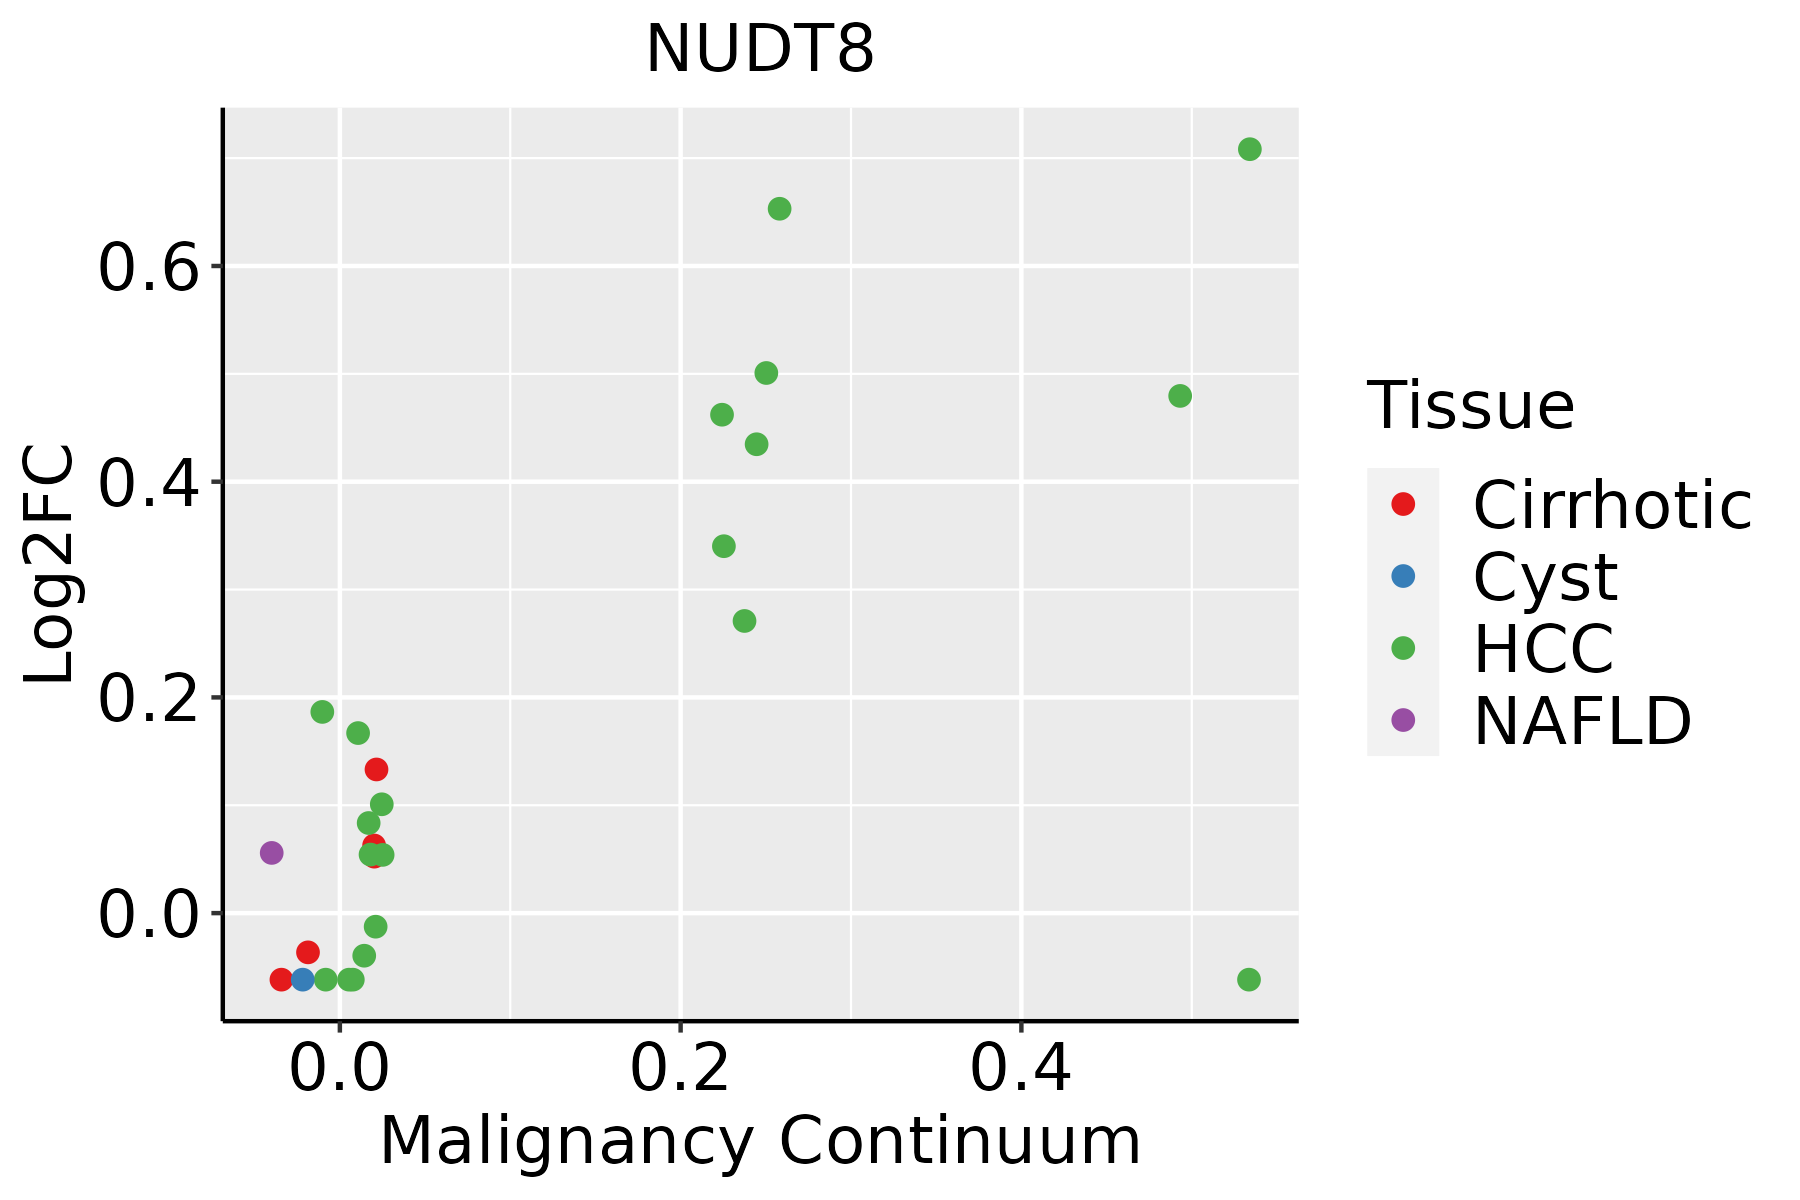
HCC: Hepatocellular carcinoma
NAFLD: Non-alcoholic fatty liver disease
Oral CavityThe image shows the transcriptomic changes along malignancy continuum.log2FC in expression of this searched gene in stem-like cells from each diseased tissue sample relative to stem-like cells in normal samples in each tissue plotted against the malignancy continuum. Samples are colored based on if they are from different disease stage.
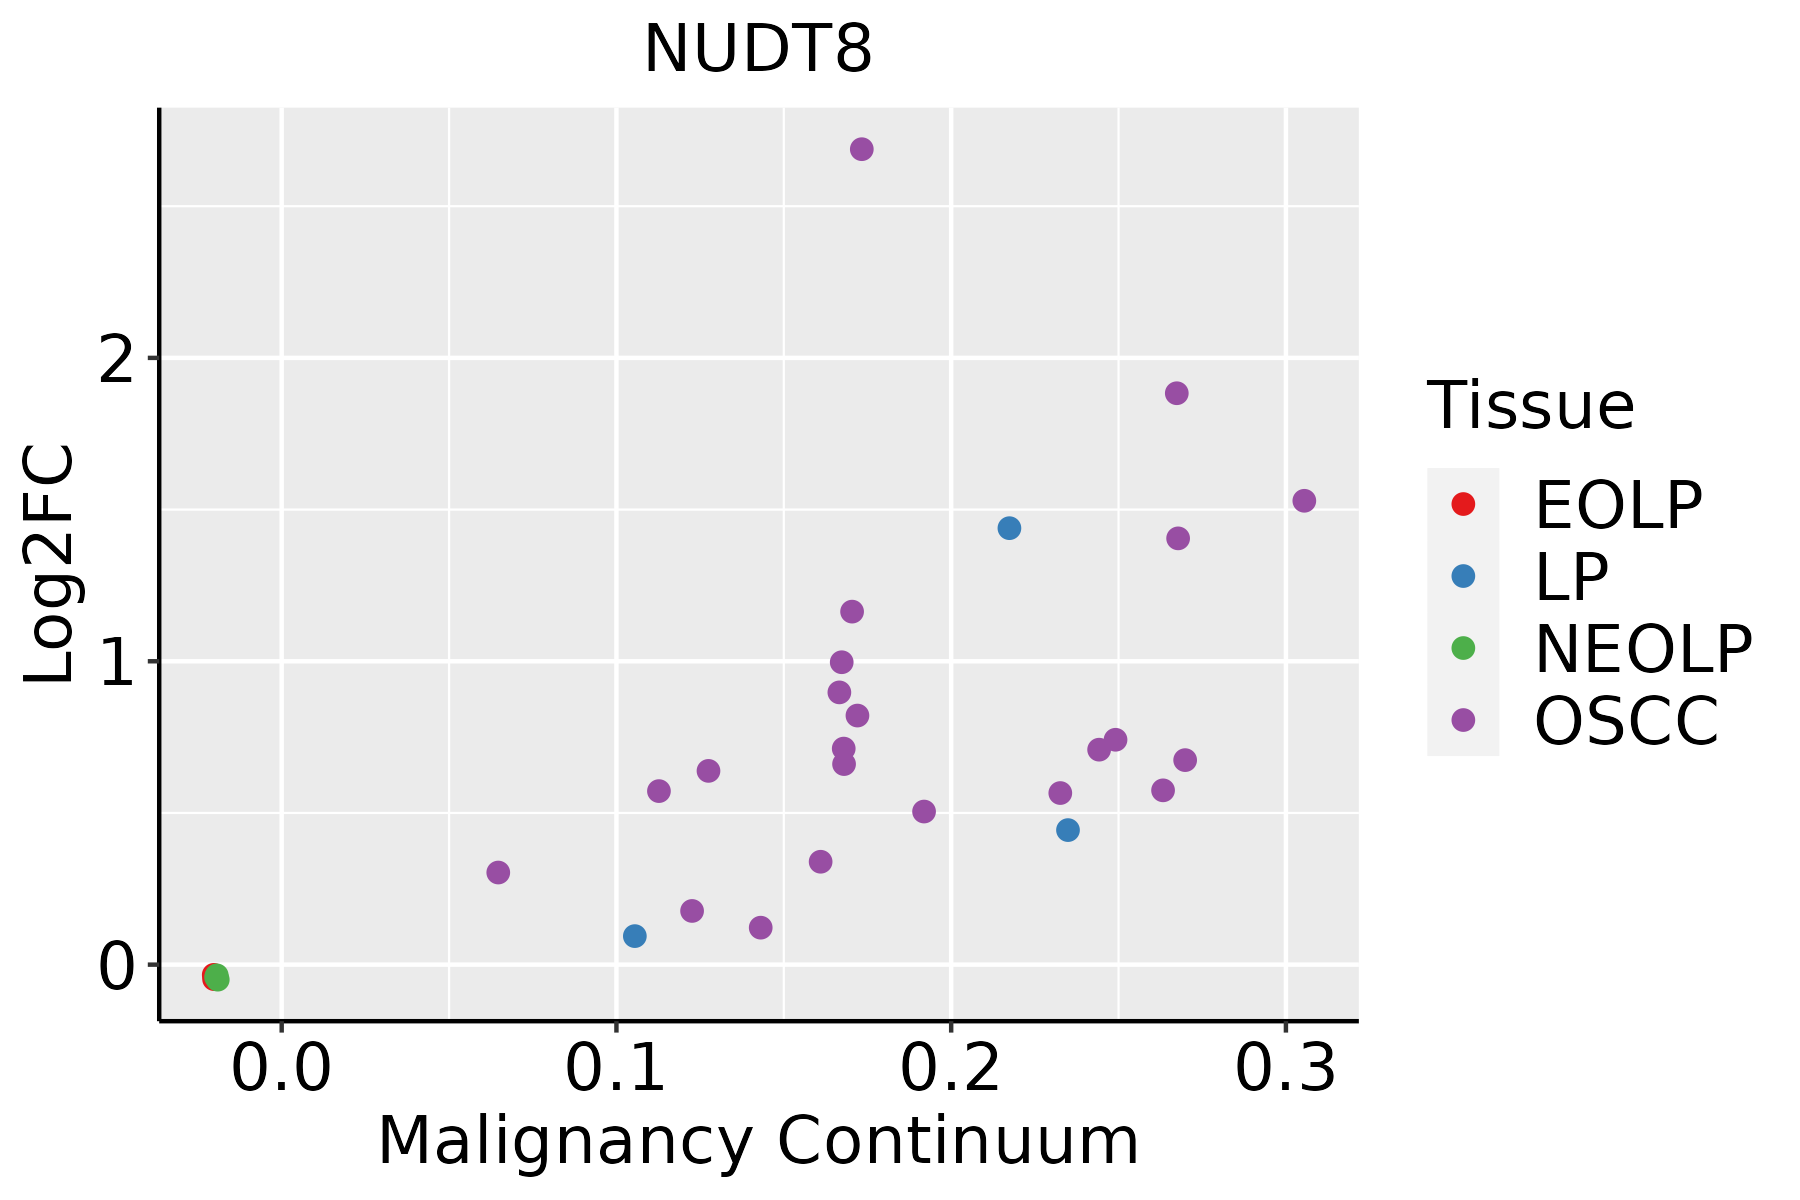
EOLP: Erosive Oral lichen planus
LP: leukoplakia
NEOLP: Non-erosive oral lichen planus
OSCC: Oral squamous cell carcinoma
ProstateThe image shows the transcriptomic changes along malignancy continuum.log2FC in expression of this searched gene in stem-like cells from each diseased tissue sample relative to stem-like cells in normal samples in each tissue plotted against the malignancy continuum. Samples are colored based on if they are from different disease stage.
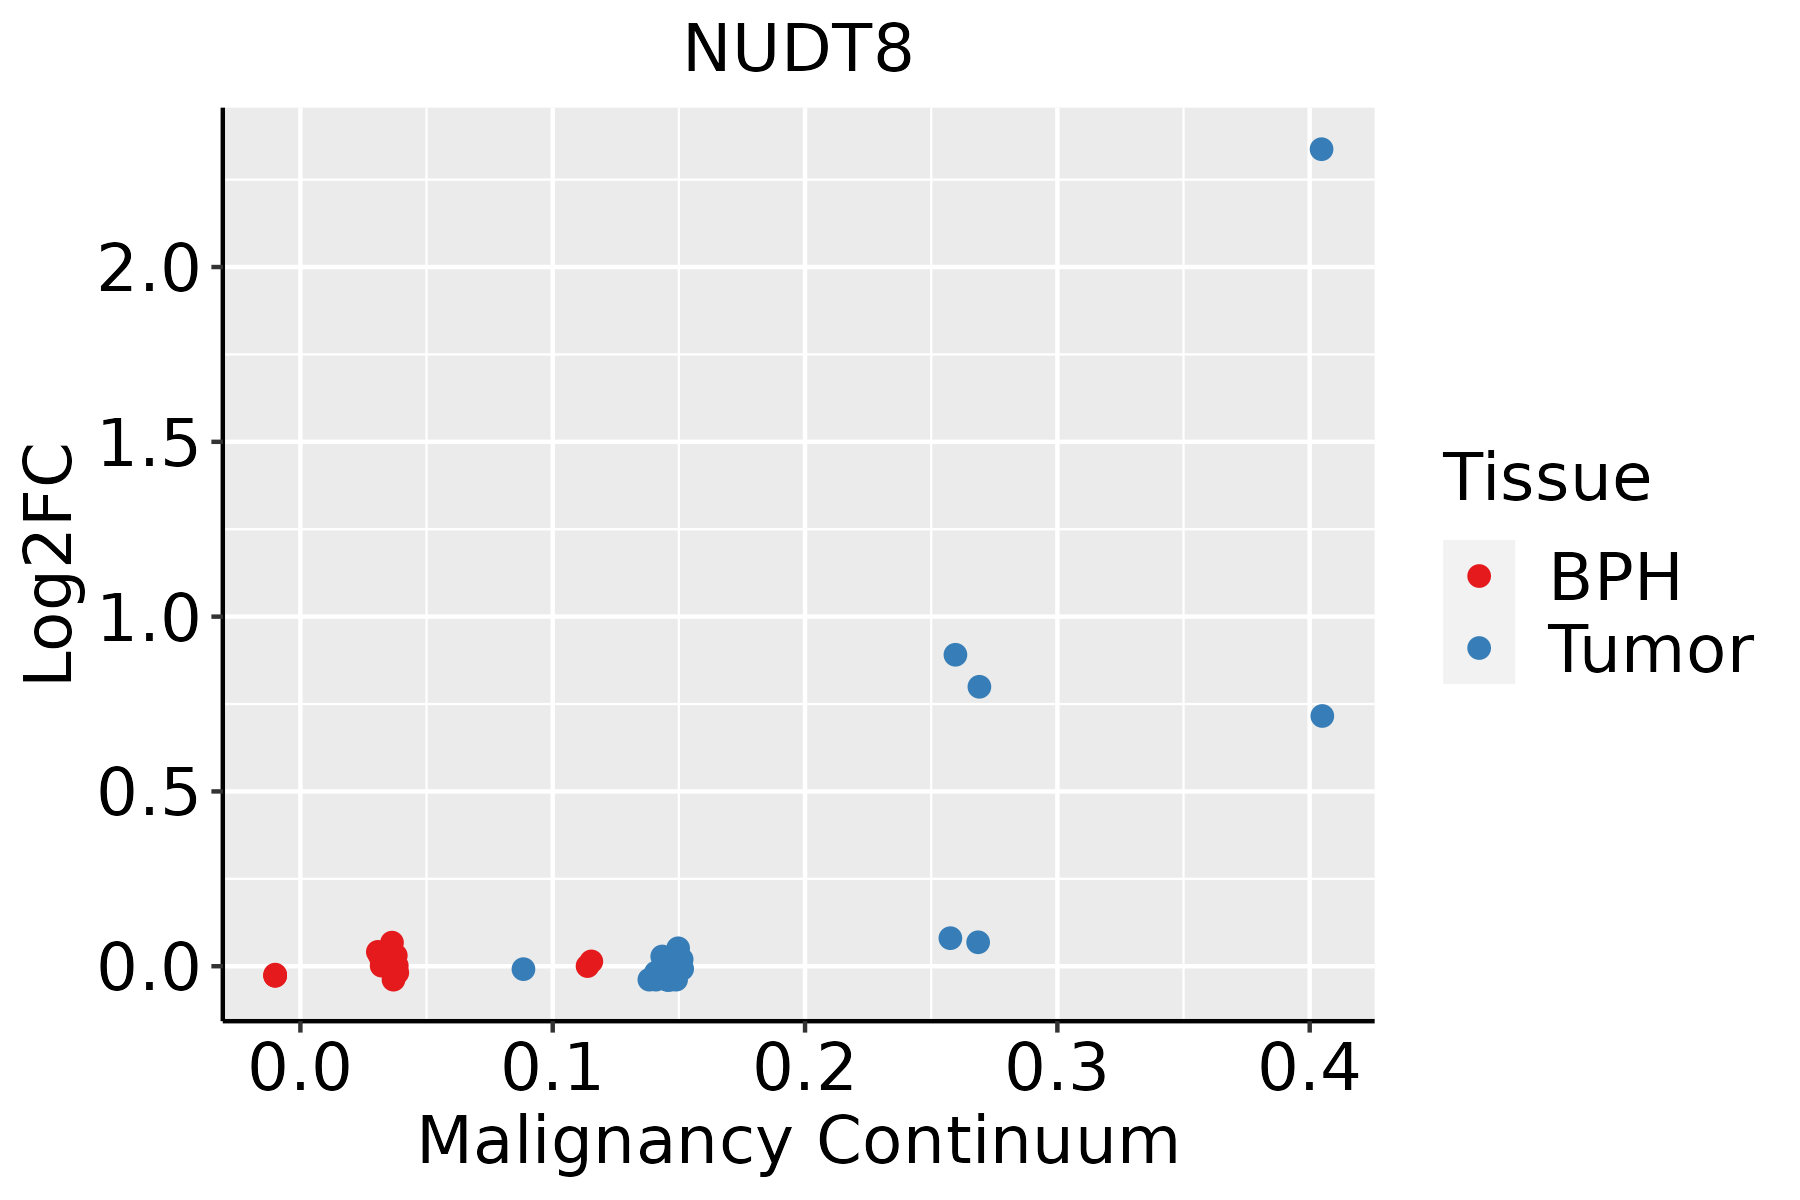
BPH: Benign Prostatic Hyperplasia
SkinThe image shows the transcriptomic changes along malignancy continuum.log2FC in expression of this searched gene in stem-like cells from each diseased tissue sample relative to stem-like cells in normal samples in each tissue plotted against the malignancy continuum. Samples are colored based on if they are from different disease stage.AK: Actinic keratosis
cSCC: Cutaneous squamous cell carcinoma
SCCIS:squamous cell carcinoma in situ
ThyroidThe image shows the transcriptomic changes along malignancy continuum.log2FC in expression of this searched gene in stem-like cells from each diseased tissue sample relative to stem-like cells in normal samples in each tissue plotted against the malignancy continuum. Samples are colored based on if they are from different disease stage.ATC: Anaplastic thyroid cancer
HT: Hashimoto's thyroiditis
PTC: Papillary thyroid cancer
∗log2FC in expression of this searched gene in stem-like cells from each diseased tissue sample relative to stem-like cells in normal samples in each tissue plotted against the malignancy continuum. Samples are colored based on if they are from different disease stage.

Top

Malignant transformation related pathway analysis

check buttonFind out the enriched GO biological processes and KEGG pathways involved in transition from healthy to precancer to cancer
check button Figure of enriched GO biological processes.
TissueDisease StageEnriched GO biological Processes
ColorectumADGO analysis - Figure of enriched GO biological processes: Top 15 enriched GO BP terms are showed in the bar plot of each disease state in each tissue. Each row represents a significant GO biological process which is colored according to the -log10(p.adjust).
ColorectumSERGO analysis - Figure of enriched GO biological processes: Top 15 enriched GO BP terms are showed in the bar plot of each disease state in each tissue. Each row represents a significant GO biological process which is colored according to the -log10(p.adjust).
ColorectumMSSGO analysis - Figure of enriched GO biological processes: Top 15 enriched GO BP terms are showed in the bar plot of each disease state in each tissue. Each row represents a significant GO biological process which is colored according to the -log10(p.adjust).
ColorectumMSI-HGO analysis - Figure of enriched GO biological processes: Top 15 enriched GO BP terms are showed in the bar plot of each disease state in each tissue. Each row represents a significant GO biological process which is colored according to the -log10(p.adjust).
ColorectumFAPGO analysis - Figure of enriched GO biological processes: Top 15 enriched GO BP terms are showed in the bar plot of each disease state in each tissue. Each row represents a significant GO biological process which is colored according to the -log10(p.adjust).
∗Top 15 enriched GO BP terms are showed in the bar plot of each disease state in each tissue. Each row represents a significant GO biological process which is colored according to the -log10(p.adjust).
Page: 1 2 3 4 5 6 7 8 9 

check button Enriched GO biological processes.
GO IDTissueDisease StageDescriptionGene RatioBg Ratiopvaluep.adjustCount
GO:00353372ProstateTumorfatty-acyl-CoA metabolic process14/324638/187233.24e-031.69e-0214
GO:0034655111SkincSCCnucleobase-containing compound catabolic process172/4864407/187234.11e-132.43e-11172
GO:0046700110SkincSCCheterocycle catabolic process178/4864445/187234.45e-112.13e-09178
GO:0044270110SkincSCCcellular nitrogen compound catabolic process179/4864451/187238.34e-113.79e-09179
GO:0019439110SkincSCCaromatic compound catabolic process183/4864467/187231.76e-107.68e-09183
GO:1901361110SkincSCCorganic cyclic compound catabolic process188/4864495/187231.92e-097.01e-08188
GO:0019693112SkincSCCribose phosphate metabolic process146/4864396/187239.28e-071.68e-05146
GO:000675324SkincSCCnucleoside phosphate metabolic process176/4864497/187231.55e-062.62e-05176
GO:000911724SkincSCCnucleotide metabolic process173/4864489/187232.03e-063.35e-05173
GO:0072521112SkincSCCpurine-containing compound metabolic process150/4864416/187232.88e-064.54e-05150
GO:0009259112SkincSCCribonucleotide metabolic process138/4864385/187231.00e-051.30e-04138
GO:0006163112SkincSCCpurine nucleotide metabolic process140/4864396/187231.93e-052.27e-04140
GO:0009150112SkincSCCpurine ribonucleotide metabolic process131/4864368/187232.42e-052.76e-04131
GO:00159362SkincSCCcoenzyme A metabolic process10/486418/187237.25e-033.44e-0210
GO:00060844SkincSCCacetyl-CoA metabolic process16/486435/187239.09e-034.16e-0216
GO:00091506StomachGCpurine ribonucleotide metabolic process56/1159368/187233.67e-105.39e-0856
GO:00061636StomachGCpurine nucleotide metabolic process58/1159396/187237.97e-101.11e-0758
GO:00092595StomachGCribonucleotide metabolic process56/1159385/187232.03e-092.69e-0756
GO:00725216StomachGCpurine-containing compound metabolic process58/1159416/187235.19e-095.76e-0758
GO:00196935StomachGCribose phosphate metabolic process56/1159396/187235.72e-096.22e-0756
Page: 1 2 3 4 5 6 7 8 9 10 11 12 

check button Enriched KEGG pathways.
Pathway IDTissueDisease StageDescriptionGene RatioBg Ratiopvaluep.adjustqvalueCount
Page: 1 

Top

Cell-cell communication analysis

check buttonIdentification of potential cell-cell interactions between two cell types and their ligand-receptor pairs for different disease states
LigandReceptorLRpairPathwayTissueDisease Stage
Page: 1 

Top

Single-cell gene regulatory network inference analysis

check buttonFind out the significant the regulons (TFs) and the target genes of each regulon across cell types for different disease states
TFCell TypeTissueDisease StageTarget GeneRSSRegulon Activity
∗The dot plots of a searched regulon are shown for all cell subpopulations in each disease state of each tissue based on the regulon specific score inferred using pySCENIC and by calculating the average expression.
Page: 1 

Top

Somatic mutation of malignant transformation related genes

check buttonAnnotation of somatic variants for genes involved in malignant transformation
Hugo SymbolVariant ClassVariant ClassificationdbSNP RSHGVScHGVSpHGVSp ShortSWISSPROTBIOTYPESIFTPolyPhenTumor Sample BarcodeTissueHistologySexAgeStageTherapy TypesDrugsOutcome
NUDT8SNVMissense_Mutationrs569654818c.643C>Tp.Arg215Cysp.R215CQ8WV74protein_codingtolerated_low_confidence(0.11)benign(0.012)TCGA-EA-A3HS-01Cervixcervical & endocervical cancerFemale<65I/IIUnknownUnknownSD
NUDT8SNVMissense_Mutationnovelc.530N>Tp.Arg177Leup.R177LQ8WV74protein_codingdeleterious(0)benign(0.357)TCGA-AJ-A3EK-01Endometriumuterine corpus endometrioid carcinomaFemale<65I/IIChemotherapycarboplatinCR
NUDT8SNVMissense_Mutationnovelc.580N>Ap.Ala194Thrp.A194TQ8WV74protein_codingtolerated(0.2)benign(0.236)TCGA-AP-A1DV-01Endometriumuterine corpus endometrioid carcinomaFemale<65I/IIUnknownUnknownSD
NUDT8SNVMissense_Mutationrs745587907c.235G>Cp.Val79Leup.V79LQ8WV74protein_codingtolerated(0.1)benign(0.068)TCGA-BG-A0VZ-01Endometriumuterine corpus endometrioid carcinomaFemale<65III/IVChemotherapycisplatinCR
NUDT8SNVMissense_Mutationrs201447359c.479N>Ap.Arg160Glnp.R160QQ8WV74protein_codingtolerated(1)benign(0)TCGA-BG-A222-01Endometriumuterine corpus endometrioid carcinomaFemale<65I/IIUnknownUnknownSD
NUDT8SNVMissense_Mutationnovelc.701N>Cp.Lys234Thrp.K234TQ8WV74protein_codingdeleterious_low_confidence(0)possibly_damaging(0.746)TCGA-EO-A3B0-01Endometriumuterine corpus endometrioid carcinomaFemale<65III/IVUnknownUnknownSD
NUDT8SNVMissense_Mutationnovelc.620G>Ap.Cys207Tyrp.C207YQ8WV74protein_codingtolerated_low_confidence(1)benign(0.014)TCGA-FI-A2D5-01Endometriumuterine corpus endometrioid carcinomaFemale<65III/IVChemotherapycarboplatinumPD
NUDT8SNVMissense_Mutationrs745587907c.235N>Cp.Val79Leup.V79LQ8WV74protein_codingtolerated(0.1)benign(0.068)TCGA-43-6770-01Lunglung squamous cell carcinomaFemale<65I/IIVaccinerecprame+as15SD
NUDT8SNVMissense_Mutationnovelc.77G>Tp.Arg26Leup.R26LQ8WV74protein_codingdeleterious(0.02)benign(0.326)TCGA-85-8352-01Lunglung squamous cell carcinomaMale>=65III/IVUnknownUnknownPD
NUDT8SNVMissense_Mutationnovelc.340N>Tp.Val114Leup.V114LQ8WV74protein_codingdeleterious(0.01)possibly_damaging(0.611)TCGA-85-A4JB-01Lunglung squamous cell carcinomaMale>=65I/IIChemotherapyunknownCR
Page: 1 2 

Top

Related drugs of malignant transformation related genes

check buttonIdentification of chemicals and drugs interact with genes involved in malignant transfromation
(DGIdb 4.0)
Entrez IDSymbolCategoryInteraction TypesDrug Claim NameDrug NamePMIDs
Page: 1