Schematic overview of the cellular and molecular mechanisms involved in the cancer progression, including the proposed cellular and molecular mechanisms in cancer cells trajectory. AT1: alveolar type 1 cells; AT2: alveolar type 2 cells; AAH: atypical adenomatous hyperplasia; AIS: adenocarcinoma in situ; MIA: minimally invasive adenocarcinoma; IA: invasive adenocarcinoma; EMT: epithelial-mesenchymal transition

Home

Download

Statistics

Help

Contact

Center for Computational Systems Medicine
leaf

Gene summary

leaf

Malignant transformation analysis

leaf

Malignant transformation related pathway analysis

leaf

Cell-cell communication analysis

leaf

Single-cell gene regulatory network inference analysis

leaf

Somatic mutation of malignant transformation related genes

leaf

Related drugs of malignant transformation related genes

Gene: NMB

Gene summary for NMB

check button Gene summary.

Gene informationSpeciesHuman
Gene symbol

NMB

Gene ID

4828

Gene nameneuromedin B
Gene AliasNMB
Cytomap15q25.2
Gene Typeprotein-coding
GO ID

GO:0006810

UniProtAcc

P08949


Top

Malignant transformation analysis

check button Identification of the aberrant gene expression in precancerous and cancerous lesions by comparing the gene expression of stem-like cells in diseased tissues with normal stem cells
check button Malignant transformation involving gene list.
Entrez IDSymbolReplicatesSpeciesOrganTissueAdj P-valueLog2FCMalignancy
4828NMBLZE4THumanEsophagusESCC4.10e-492.19e+000.0811
4828NMBLZE7THumanEsophagusESCC6.86e-076.66e-010.0667
4828NMBLZE20THumanEsophagusESCC3.35e-094.98e-010.0662
4828NMBLZE22THumanEsophagusESCC7.33e-108.66e-010.068
4828NMBLZE24THumanEsophagusESCC2.62e-073.64e-010.0596
4828NMBP1T-EHumanEsophagusESCC7.84e-106.11e-010.0875
4828NMBP2T-EHumanEsophagusESCC1.68e-142.94e-010.1177
4828NMBP4T-EHumanEsophagusESCC5.38e-631.97e+000.1323
4828NMBP5T-EHumanEsophagusESCC2.54e-236.82e-010.1327
4828NMBP8T-EHumanEsophagusESCC2.92e-275.41e-010.0889
4828NMBP9T-EHumanEsophagusESCC5.15e-611.65e+000.1131
4828NMBP10T-EHumanEsophagusESCC6.29e-133.09e-010.116
4828NMBP11T-EHumanEsophagusESCC1.08e-129.97e-010.1426
4828NMBP12T-EHumanEsophagusESCC1.54e-133.44e-010.1122
4828NMBP15T-EHumanEsophagusESCC1.58e-381.18e+000.1149
4828NMBP16T-EHumanEsophagusESCC1.06e-295.77e-010.1153
4828NMBP17T-EHumanEsophagusESCC1.13e-052.24e-010.1278
4828NMBP19T-EHumanEsophagusESCC6.56e-091.86e+000.1662
4828NMBP20T-EHumanEsophagusESCC6.95e-134.38e-010.1124
4828NMBP21T-EHumanEsophagusESCC5.48e-621.79e+000.1617
Page: 1 2 3 4 5 

check button Transcriptomic changes along malignancy continuum.
TissueExpression DynamicsAbbreviation
EsophagusThe image shows the transcriptomic changes along malignancy continuum.log2FC in expression of this searched gene in stem-like cells from each diseased tissue sample relative to stem-like cells in normal samples in each tissue plotted against the malignancy continuum. Samples are colored based on if they are from different disease stage.
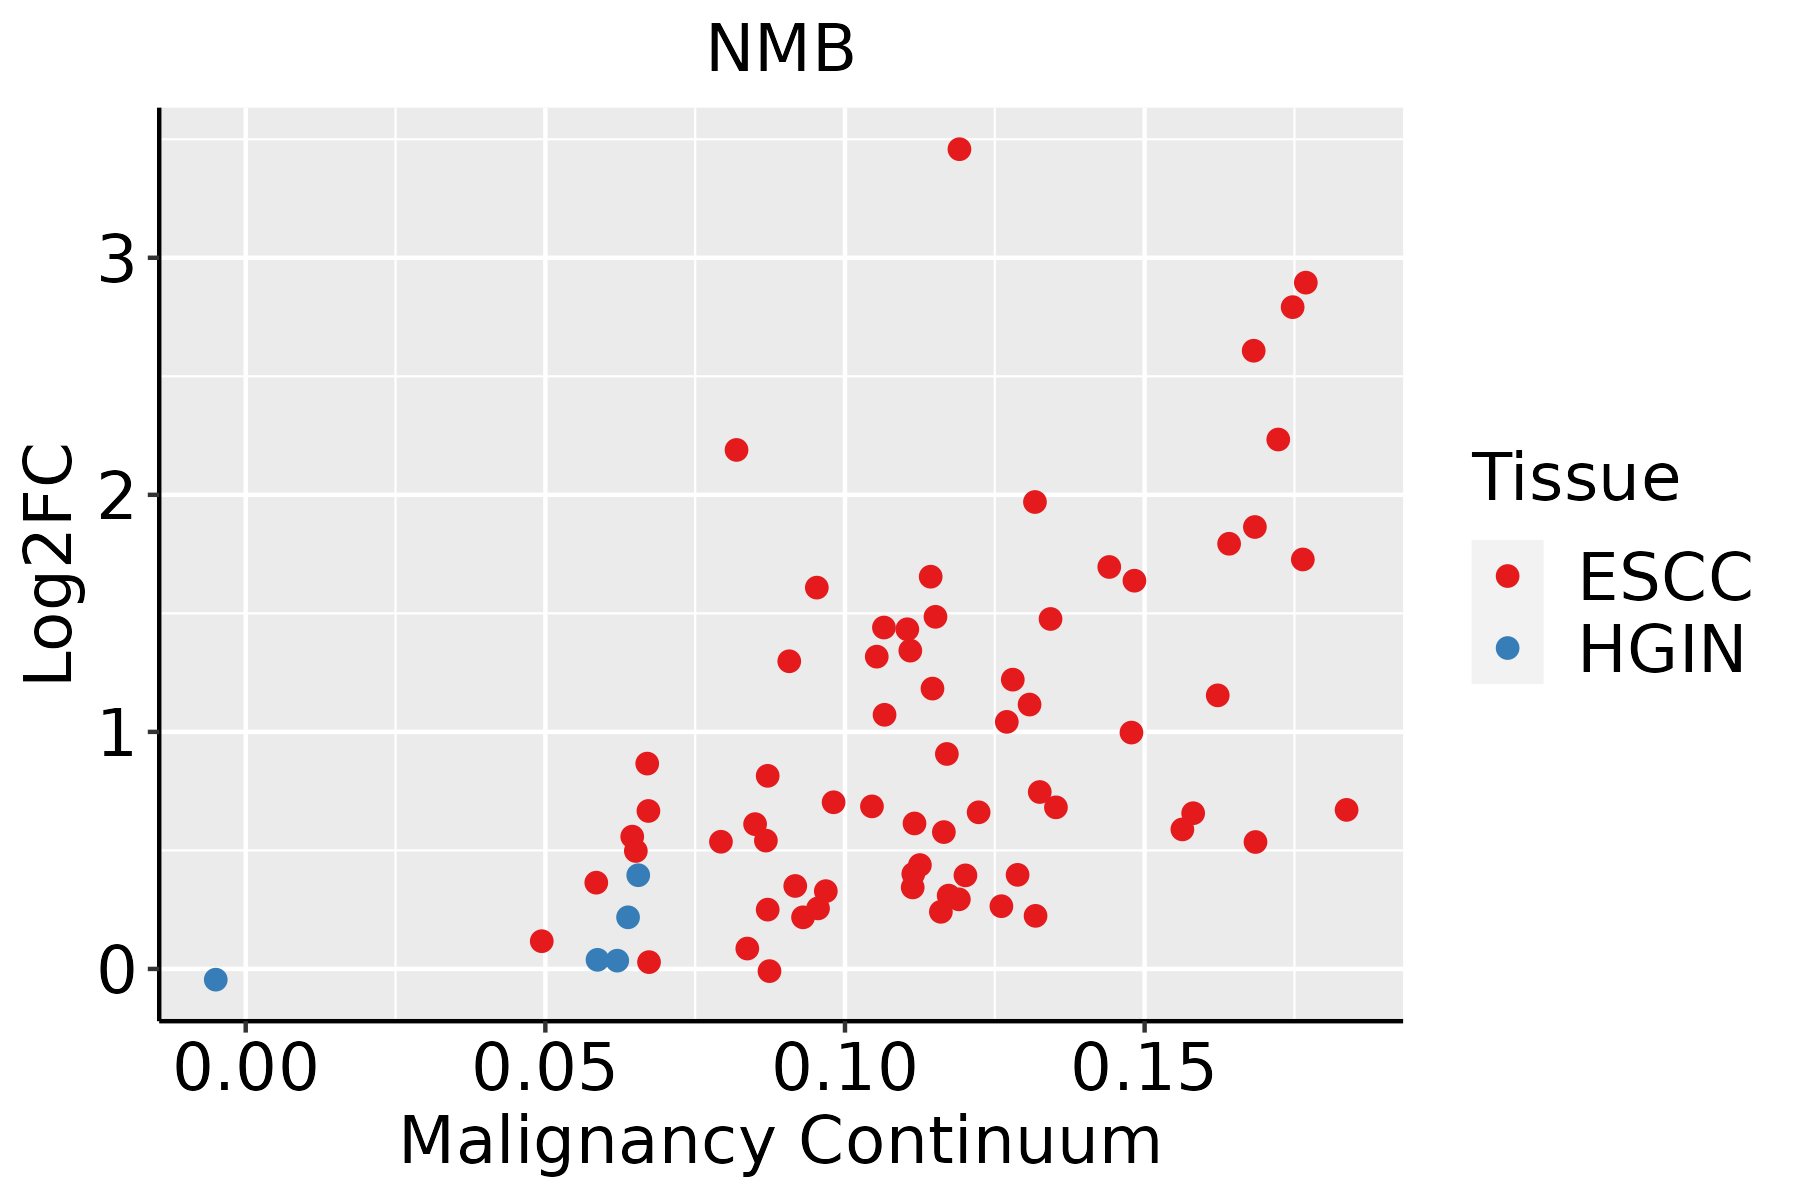
ESCC: Esophageal squamous cell carcinoma
HGIN: High-grade intraepithelial neoplasias
LGIN: Low-grade intraepithelial neoplasias
LiverThe image shows the transcriptomic changes along malignancy continuum.log2FC in expression of this searched gene in stem-like cells from each diseased tissue sample relative to stem-like cells in normal samples in each tissue plotted against the malignancy continuum. Samples are colored based on if they are from different disease stage.
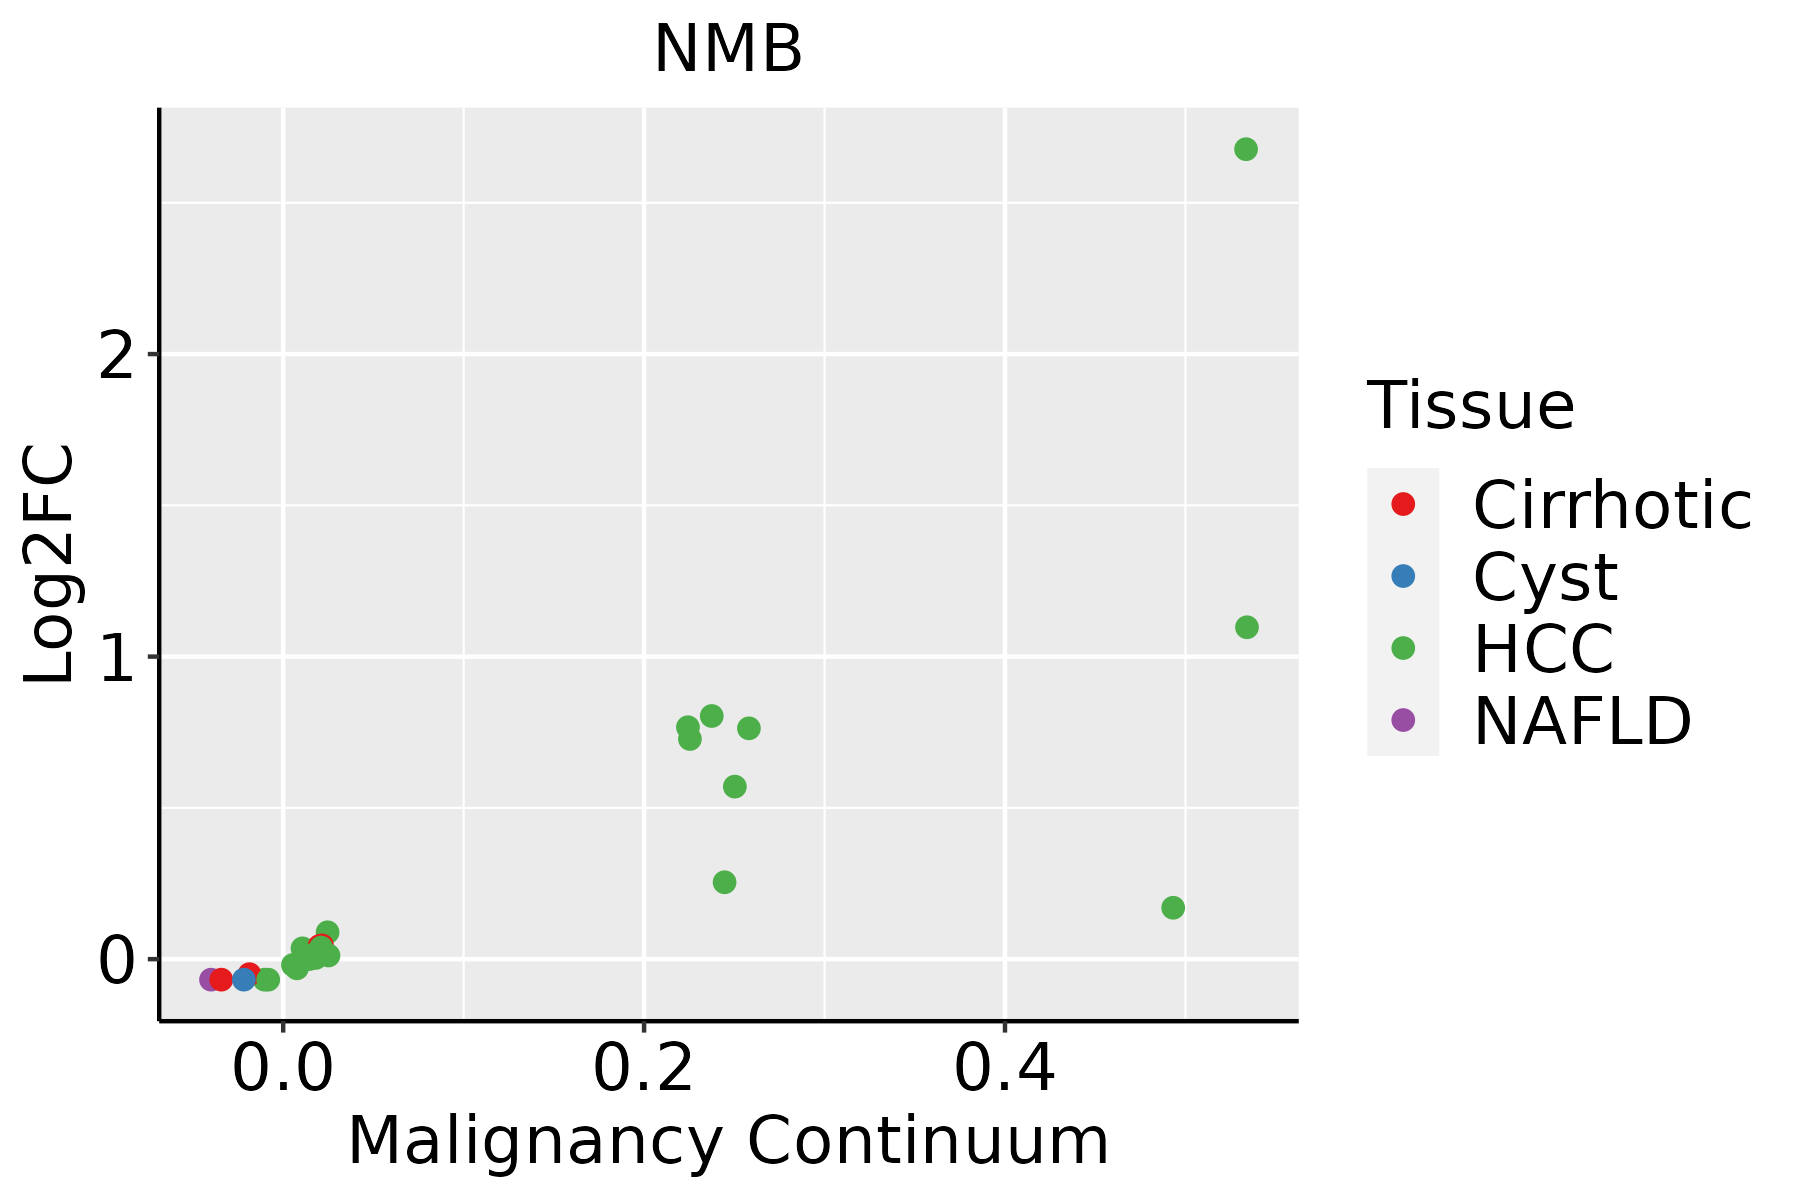
HCC: Hepatocellular carcinoma
NAFLD: Non-alcoholic fatty liver disease
Oral CavityThe image shows the transcriptomic changes along malignancy continuum.log2FC in expression of this searched gene in stem-like cells from each diseased tissue sample relative to stem-like cells in normal samples in each tissue plotted against the malignancy continuum. Samples are colored based on if they are from different disease stage.
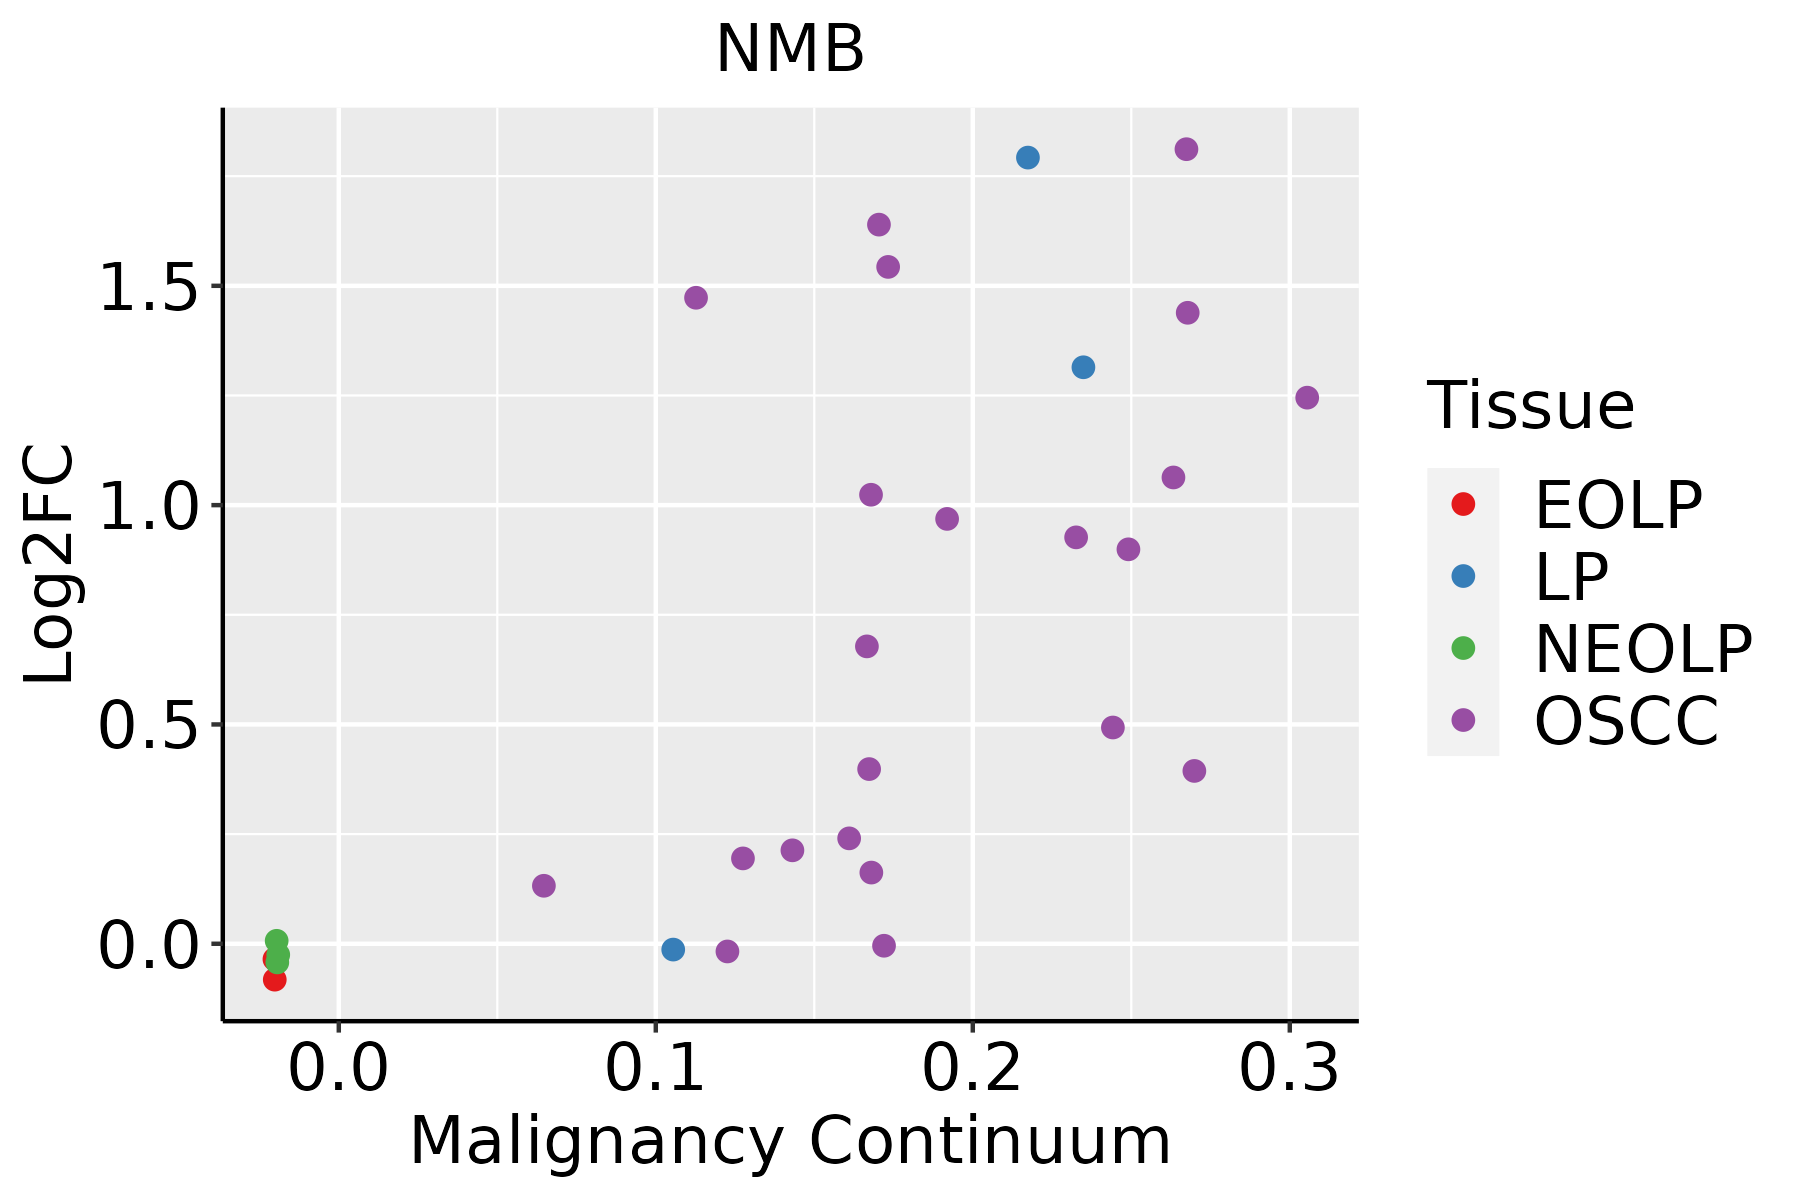
EOLP: Erosive Oral lichen planus
LP: leukoplakia
NEOLP: Non-erosive oral lichen planus
OSCC: Oral squamous cell carcinoma
SkinThe image shows the transcriptomic changes along malignancy continuum.log2FC in expression of this searched gene in stem-like cells from each diseased tissue sample relative to stem-like cells in normal samples in each tissue plotted against the malignancy continuum. Samples are colored based on if they are from different disease stage.
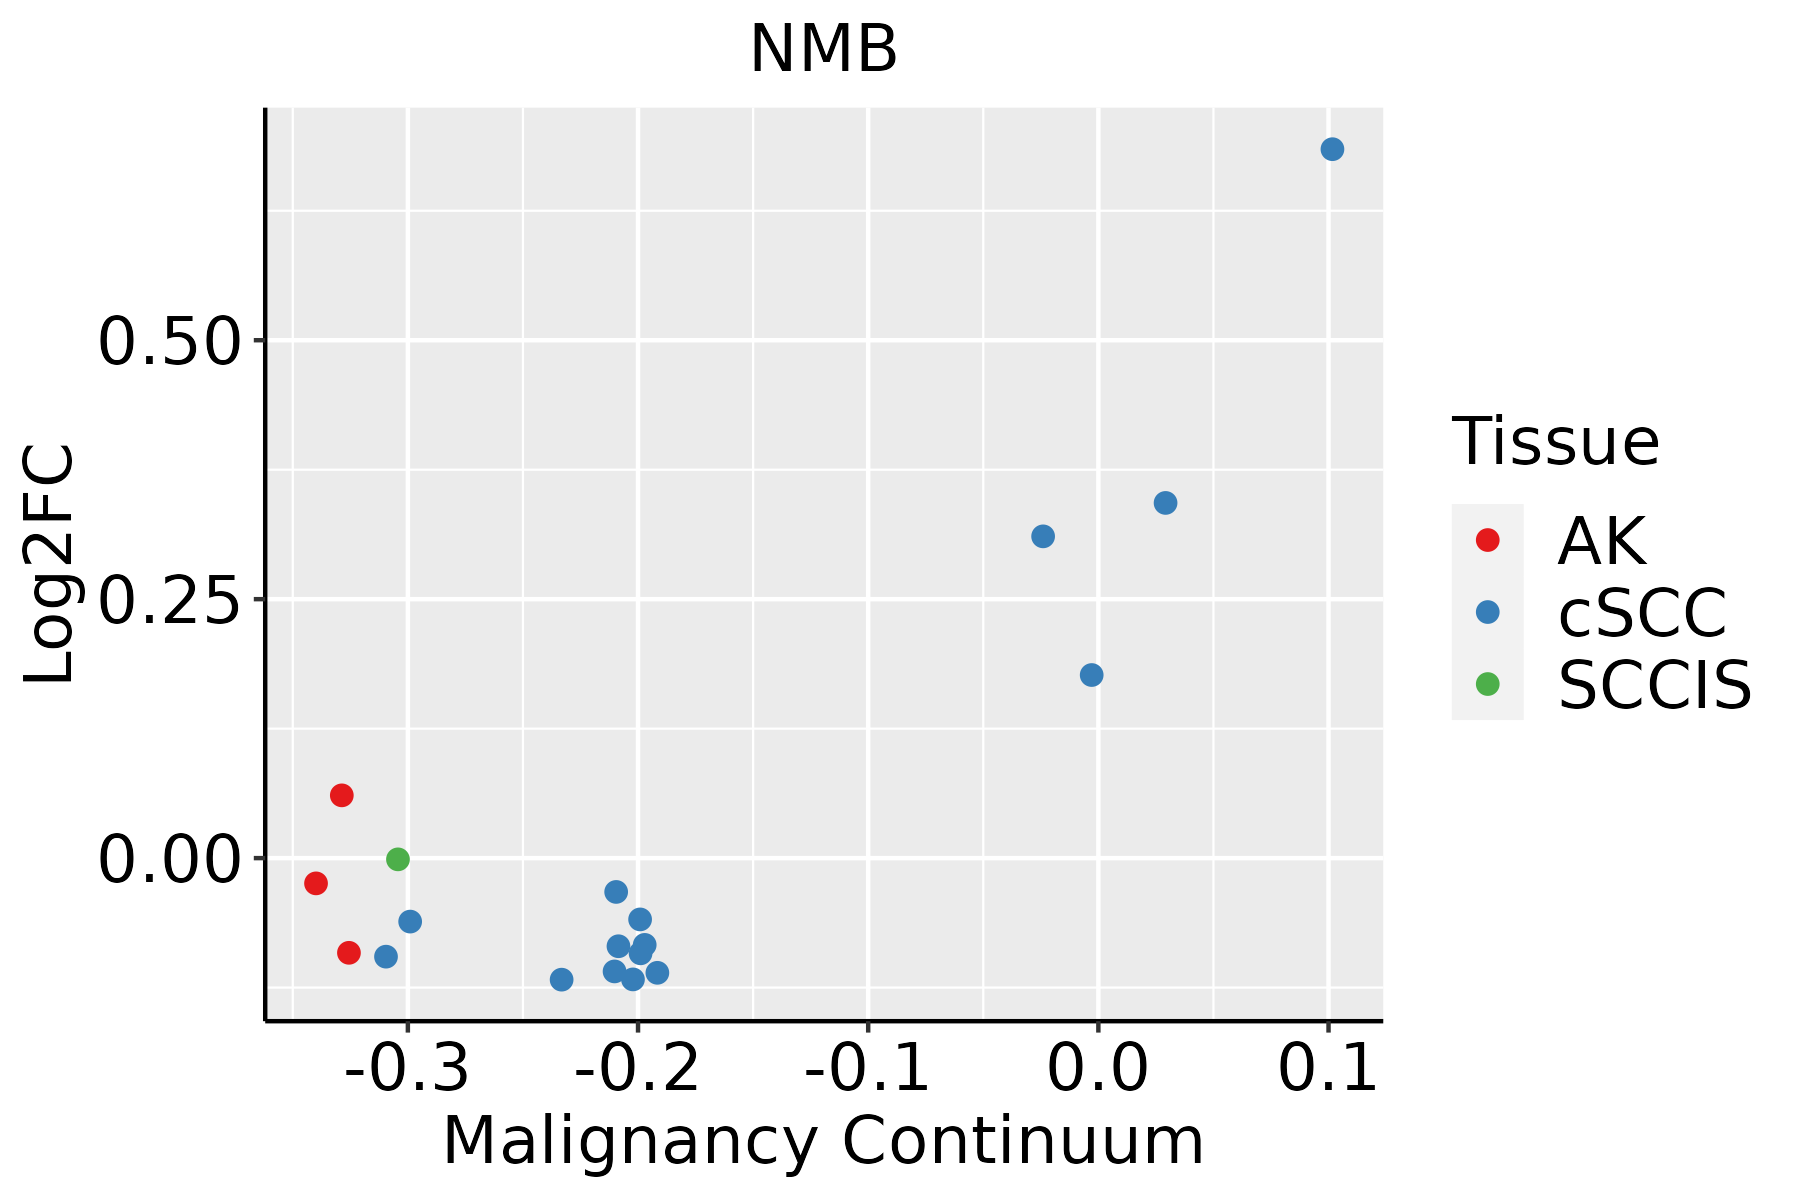
AK: Actinic keratosis
cSCC: Cutaneous squamous cell carcinoma
SCCIS:squamous cell carcinoma in situ
ThyroidThe image shows the transcriptomic changes along malignancy continuum.log2FC in expression of this searched gene in stem-like cells from each diseased tissue sample relative to stem-like cells in normal samples in each tissue plotted against the malignancy continuum. Samples are colored based on if they are from different disease stage.ATC: Anaplastic thyroid cancer
HT: Hashimoto's thyroiditis
PTC: Papillary thyroid cancer
∗log2FC in expression of this searched gene in stem-like cells from each diseased tissue sample relative to stem-like cells in normal samples in each tissue plotted against the malignancy continuum. Samples are colored based on if they are from different disease stage.

Top

Malignant transformation related pathway analysis

check buttonFind out the enriched GO biological processes and KEGG pathways involved in transition from healthy to precancer to cancer
check button Figure of enriched GO biological processes.
TissueDisease StageEnriched GO biological Processes
ColorectumADGO analysis - Figure of enriched GO biological processes: Top 15 enriched GO BP terms are showed in the bar plot of each disease state in each tissue. Each row represents a significant GO biological process which is colored according to the -log10(p.adjust).
ColorectumSERGO analysis - Figure of enriched GO biological processes: Top 15 enriched GO BP terms are showed in the bar plot of each disease state in each tissue. Each row represents a significant GO biological process which is colored according to the -log10(p.adjust).
ColorectumMSSGO analysis - Figure of enriched GO biological processes: Top 15 enriched GO BP terms are showed in the bar plot of each disease state in each tissue. Each row represents a significant GO biological process which is colored according to the -log10(p.adjust).
ColorectumMSI-HGO analysis - Figure of enriched GO biological processes: Top 15 enriched GO BP terms are showed in the bar plot of each disease state in each tissue. Each row represents a significant GO biological process which is colored according to the -log10(p.adjust).
ColorectumFAPGO analysis - Figure of enriched GO biological processes: Top 15 enriched GO BP terms are showed in the bar plot of each disease state in each tissue. Each row represents a significant GO biological process which is colored according to the -log10(p.adjust).
∗Top 15 enriched GO BP terms are showed in the bar plot of each disease state in each tissue. Each row represents a significant GO biological process which is colored according to the -log10(p.adjust).
Page: 1 2 3 4 5 6 7 8 9 

check button Enriched GO biological processes.
GO IDTissueDisease StageDescriptionGene RatioBg Ratiopvaluep.adjustCount
GO:19012156LiverCirrhoticnegative regulation of neuron death80/4634208/187237.55e-061.15e-0480
GO:00073463LiverCirrhoticregulation of mitotic cell cycle154/4634457/187238.73e-061.29e-04154
GO:00447721LiverCirrhoticmitotic cell cycle phase transition139/4634424/187231.02e-041.06e-03139
GO:00016495LiverCirrhoticosteoblast differentiation80/4634229/187233.39e-042.91e-0380
GO:1901990LiverCirrhoticregulation of mitotic cell cycle phase transition100/4634299/187234.13e-043.41e-03100
GO:00015035LiverCirrhoticossification127/4634408/187231.89e-031.19e-02127
GO:2000045LiverCirrhoticregulation of G1/S transition of mitotic cell cycle51/4634142/187231.91e-031.20e-0251
GO:00000821LiverCirrhoticG1/S transition of mitotic cell cycle72/4634214/187232.07e-031.28e-0272
GO:00487711LiverCirrhotictissue remodeling60/4634175/187232.86e-031.65e-0260
GO:00448431LiverCirrhoticcell cycle G1/S phase transition77/4634241/187236.68e-033.30e-0277
GO:00071624LiverCirrhoticnegative regulation of cell adhesion93/4634303/187231.06e-024.66e-0293
GO:00447722LiverHCCmitotic cell cycle phase transition240/7958424/187232.47e-096.84e-08240
GO:000734611LiverHCCregulation of mitotic cell cycle255/7958457/187234.96e-091.30e-07255
GO:001003822LiverHCCresponse to metal ion208/7958373/187231.35e-072.56e-06208
GO:007099722LiverHCCneuron death202/7958361/187231.44e-072.70e-06202
GO:190121412LiverHCCregulation of neuron death179/7958319/187235.65e-079.01e-06179
GO:19019901LiverHCCregulation of mitotic cell cycle phase transition167/7958299/187231.96e-062.71e-05167
GO:19019871LiverHCCregulation of cell cycle phase transition211/7958390/187232.11e-062.89e-05211
GO:0045786LiverHCCnegative regulation of cell cycle204/7958385/187231.84e-051.99e-04204
GO:00448432LiverHCCcell cycle G1/S phase transition134/7958241/187232.60e-052.70e-04134
Page: 1 2 3 4 5 6 7 8 9 10 11 12 13 14 15 16 17 18 

check button Enriched KEGG pathways.
Pathway IDTissueDisease StageDescriptionGene RatioBg Ratiopvaluep.adjustqvalueCount
Page: 1 

Top

Cell-cell communication analysis

check buttonIdentification of potential cell-cell interactions between two cell types and their ligand-receptor pairs for different disease states
LigandReceptorLRpairPathwayTissueDisease Stage
Page: 1 

Top

Single-cell gene regulatory network inference analysis

check buttonFind out the significant the regulons (TFs) and the target genes of each regulon across cell types for different disease states
TFCell TypeTissueDisease StageTarget GeneRSSRegulon Activity
∗The dot plots of a searched regulon are shown for all cell subpopulations in each disease state of each tissue based on the regulon specific score inferred using pySCENIC and by calculating the average expression.
Page: 1 

Top

Somatic mutation of malignant transformation related genes

check buttonAnnotation of somatic variants for genes involved in malignant transformation
Hugo SymbolVariant ClassVariant ClassificationdbSNP RSHGVScHGVSpHGVSp ShortSWISSPROTBIOTYPESIFTPolyPhenTumor Sample BarcodeTissueHistologySexAgeStageTherapy TypesDrugsOutcome
NMBinsertionFrame_Shift_Insnovelc.230_231insAGCATATAGTGTGTGCATTTTGAAGGGAp.Arg78AlafsTer19p.R78Afs*19P08949protein_codingTCGA-A2-A0CP-01Breastbreast invasive carcinomaFemale<65I/IIChemotherapycytoxanSD
NMBSNVMissense_Mutationc.365C>Ap.Pro122Glnp.P122QP08949protein_codingtolerated_low_confidence(0.25)benign(0.005)TCGA-G4-6309-01Colorectumcolon adenocarcinomaFemale<65III/IVChemotherapyxelodaPD
NMBSNVMissense_Mutationnovelc.384N>Cp.Gln128Hisp.Q128HP08949protein_codingtolerated_low_confidence(0.21)benign(0.138)TCGA-A5-A0G2-01Endometriumuterine corpus endometrioid carcinomaFemale<65III/IVUnknownUnknownSD
NMBSNVMissense_Mutationnovelc.418G>Tp.Val140Leup.V140LP08949protein_codingtolerated_low_confidence(0.59)benign(0.001)TCGA-AJ-A3BG-01Endometriumuterine corpus endometrioid carcinomaFemale>=65I/IIChemotherapycarboplatinPD
NMBSNVMissense_Mutationc.341N>Ap.Gly114Aspp.G114DP08949protein_codingtolerated_low_confidence(0.12)benign(0.058)TCGA-BS-A0U7-01Endometriumuterine corpus endometrioid carcinomaFemale<65I/IIUnknownUnknownSD
NMBSNVMissense_Mutationc.406N>Ap.His136Asnp.H136NP08949protein_codingtolerated_low_confidence(0.05)benign(0.015)TCGA-D1-A0ZS-01Endometriumuterine corpus endometrioid carcinomaFemale<65I/IIUnknownUnknownSD
NMBSNVMissense_Mutationc.388C>Tp.Arg130Cysp.R130CP08949protein_codingtolerated_low_confidence(0.05)benign(0.003)TCGA-D1-A103-01Endometriumuterine corpus endometrioid carcinomaFemale>=65I/IIUnknownUnknownSD
NMBSNVMissense_Mutationnovelc.455G>Ap.Cys152Tyrp.C152YP08949protein_codingdeleterious_low_confidence(0.02)benign(0.01)TCGA-22-1002-01Lunglung squamous cell carcinomaMale>=65I/IIUnknownUnknownSD
NMBSNVMissense_Mutationnovelc.83G>Ap.Ser28Asnp.S28NP08949protein_codingtolerated(0.13)benign(0.006)TCGA-CN-5373-01Oral cavityhead & neck squamous cell carcinomaFemale<65I/IIUnknownUnknownSD
NMBSNVMissense_Mutationnovelc.289G>Cp.Ala97Prop.A97PP08949protein_codingdeleterious(0.02)possibly_damaging(0.735)TCGA-CR-7364-01Oral cavityhead & neck squamous cell carcinomaMale>=65III/IVUnknownUnknownSD
Page: 1 2 

Top

Related drugs of malignant transformation related genes

check buttonIdentification of chemicals and drugs interact with genes involved in malignant transfromation
(DGIdb 4.0)
Entrez IDSymbolCategoryInteraction TypesDrug Claim NameDrug NamePMIDs
Page: 1