
|
|||||
|
 | |
| |
| |
| |
| |
| |
|
Gene: NKX3-1 |
Gene summary for NKX3-1 |
| Gene information | Species | Human | Gene symbol | NKX3-1 | Gene ID | 4824 |
| Gene name | NK3 homeobox 1 | |
| Gene Alias | BAPX2 | |
| Cytomap | 8p21.2 | |
| Gene Type | protein-coding | GO ID | GO:0000003 | UniProtAcc | Q99801 |
Top |
Malignant transformation analysis |
| Identification of the aberrant gene expression in precancerous and cancerous lesions by comparing the gene expression of stem-like cells in diseased tissues with normal stem cells |
| Entrez ID | Symbol | Replicates | Species | Organ | Tissue | Adj P-value | Log2FC | Malignancy |
| 4824 | NKX3-1 | M5 | Human | Breast | IDC | 7.60e-20 | 1.09e+00 | 0.1598 |
| 4824 | NKX3-1 | DCIS2 | Human | Breast | DCIS | 8.16e-16 | 8.40e-02 | 0.0085 |
| 4824 | NKX3-1 | GSM5252128_BPH327PrGF_Via | Human | Prostate | BPH | 4.24e-11 | 6.90e-01 | -0.1688 |
| 4824 | NKX3-1 | GSM5252132_BPH389PrGF | Human | Prostate | BPH | 5.00e-03 | 6.25e-01 | -0.2247 |
| 4824 | NKX3-1 | GSM5252136_BPH556PrGA1_Fcol | Human | Prostate | BPH | 4.59e-13 | 7.69e-01 | -0.23 |
| 4824 | NKX3-1 | GSM5252137_BPH556PrGA2_Fcol | Human | Prostate | BPH | 3.27e-06 | 6.72e-01 | -0.23 |
| 4824 | NKX3-1 | 047563_1562-all-cells | Human | Prostate | BPH | 4.70e-03 | -5.99e-02 | 0.0791 |
| 4824 | NKX3-1 | 048752_1579-all-cells | Human | Prostate | BPH | 3.81e-02 | 1.24e-01 | 0.1008 |
| 4824 | NKX3-1 | Dong_P1 | Human | Prostate | Tumor | 4.22e-19 | 3.16e-01 | 0.035 |
| 4824 | NKX3-1 | Dong_P3 | Human | Prostate | Tumor | 3.26e-11 | 2.43e-01 | 0.0278 |
| 4824 | NKX3-1 | Dong_P5 | Human | Prostate | Tumor | 2.33e-09 | -1.83e-01 | 0.053 |
| 4824 | NKX3-1 | GSM5353215_PA_AUG_PB_1B_S2 | Human | Prostate | Tumor | 3.42e-10 | 8.94e-01 | 0.1557 |
| 4824 | NKX3-1 | GSM5353236_PA_PR5251_T1_S7_L001 | Human | Prostate | Tumor | 3.53e-03 | 5.90e-01 | 0.1608 |
| 4824 | NKX3-1 | GSM5353237_PA_PR5251_T2_S8_L001 | Human | Prostate | Tumor | 2.98e-02 | 7.04e-01 | 0.1622 |
| 4824 | NKX3-1 | GSM5353243_PA_PR5261_T1_S23_L002 | Human | Prostate | Tumor | 6.14e-09 | 2.93e-01 | 0.1545 |
| 4824 | NKX3-1 | GSM5353244_PA_PR5261_T2_S24_L002 | Human | Prostate | Tumor | 7.39e-06 | 3.95e-01 | 0.1569 |
| Page: 1 |
| Tissue | Expression Dynamics | Abbreviation |
| Breast |  | IDC: Invasive ductal carcinoma |
| DCIS: Ductal carcinoma in situ | ||
| Precancer(BRCA1-mut): Precancerous lesion from BRCA1 mutation carriers | ||
| Prostate | 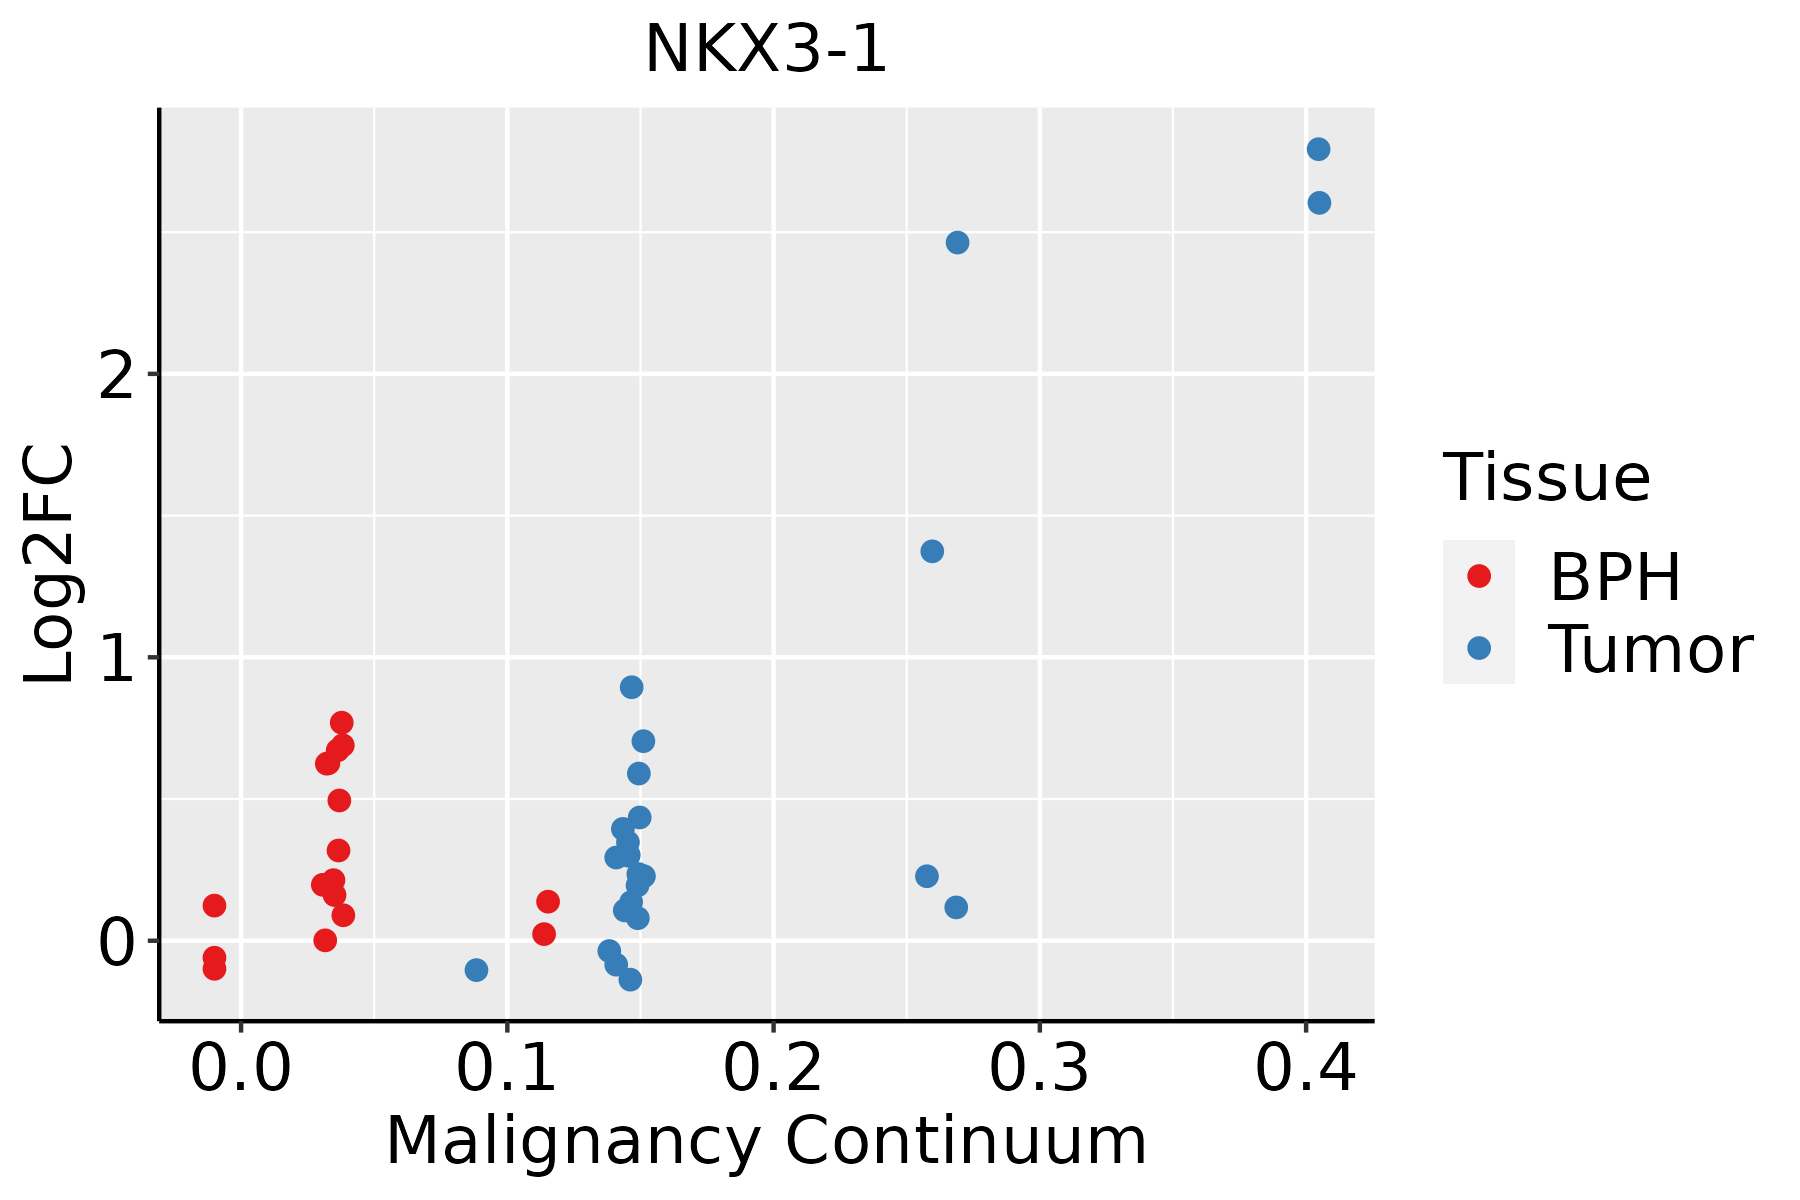 | BPH: Benign Prostatic Hyperplasia |
| ∗log2FC in expression of this searched gene in stem-like cells from each diseased tissue sample relative to stem-like cells in normal samples in each tissue plotted against the malignancy continuum. Samples are colored based on if they are from different disease stage. |
Top |
Malignant transformation related pathway analysis |
| Find out the enriched GO biological processes and KEGG pathways involved in transition from healthy to precancer to cancer |
| Tissue | Disease Stage | Enriched GO biological Processes |
| Colorectum | AD |  |
| Colorectum | SER |  |
| Colorectum | MSS |  |
| Colorectum | MSI-H |  |
| Colorectum | FAP |  |
| ∗Top 15 enriched GO BP terms are showed in the bar plot of each disease state in each tissue. Each row represents a significant GO biological process which is colored according to the -log10(p.adjust). |
| Page: 1 2 3 4 5 6 7 8 9 |
| GO ID | Tissue | Disease Stage | Description | Gene Ratio | Bg Ratio | pvalue | p.adjust | Count |
| GO:200123319 | Prostate | Tumor | regulation of apoptotic signaling pathway | 137/3246 | 356/18723 | 1.01e-21 | 1.25e-18 | 137 |
| GO:009719319 | Prostate | Tumor | intrinsic apoptotic signaling pathway | 113/3246 | 288/18723 | 6.79e-19 | 2.64e-16 | 113 |
| GO:200124219 | Prostate | Tumor | regulation of intrinsic apoptotic signaling pathway | 72/3246 | 164/18723 | 1.63e-15 | 2.81e-13 | 72 |
| GO:004854519 | Prostate | Tumor | response to steroid hormone | 118/3246 | 339/18723 | 4.46e-15 | 6.94e-13 | 118 |
| GO:004586219 | Prostate | Tumor | positive regulation of proteolysis | 124/3246 | 372/18723 | 3.46e-14 | 4.31e-12 | 124 |
| GO:006145816 | Prostate | Tumor | reproductive system development | 133/3246 | 427/18723 | 1.24e-12 | 1.15e-10 | 133 |
| GO:004860815 | Prostate | Tumor | reproductive structure development | 131/3246 | 424/18723 | 3.48e-12 | 2.89e-10 | 131 |
| GO:007138317 | Prostate | Tumor | cellular response to steroid hormone stimulus | 76/3246 | 204/18723 | 7.73e-12 | 6.16e-10 | 76 |
| GO:004873219 | Prostate | Tumor | gland development | 132/3246 | 436/18723 | 1.40e-11 | 1.04e-09 | 132 |
| GO:005254719 | Prostate | Tumor | regulation of peptidase activity | 137/3246 | 461/18723 | 2.48e-11 | 1.71e-09 | 137 |
| GO:004328119 | Prostate | Tumor | regulation of cysteine-type endopeptidase activity involved in apoptotic process | 74/3246 | 209/18723 | 2.29e-10 | 1.33e-08 | 74 |
| GO:190165418 | Prostate | Tumor | response to ketone | 70/3246 | 194/18723 | 2.69e-10 | 1.48e-08 | 70 |
| GO:005254819 | Prostate | Tumor | regulation of endopeptidase activity | 126/3246 | 432/18723 | 5.86e-10 | 3.01e-08 | 126 |
| GO:200123517 | Prostate | Tumor | positive regulation of apoptotic signaling pathway | 51/3246 | 126/18723 | 7.27e-10 | 3.59e-08 | 51 |
| GO:200011619 | Prostate | Tumor | regulation of cysteine-type endopeptidase activity | 79/3246 | 235/18723 | 9.68e-10 | 4.66e-08 | 79 |
| GO:005067316 | Prostate | Tumor | epithelial cell proliferation | 125/3246 | 437/18723 | 2.56e-09 | 1.08e-07 | 125 |
| GO:001095219 | Prostate | Tumor | positive regulation of peptidase activity | 68/3246 | 197/18723 | 4.09e-09 | 1.66e-07 | 68 |
| GO:002261213 | Prostate | Tumor | gland morphogenesis | 47/3246 | 118/18723 | 6.18e-09 | 2.42e-07 | 47 |
| GO:005067815 | Prostate | Tumor | regulation of epithelial cell proliferation | 110/3246 | 381/18723 | 1.32e-08 | 4.82e-07 | 110 |
| GO:007048218 | Prostate | Tumor | response to oxygen levels | 102/3246 | 347/18723 | 1.62e-08 | 5.75e-07 | 102 |
| Page: 1 2 3 4 5 6 7 8 9 10 11 12 13 |
| Pathway ID | Tissue | Disease Stage | Description | Gene Ratio | Bg Ratio | pvalue | p.adjust | qvalue | Count |
| hsa052159 | Prostate | BPH | Prostate cancer | 48/1718 | 97/8465 | 1.08e-10 | 1.87e-09 | 1.16e-09 | 48 |
| hsa0521514 | Prostate | BPH | Prostate cancer | 48/1718 | 97/8465 | 1.08e-10 | 1.87e-09 | 1.16e-09 | 48 |
| hsa0521523 | Prostate | Tumor | Prostate cancer | 48/1791 | 97/8465 | 4.86e-10 | 8.93e-09 | 5.54e-09 | 48 |
| hsa0521533 | Prostate | Tumor | Prostate cancer | 48/1791 | 97/8465 | 4.86e-10 | 8.93e-09 | 5.54e-09 | 48 |
| Page: 1 |
Top |
Cell-cell communication analysis |
| Identification of potential cell-cell interactions between two cell types and their ligand-receptor pairs for different disease states |
| Ligand | Receptor | LRpair | Pathway | Tissue | Disease Stage |
| Page: 1 |
Top |
Single-cell gene regulatory network inference analysis |
| Find out the significant the regulons (TFs) and the target genes of each regulon across cell types for different disease states |
| TF | Cell Type | Tissue | Disease Stage | Target Gene | RSS | Regulon Activity |
| NKX3-1 | SEC | Liver | HCC | RP11-242D8.1,PIGA,HSPA1B, etc. | 1.89e-01 |  |
| NKX3-1 | LUM | Prostate | Healthy | NPDC1,SPDEF,STEAP2, etc. | 2.72e-01 |  |
| NKX3-1 | pDC | Prostate | ADJ | RDH11,STEAP2,KLK2, etc. | 2.24e-01 |  |
| NKX3-1 | pDC | Prostate | Tumor | RDH11,STEAP2,KLK2, etc. | 2.16e-01 |  |
| NKX3-1 | FIB | Prostate | Tumor | PMEPA1,SLC45A3,PPP3CA, etc. | 5.17e-01 | |
| ∗The dot plots of a searched regulon are shown for all cell subpopulations in each disease state of each tissue based on the regulon specific score inferred using pySCENIC and by calculating the average expression. |
| Page: 1 |
Top |
Somatic mutation of malignant transformation related genes |
| Annotation of somatic variants for genes involved in malignant transformation |
| Hugo Symbol | Variant Class | Variant Classification | dbSNP RS | HGVSc | HGVSp | HGVSp Short | SWISSPROT | BIOTYPE | SIFT | PolyPhen | Tumor Sample Barcode | Tissue | Histology | Sex | Age | Stage | Therapy Types | Drugs | Outcome |
| NKX3-1 | SNV | Missense_Mutation | novel | c.464C>A | p.Ala155Asp | p.A155D | Q99801 | protein_coding | deleterious(0) | probably_damaging(0.995) | TCGA-A2-A25A-01 | Breast | breast invasive carcinoma | Female | <65 | I/II | Unspecific | Cytoxan | SD |
| NKX3-1 | SNV | Missense_Mutation | c.538N>G | p.Lys180Glu | p.K180E | Q99801 | protein_coding | deleterious(0) | probably_damaging(1) | TCGA-A8-A09Z-01 | Breast | breast invasive carcinoma | Female | >=65 | I/II | Unknown | Unknown | SD | |
| NKX3-1 | SNV | Missense_Mutation | c.591N>C | p.Leu197Phe | p.L197F | Q99801 | protein_coding | tolerated(0.05) | benign(0.352) | TCGA-BH-A0BZ-01 | Breast | breast invasive carcinoma | Female | <65 | III/IV | Chemotherapy | doxorubicin | CR | |
| NKX3-1 | insertion | Nonsense_Mutation | novel | c.319_320insTAAAAGAGAGGGGCAAATA | p.Glu107ValfsTer7 | p.E107Vfs*7 | Q99801 | protein_coding | TCGA-B6-A0IN-01 | Breast | breast invasive carcinoma | Female | <65 | I/II | Unknown | Unknown | PD | ||
| NKX3-1 | SNV | Missense_Mutation | c.526N>T | p.Arg176Cys | p.R176C | Q99801 | protein_coding | deleterious(0) | probably_damaging(1) | TCGA-AA-A02O-01 | Colorectum | colon adenocarcinoma | Male | >=65 | I/II | Unknown | Unknown | SD | |
| NKX3-1 | SNV | Missense_Mutation | rs759016206 | c.340N>T | p.Pro114Ser | p.P114S | Q99801 | protein_coding | tolerated(0.1) | benign(0.009) | TCGA-CA-6717-01 | Colorectum | colon adenocarcinoma | Male | <65 | I/II | Chemotherapy | oxaliplatin | CR |
| NKX3-1 | SNV | Missense_Mutation | c.550N>A | p.Leu184Ile | p.L184I | Q99801 | protein_coding | tolerated(0.1) | benign(0.341) | TCGA-DY-A0XA-01 | Colorectum | rectum adenocarcinoma | Female | <65 | I/II | Chemotherapy | mayo | CR | |
| NKX3-1 | SNV | Missense_Mutation | novel | c.334N>A | p.Ala112Thr | p.A112T | Q99801 | protein_coding | tolerated(0.37) | benign(0.001) | TCGA-AJ-A3EL-01 | Endometrium | uterine corpus endometrioid carcinoma | Female | <65 | I/II | Unknown | Unknown | SD |
| NKX3-1 | SNV | Missense_Mutation | c.542G>A | p.Arg181Gln | p.R181Q | Q99801 | protein_coding | deleterious(0) | probably_damaging(0.998) | TCGA-AJ-A5DW-01 | Endometrium | uterine corpus endometrioid carcinoma | Female | <65 | I/II | Unknown | Unknown | SD | |
| NKX3-1 | SNV | Missense_Mutation | c.511N>G | p.Trp171Gly | p.W171G | Q99801 | protein_coding | deleterious(0) | probably_damaging(1) | TCGA-AX-A06F-01 | Endometrium | uterine corpus endometrioid carcinoma | Female | <65 | III/IV | Chemotherapy | carboplatin | SD |
| Page: 1 2 3 |
Top |
Related drugs of malignant transformation related genes |
| Identification of chemicals and drugs interact with genes involved in malignant transfromation |
| (DGIdb 4.0) |
| Entrez ID | Symbol | Category | Interaction Types | Drug Claim Name | Drug Name | PMIDs |
| Page: 1 |

Copyright 2023-Present -The University of Texas Health Science Center at Houston |