
|
|||||
|
 | |
| |
| |
| |
| |
| |
|
Gene: NDE1 |
Gene summary for NDE1 |
| Gene information | Species | Human | Gene symbol | NDE1 | Gene ID | 54820 |
| Gene name | nudE neurodevelopment protein 1 | |
| Gene Alias | HOM-TES-87 | |
| Cytomap | 16p13.11 | |
| Gene Type | protein-coding | GO ID | GO:0000132 | UniProtAcc | Q9NXR1 |
Top |
Malignant transformation analysis |
| Identification of the aberrant gene expression in precancerous and cancerous lesions by comparing the gene expression of stem-like cells in diseased tissues with normal stem cells |
| Entrez ID | Symbol | Replicates | Species | Organ | Tissue | Adj P-value | Log2FC | Malignancy |
| 54820 | NDE1 | LZE4T | Human | Esophagus | ESCC | 3.65e-18 | 5.88e-01 | 0.0811 |
| 54820 | NDE1 | LZE7T | Human | Esophagus | ESCC | 9.10e-10 | 5.21e-01 | 0.0667 |
| 54820 | NDE1 | LZE8T | Human | Esophagus | ESCC | 4.60e-06 | 4.50e-01 | 0.067 |
| 54820 | NDE1 | LZE20T | Human | Esophagus | ESCC | 3.85e-05 | 3.04e-01 | 0.0662 |
| 54820 | NDE1 | LZE21D1 | Human | Esophagus | HGIN | 8.37e-04 | 6.46e-01 | 0.0632 |
| 54820 | NDE1 | LZE22T | Human | Esophagus | ESCC | 1.49e-06 | 7.98e-01 | 0.068 |
| 54820 | NDE1 | LZE24T | Human | Esophagus | ESCC | 4.47e-11 | 2.98e-01 | 0.0596 |
| 54820 | NDE1 | LZE21T | Human | Esophagus | ESCC | 3.42e-07 | 5.46e-01 | 0.0655 |
| 54820 | NDE1 | LZE6T | Human | Esophagus | ESCC | 7.46e-03 | 3.26e-01 | 0.0845 |
| 54820 | NDE1 | P1T-E | Human | Esophagus | ESCC | 2.19e-24 | 1.25e+00 | 0.0875 |
| 54820 | NDE1 | P2T-E | Human | Esophagus | ESCC | 2.14e-73 | 1.34e+00 | 0.1177 |
| 54820 | NDE1 | P4T-E | Human | Esophagus | ESCC | 3.41e-20 | 4.72e-01 | 0.1323 |
| 54820 | NDE1 | P5T-E | Human | Esophagus | ESCC | 1.44e-23 | 6.03e-01 | 0.1327 |
| 54820 | NDE1 | P8T-E | Human | Esophagus | ESCC | 2.56e-19 | 5.20e-01 | 0.0889 |
| 54820 | NDE1 | P9T-E | Human | Esophagus | ESCC | 1.54e-13 | 3.50e-01 | 0.1131 |
| 54820 | NDE1 | P10T-E | Human | Esophagus | ESCC | 6.28e-20 | 4.92e-01 | 0.116 |
| 54820 | NDE1 | P11T-E | Human | Esophagus | ESCC | 2.30e-27 | 1.07e+00 | 0.1426 |
| 54820 | NDE1 | P12T-E | Human | Esophagus | ESCC | 9.45e-44 | 9.57e-01 | 0.1122 |
| 54820 | NDE1 | P15T-E | Human | Esophagus | ESCC | 1.75e-26 | 5.88e-01 | 0.1149 |
| 54820 | NDE1 | P16T-E | Human | Esophagus | ESCC | 5.45e-34 | 6.85e-01 | 0.1153 |
| Page: 1 2 3 4 5 6 |
| Tissue | Expression Dynamics | Abbreviation |
| Esophagus |  | ESCC: Esophageal squamous cell carcinoma |
| HGIN: High-grade intraepithelial neoplasias | ||
| LGIN: Low-grade intraepithelial neoplasias | ||
| Oral Cavity |  | EOLP: Erosive Oral lichen planus |
| LP: leukoplakia | ||
| NEOLP: Non-erosive oral lichen planus | ||
| OSCC: Oral squamous cell carcinoma | ||
| Skin | 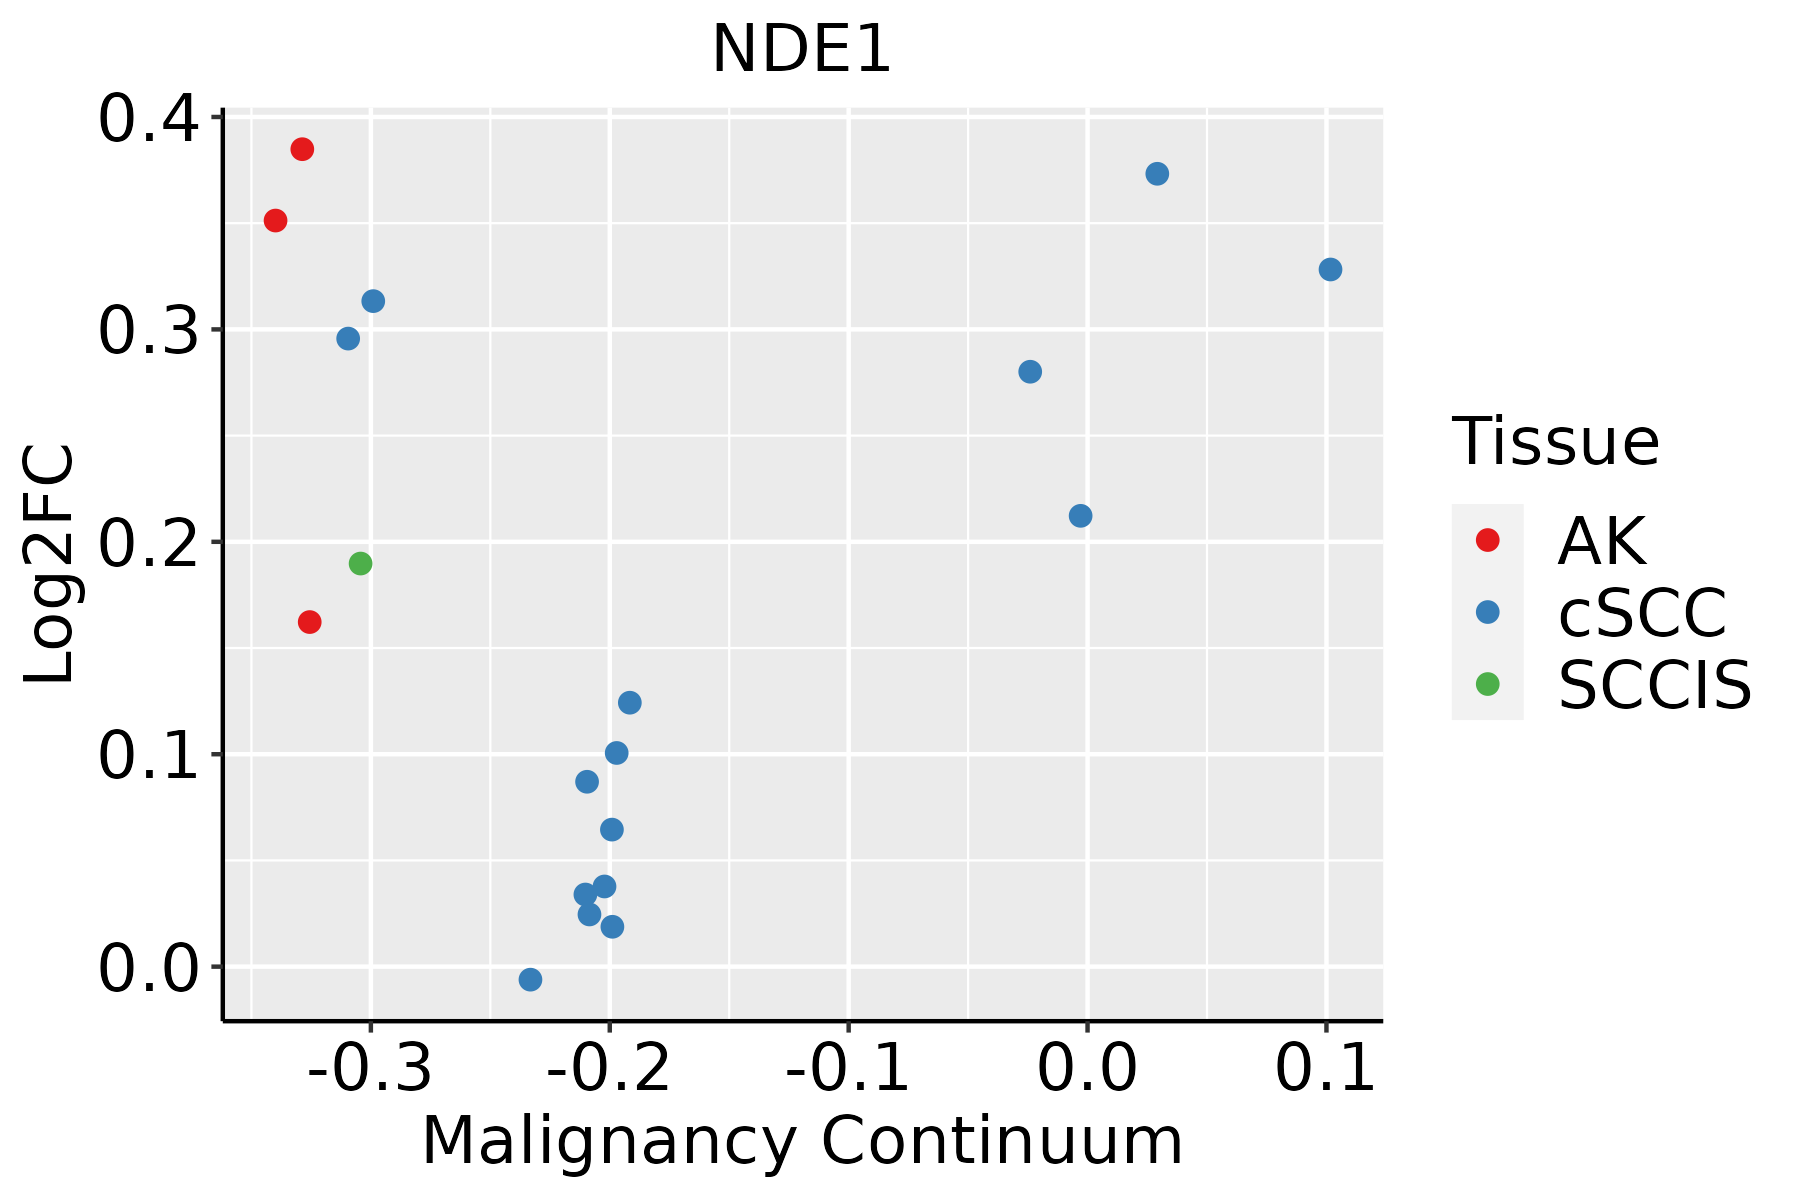 | AK: Actinic keratosis |
| cSCC: Cutaneous squamous cell carcinoma | ||
| SCCIS:squamous cell carcinoma in situ | ||
| Thyroid | 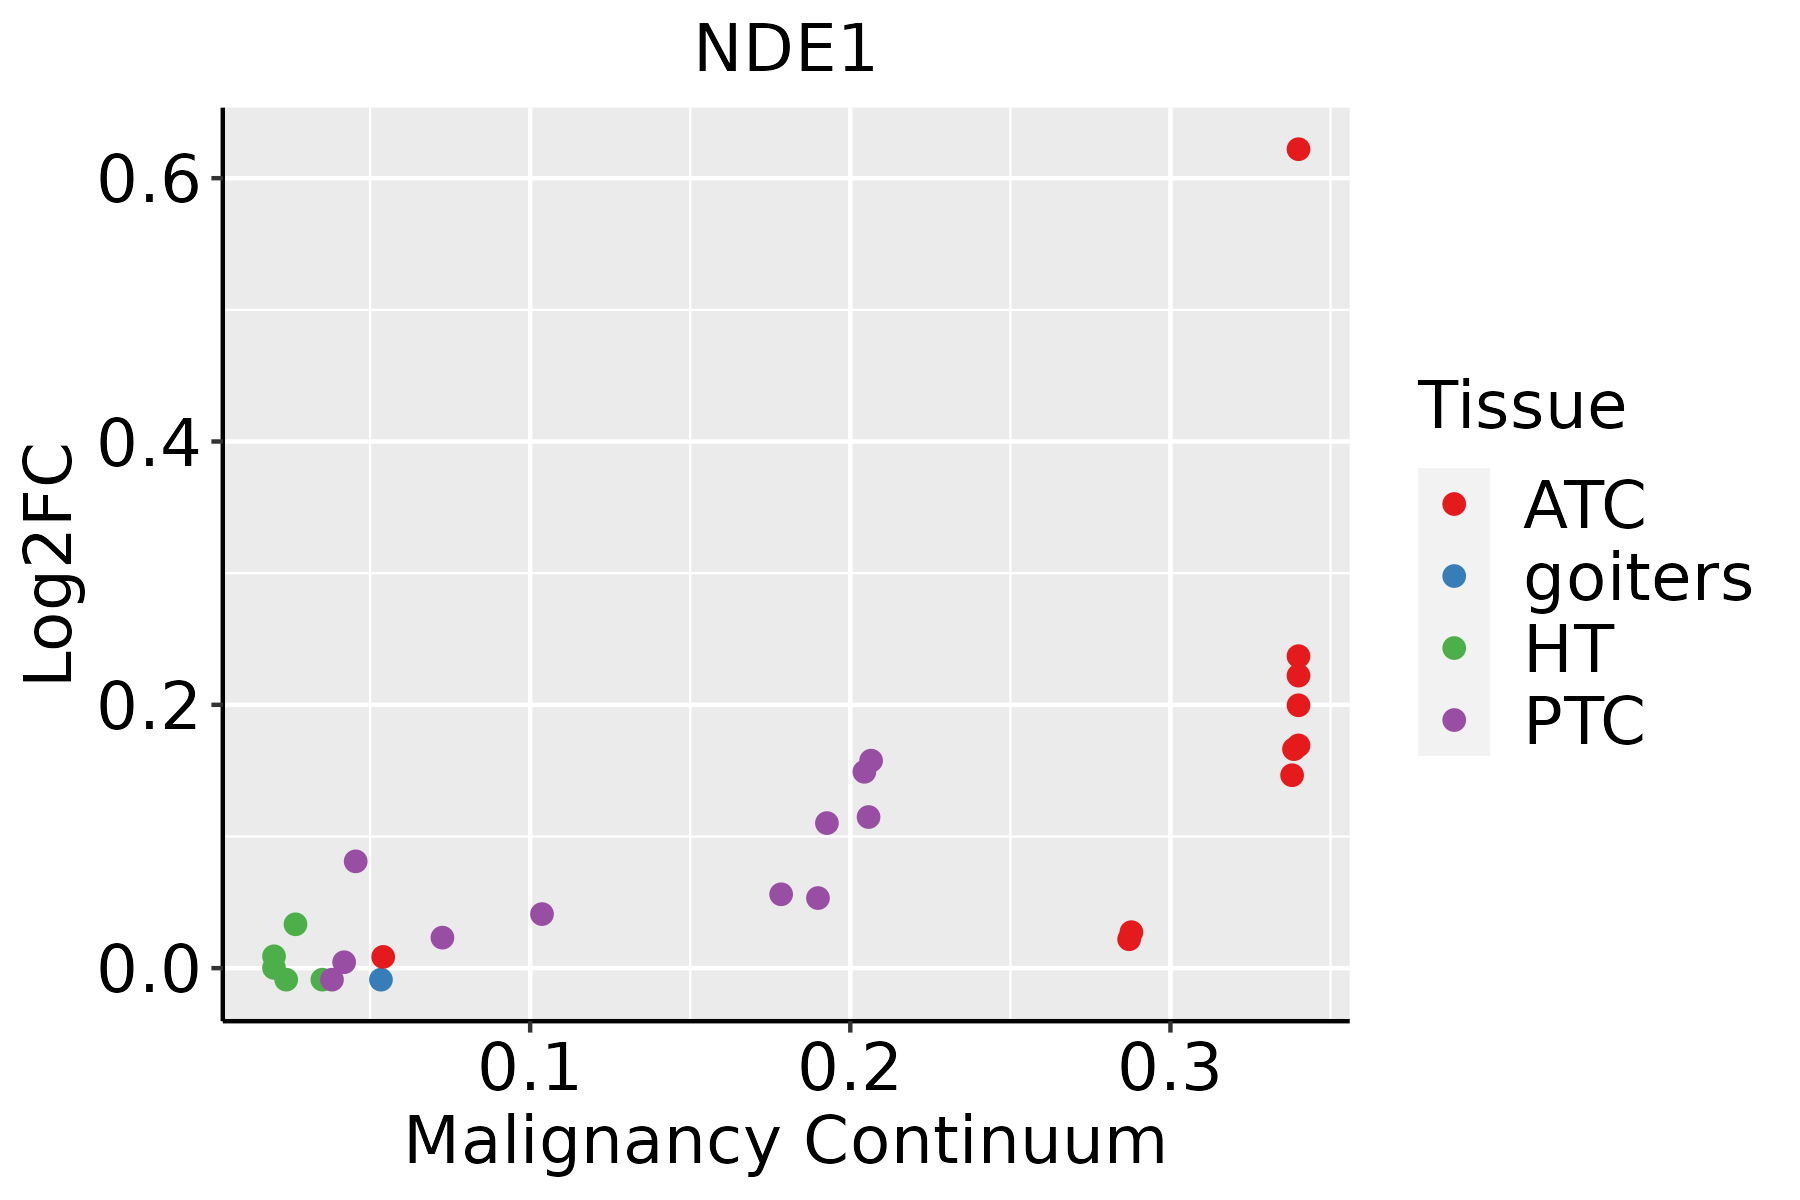 | ATC: Anaplastic thyroid cancer |
| HT: Hashimoto's thyroiditis | ||
| PTC: Papillary thyroid cancer |
| ∗log2FC in expression of this searched gene in stem-like cells from each diseased tissue sample relative to stem-like cells in normal samples in each tissue plotted against the malignancy continuum. Samples are colored based on if they are from different disease stage. |
Top |
Malignant transformation related pathway analysis |
| Find out the enriched GO biological processes and KEGG pathways involved in transition from healthy to precancer to cancer |
| Tissue | Disease Stage | Enriched GO biological Processes |
| Colorectum | AD |  |
| Colorectum | SER |  |
| Colorectum | MSS |  |
| Colorectum | MSI-H |  |
| Colorectum | FAP |  |
| ∗Top 15 enriched GO BP terms are showed in the bar plot of each disease state in each tissue. Each row represents a significant GO biological process which is colored according to the -log10(p.adjust). |
| Page: 1 2 3 4 5 6 7 8 9 |
| GO ID | Tissue | Disease Stage | Description | Gene Ratio | Bg Ratio | pvalue | p.adjust | Count |
| GO:00516534 | Skin | cSCC | spindle localization | 26/4864 | 56/18723 | 7.59e-04 | 5.27e-03 | 26 |
| GO:004678513 | Skin | cSCC | microtubule polymerization | 35/4864 | 83/18723 | 9.52e-04 | 6.47e-03 | 35 |
| GO:001097014 | Skin | cSCC | transport along microtubule | 58/4864 | 155/18723 | 1.09e-03 | 7.24e-03 | 58 |
| GO:00001321 | Skin | cSCC | establishment of mitotic spindle orientation | 16/4864 | 30/18723 | 1.27e-03 | 8.19e-03 | 16 |
| GO:002198712 | Skin | cSCC | cerebral cortex development | 44/4864 | 114/18723 | 2.05e-03 | 1.22e-02 | 44 |
| GO:002154311 | Skin | cSCC | pallium development | 61/4864 | 169/18723 | 2.27e-03 | 1.33e-02 | 61 |
| GO:00512931 | Skin | cSCC | establishment of spindle localization | 23/4864 | 51/18723 | 2.41e-03 | 1.38e-02 | 23 |
| GO:00723847 | Skin | cSCC | organelle transport along microtubule | 34/4864 | 85/18723 | 3.22e-03 | 1.76e-02 | 34 |
| GO:003110911 | Skin | cSCC | microtubule polymerization or depolymerization | 45/4864 | 122/18723 | 5.05e-03 | 2.56e-02 | 45 |
| GO:00512942 | Skin | cSCC | establishment of spindle orientation | 17/4864 | 37/18723 | 6.83e-03 | 3.30e-02 | 17 |
| GO:005165620 | Thyroid | PTC | establishment of organelle localization | 193/5968 | 390/18723 | 2.21e-13 | 1.15e-11 | 193 |
| GO:0051258113 | Thyroid | PTC | protein polymerization | 154/5968 | 297/18723 | 5.35e-13 | 2.66e-11 | 154 |
| GO:0007163111 | Thyroid | PTC | establishment or maintenance of cell polarity | 115/5968 | 218/18723 | 1.15e-10 | 3.90e-09 | 115 |
| GO:0030705111 | Thyroid | PTC | cytoskeleton-dependent intracellular transport | 104/5968 | 195/18723 | 3.87e-10 | 1.24e-08 | 104 |
| GO:005165019 | Thyroid | PTC | establishment of vesicle localization | 89/5968 | 161/18723 | 6.38e-10 | 1.97e-08 | 89 |
| GO:005164817 | Thyroid | PTC | vesicle localization | 94/5968 | 177/18723 | 3.54e-09 | 9.45e-08 | 94 |
| GO:01400148 | Thyroid | PTC | mitotic nuclear division | 135/5968 | 287/18723 | 4.90e-08 | 1.04e-06 | 135 |
| GO:00109709 | Thyroid | PTC | transport along microtubule | 80/5968 | 155/18723 | 2.48e-07 | 4.32e-06 | 80 |
| GO:19028509 | Thyroid | PTC | microtubule cytoskeleton organization involved in mitosis | 76/5968 | 147/18723 | 4.49e-07 | 7.38e-06 | 76 |
| GO:003001020 | Thyroid | PTC | establishment of cell polarity | 74/5968 | 143/18723 | 6.05e-07 | 9.63e-06 | 74 |
| Page: 1 2 3 4 5 6 7 8 9 10 11 12 13 |
| Pathway ID | Tissue | Disease Stage | Description | Gene Ratio | Bg Ratio | pvalue | p.adjust | qvalue | Count |
| Page: 1 |
Top |
Cell-cell communication analysis |
| Identification of potential cell-cell interactions between two cell types and their ligand-receptor pairs for different disease states |
| Ligand | Receptor | LRpair | Pathway | Tissue | Disease Stage |
| Page: 1 |
Top |
Single-cell gene regulatory network inference analysis |
| Find out the significant the regulons (TFs) and the target genes of each regulon across cell types for different disease states |
| TF | Cell Type | Tissue | Disease Stage | Target Gene | RSS | Regulon Activity |
| ∗The dot plots of a searched regulon are shown for all cell subpopulations in each disease state of each tissue based on the regulon specific score inferred using pySCENIC and by calculating the average expression. |
| Page: 1 |
Top |
Somatic mutation of malignant transformation related genes |
| Annotation of somatic variants for genes involved in malignant transformation |
| Hugo Symbol | Variant Class | Variant Classification | dbSNP RS | HGVSc | HGVSp | HGVSp Short | SWISSPROT | BIOTYPE | SIFT | PolyPhen | Tumor Sample Barcode | Tissue | Histology | Sex | Age | Stage | Therapy Types | Drugs | Outcome |
| NDE1 | SNV | Missense_Mutation | novel | c.313G>T | p.Ala105Ser | p.A105S | Q9NXR1 | protein_coding | tolerated(0.11) | benign(0.111) | TCGA-AN-A046-01 | Breast | breast invasive carcinoma | Female | >=65 | I/II | Unknown | Unknown | SD |
| NDE1 | SNV | Missense_Mutation | rs766080443 | c.439G>A | p.Glu147Lys | p.E147K | Q9NXR1 | protein_coding | deleterious(0) | probably_damaging(1) | TCGA-AN-A046-01 | Breast | breast invasive carcinoma | Female | >=65 | I/II | Unknown | Unknown | SD |
| NDE1 | SNV | Missense_Mutation | rs886051724 | c.632C>T | p.Ser211Phe | p.S211F | Q9NXR1 | protein_coding | deleterious(0.04) | possibly_damaging(0.817) | TCGA-BH-A0DZ-01 | Breast | breast invasive carcinoma | Female | <65 | I/II | Chemotherapy | docetaxel | SD |
| NDE1 | insertion | Frame_Shift_Ins | novel | c.467_468insCAGCATCTTATTTAATCCTCATGACAGCC | p.Asp157SerfsTer23 | p.D157Sfs*23 | Q9NXR1 | protein_coding | TCGA-BH-A0B1-01 | Breast | breast invasive carcinoma | Female | >=65 | I/II | Chemotherapy | adriamycin | SD | ||
| NDE1 | SNV | Missense_Mutation | rs201587506 | c.302N>T | p.Ala101Val | p.A101V | Q9NXR1 | protein_coding | deleterious(0.01) | benign(0.197) | TCGA-EA-A3HS-01 | Cervix | cervical & endocervical cancer | Female | <65 | I/II | Unknown | Unknown | SD |
| NDE1 | SNV | Missense_Mutation | c.893N>C | p.Arg298Thr | p.R298T | Q9NXR1 | protein_coding | tolerated(0.22) | benign(0.175) | TCGA-EX-A3L1-01 | Cervix | cervical & endocervical cancer | Female | <65 | I/II | Chemotherapy | cisplatin | CR | |
| NDE1 | SNV | Missense_Mutation | rs140540712 | c.718N>G | p.Thr240Ala | p.T240A | Q9NXR1 | protein_coding | tolerated(0.5) | benign(0) | TCGA-FU-A3HZ-01 | Cervix | cervical & endocervical cancer | Female | <65 | I/II | Chemotherapy | cisplatin | CR |
| NDE1 | SNV | Missense_Mutation | c.748N>T | p.Arg250Trp | p.R250W | Q9NXR1 | protein_coding | deleterious(0.05) | possibly_damaging(0.876) | TCGA-AA-3663-01 | Colorectum | colon adenocarcinoma | Male | <65 | I/II | Unknown | Unknown | SD | |
| NDE1 | SNV | Missense_Mutation | novel | c.775N>A | p.Asp259Asn | p.D259N | Q9NXR1 | protein_coding | deleterious(0.02) | probably_damaging(0.996) | TCGA-AZ-4315-01 | Colorectum | colon adenocarcinoma | Male | <65 | I/II | Unknown | Unknown | SD |
| NDE1 | SNV | Missense_Mutation | rs765611446 | c.199G>A | p.Glu67Lys | p.E67K | Q9NXR1 | protein_coding | tolerated(0.27) | benign(0.041) | TCGA-CA-6718-01 | Colorectum | colon adenocarcinoma | Male | <65 | I/II | Unknown | Unknown | PD |
| Page: 1 2 3 4 |
Top |
Related drugs of malignant transformation related genes |
| Identification of chemicals and drugs interact with genes involved in malignant transfromation |
| (DGIdb 4.0) |
| Entrez ID | Symbol | Category | Interaction Types | Drug Claim Name | Drug Name | PMIDs |
| Page: 1 |

Copyright 2023-Present -The University of Texas Health Science Center at Houston |