
|
|||||
|
 | |
| |
| |
| |
| |
| |
|
Gene: MVB12A |
Gene summary for MVB12A |
| Gene information | Species | Human | Gene symbol | MVB12A | Gene ID | 93343 |
| Gene name | multivesicular body subunit 12A | |
| Gene Alias | CFBP | |
| Cytomap | 19p13.11 | |
| Gene Type | protein-coding | GO ID | GO:0006508 | UniProtAcc | A0A024R7L6 |
Top |
Malignant transformation analysis |
| Identification of the aberrant gene expression in precancerous and cancerous lesions by comparing the gene expression of stem-like cells in diseased tissues with normal stem cells |
| Entrez ID | Symbol | Replicates | Species | Organ | Tissue | Adj P-value | Log2FC | Malignancy |
| 93343 | MVB12A | LZE2T | Human | Esophagus | ESCC | 5.68e-10 | 5.13e-01 | 0.082 |
| 93343 | MVB12A | LZE3D | Human | Esophagus | HGIN | 6.57e-03 | 4.02e-01 | 0.0668 |
| 93343 | MVB12A | LZE4T | Human | Esophagus | ESCC | 1.58e-08 | 2.83e-01 | 0.0811 |
| 93343 | MVB12A | LZE5T | Human | Esophagus | ESCC | 1.98e-02 | 3.32e-01 | 0.0514 |
| 93343 | MVB12A | LZE7T | Human | Esophagus | ESCC | 1.18e-09 | 3.53e-01 | 0.0667 |
| 93343 | MVB12A | LZE8T | Human | Esophagus | ESCC | 8.99e-07 | 1.03e-01 | 0.067 |
| 93343 | MVB12A | LZE20T | Human | Esophagus | ESCC | 9.03e-13 | 2.17e-01 | 0.0662 |
| 93343 | MVB12A | LZE22D1 | Human | Esophagus | HGIN | 6.72e-03 | 1.78e-01 | 0.0595 |
| 93343 | MVB12A | LZE24T | Human | Esophagus | ESCC | 4.78e-22 | 6.37e-01 | 0.0596 |
| 93343 | MVB12A | LZE21T | Human | Esophagus | ESCC | 3.33e-02 | 4.92e-01 | 0.0655 |
| 93343 | MVB12A | LZE6T | Human | Esophagus | ESCC | 2.85e-08 | 3.72e-01 | 0.0845 |
| 93343 | MVB12A | P1T-E | Human | Esophagus | ESCC | 1.40e-15 | 8.39e-01 | 0.0875 |
| 93343 | MVB12A | P2T-E | Human | Esophagus | ESCC | 2.07e-20 | 2.90e-01 | 0.1177 |
| 93343 | MVB12A | P4T-E | Human | Esophagus | ESCC | 4.96e-41 | 8.58e-01 | 0.1323 |
| 93343 | MVB12A | P5T-E | Human | Esophagus | ESCC | 2.65e-33 | 6.02e-01 | 0.1327 |
| 93343 | MVB12A | P8T-E | Human | Esophagus | ESCC | 7.38e-37 | 6.06e-01 | 0.0889 |
| 93343 | MVB12A | P9T-E | Human | Esophagus | ESCC | 8.43e-22 | 6.84e-01 | 0.1131 |
| 93343 | MVB12A | P10T-E | Human | Esophagus | ESCC | 2.39e-29 | 4.65e-01 | 0.116 |
| 93343 | MVB12A | P11T-E | Human | Esophagus | ESCC | 1.21e-19 | 9.87e-01 | 0.1426 |
| 93343 | MVB12A | P12T-E | Human | Esophagus | ESCC | 1.03e-04 | 3.23e-02 | 0.1122 |
| Page: 1 2 3 4 5 6 7 |
| Tissue | Expression Dynamics | Abbreviation |
| Esophagus | 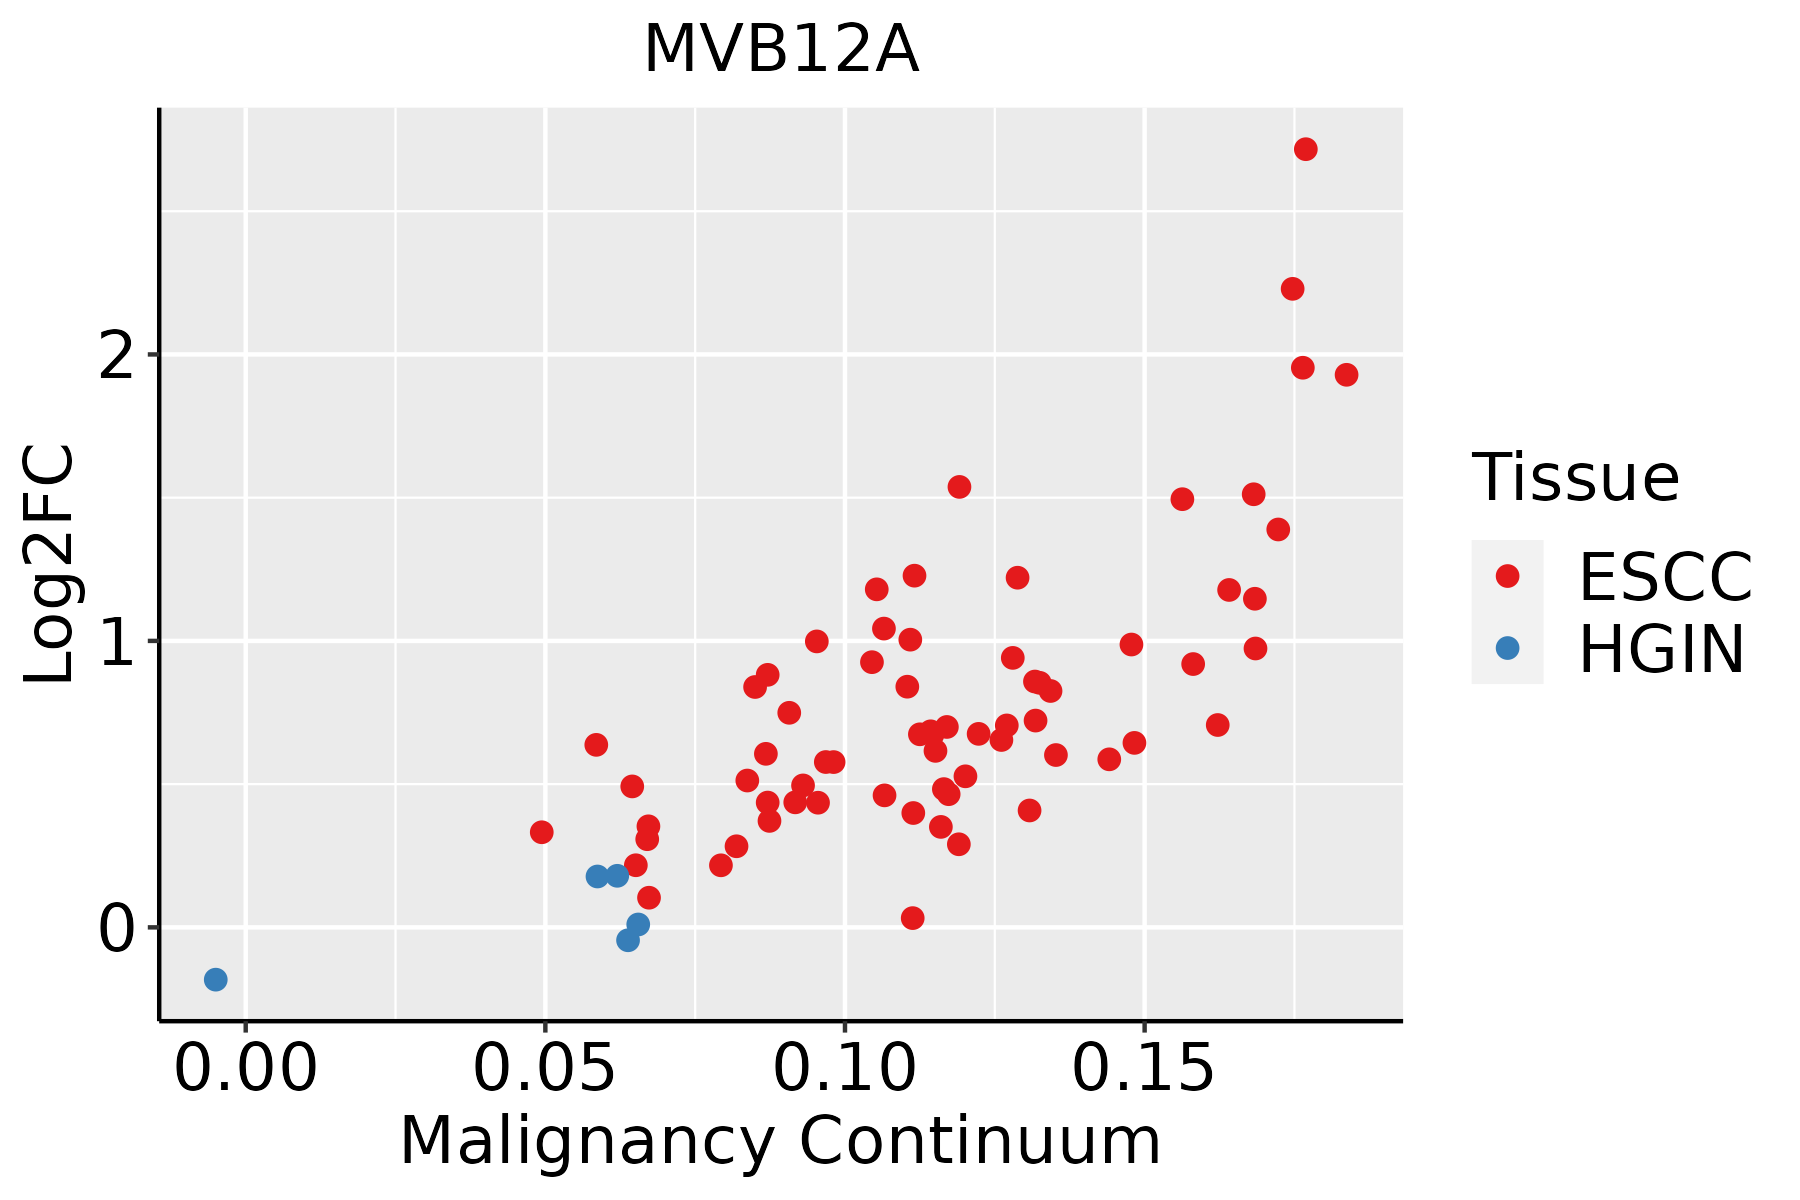 | ESCC: Esophageal squamous cell carcinoma |
| HGIN: High-grade intraepithelial neoplasias | ||
| LGIN: Low-grade intraepithelial neoplasias | ||
| Liver |  | HCC: Hepatocellular carcinoma |
| NAFLD: Non-alcoholic fatty liver disease | ||
| Oral Cavity | 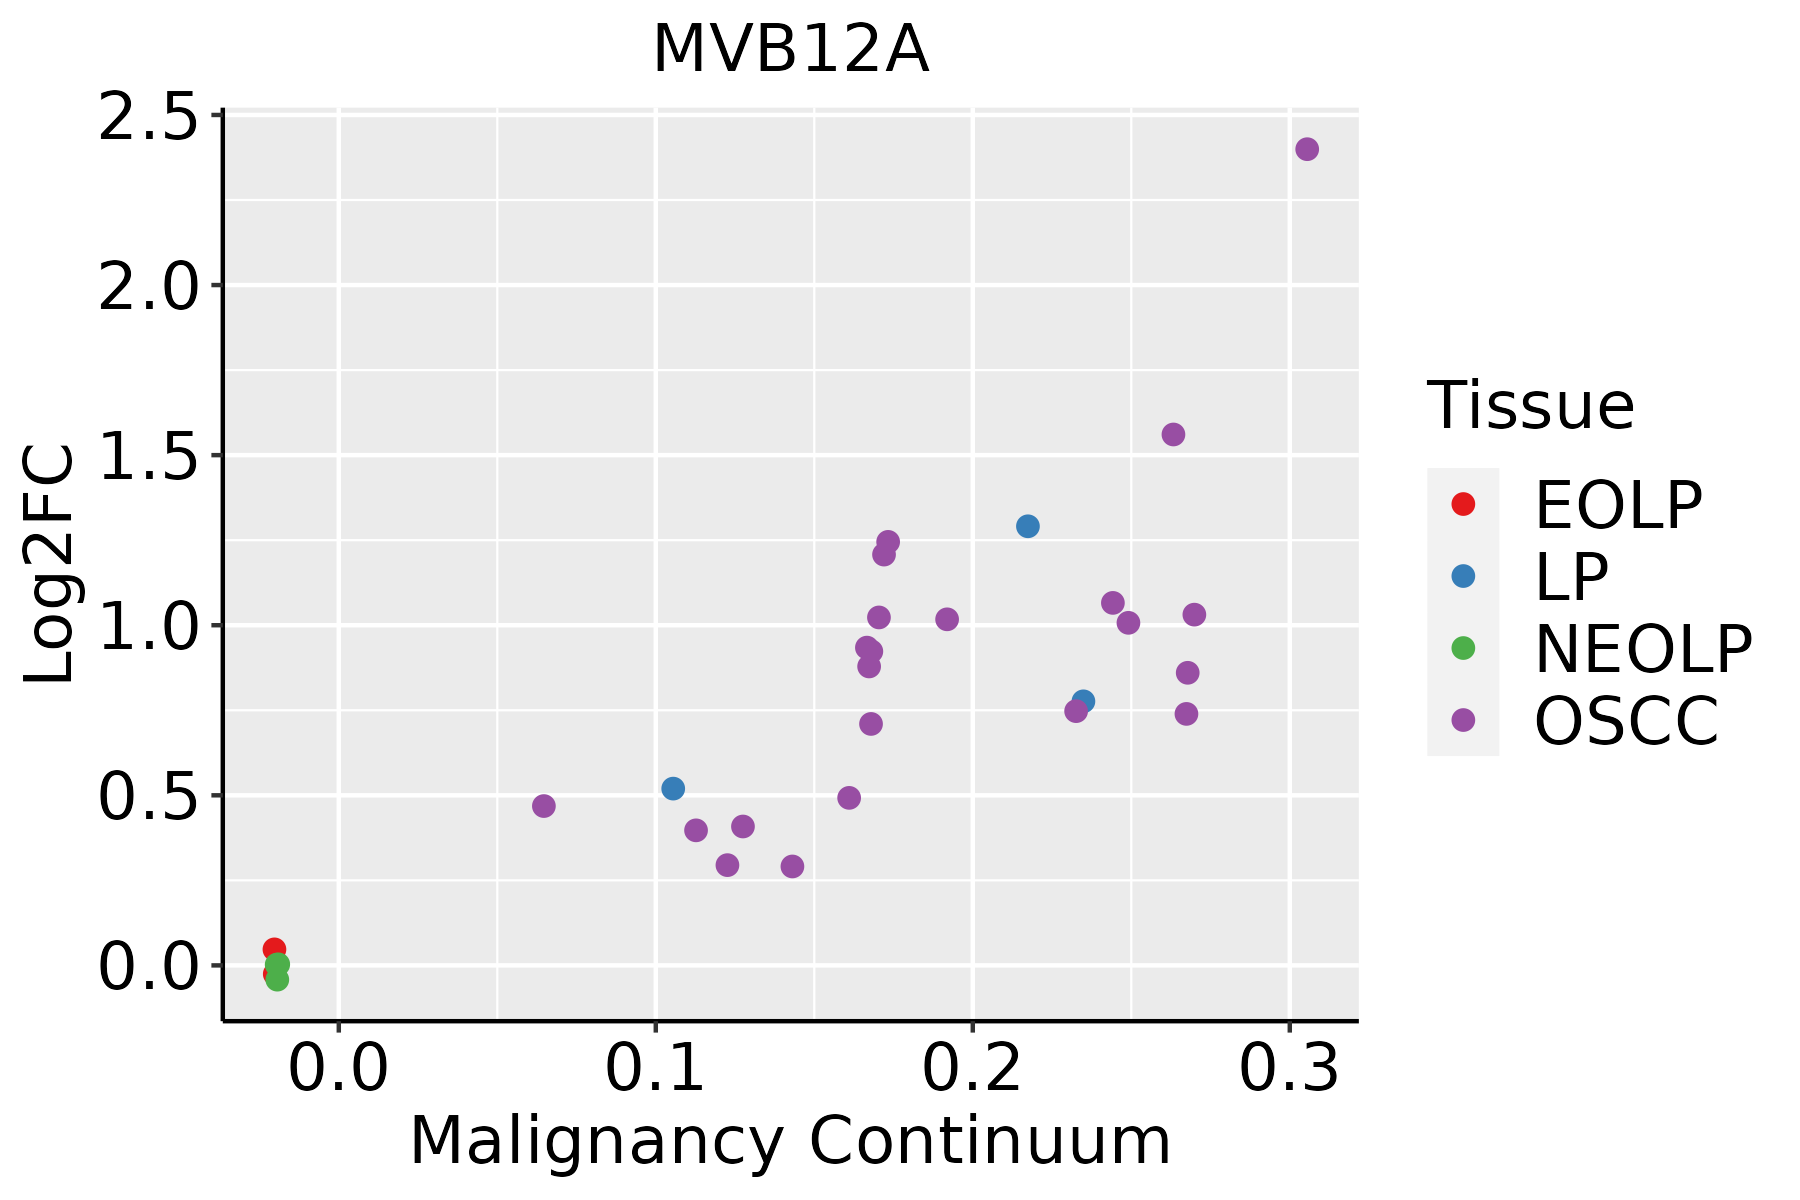 | EOLP: Erosive Oral lichen planus |
| LP: leukoplakia | ||
| NEOLP: Non-erosive oral lichen planus | ||
| OSCC: Oral squamous cell carcinoma | ||
| Skin | 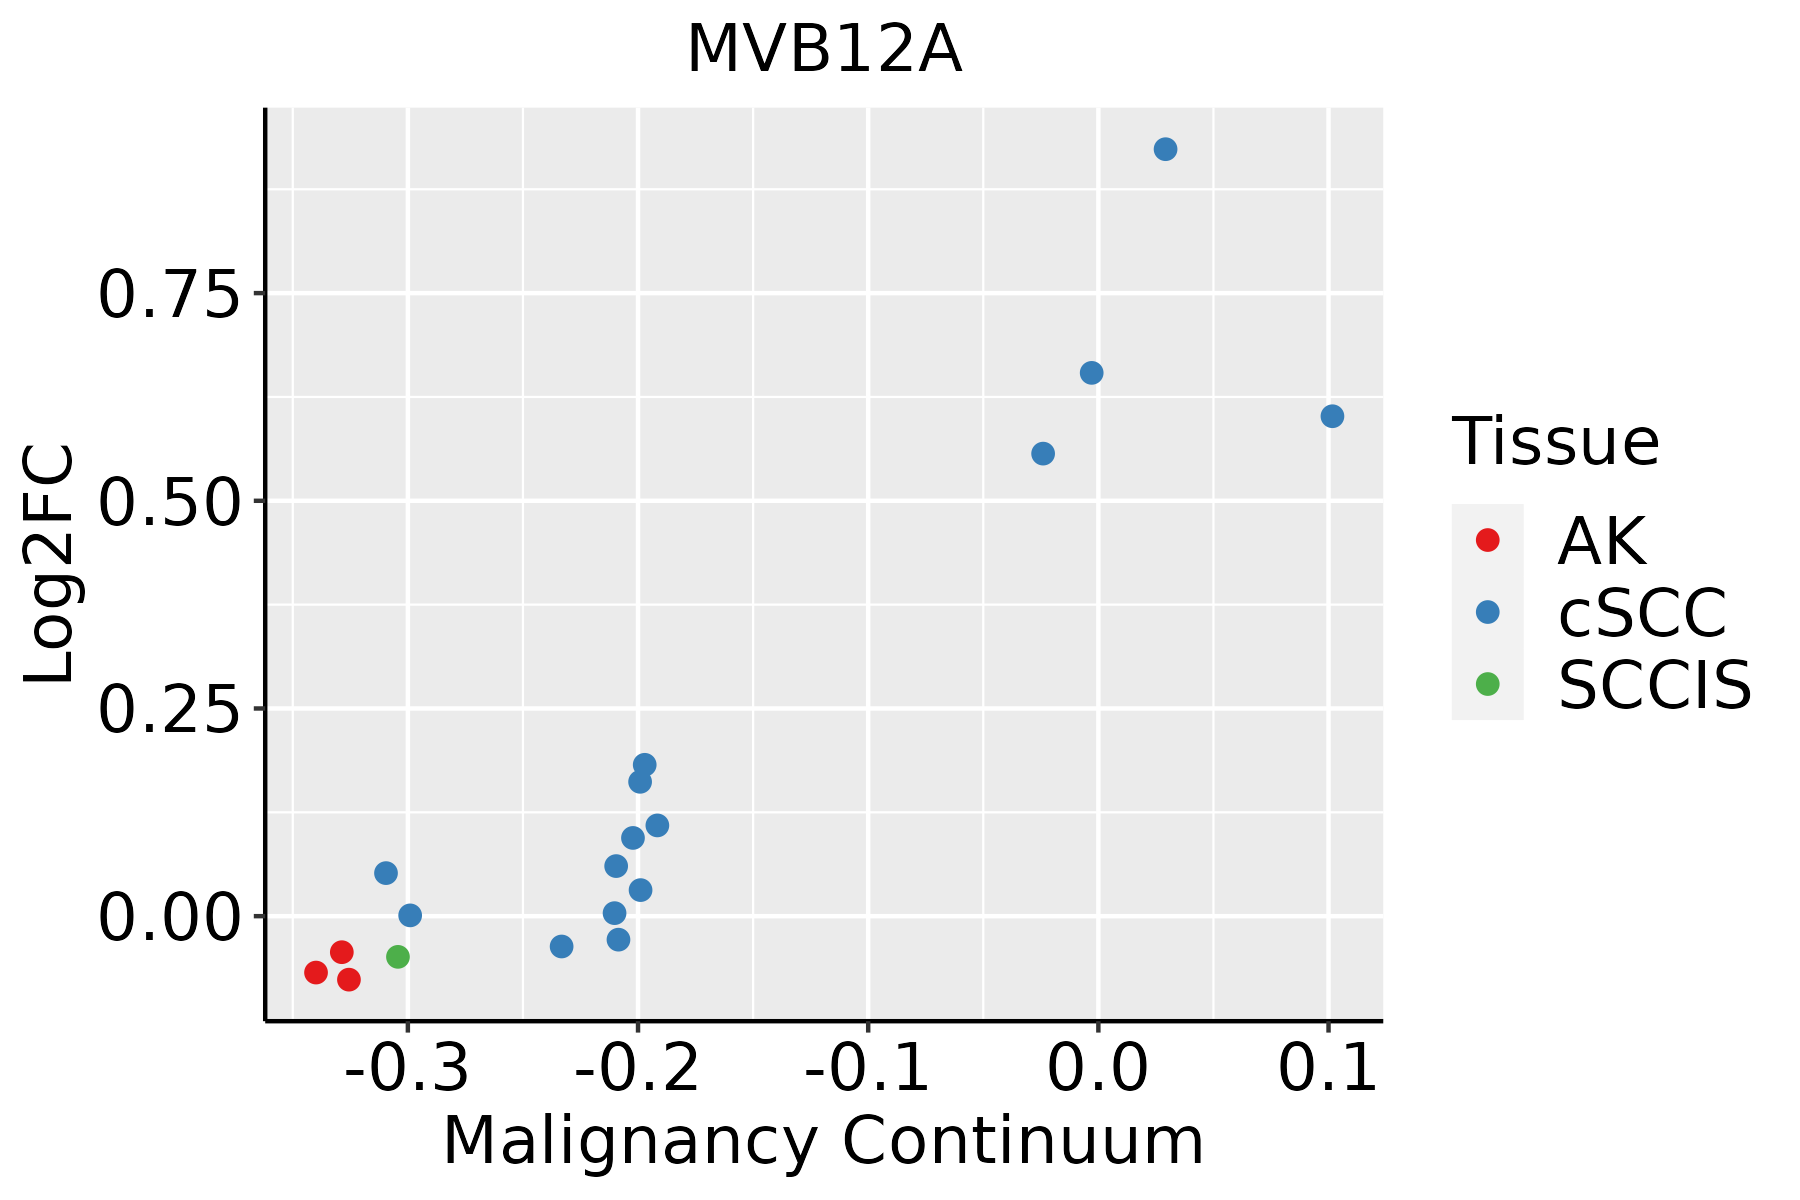 | AK: Actinic keratosis |
| cSCC: Cutaneous squamous cell carcinoma | ||
| SCCIS:squamous cell carcinoma in situ | ||
| Thyroid | 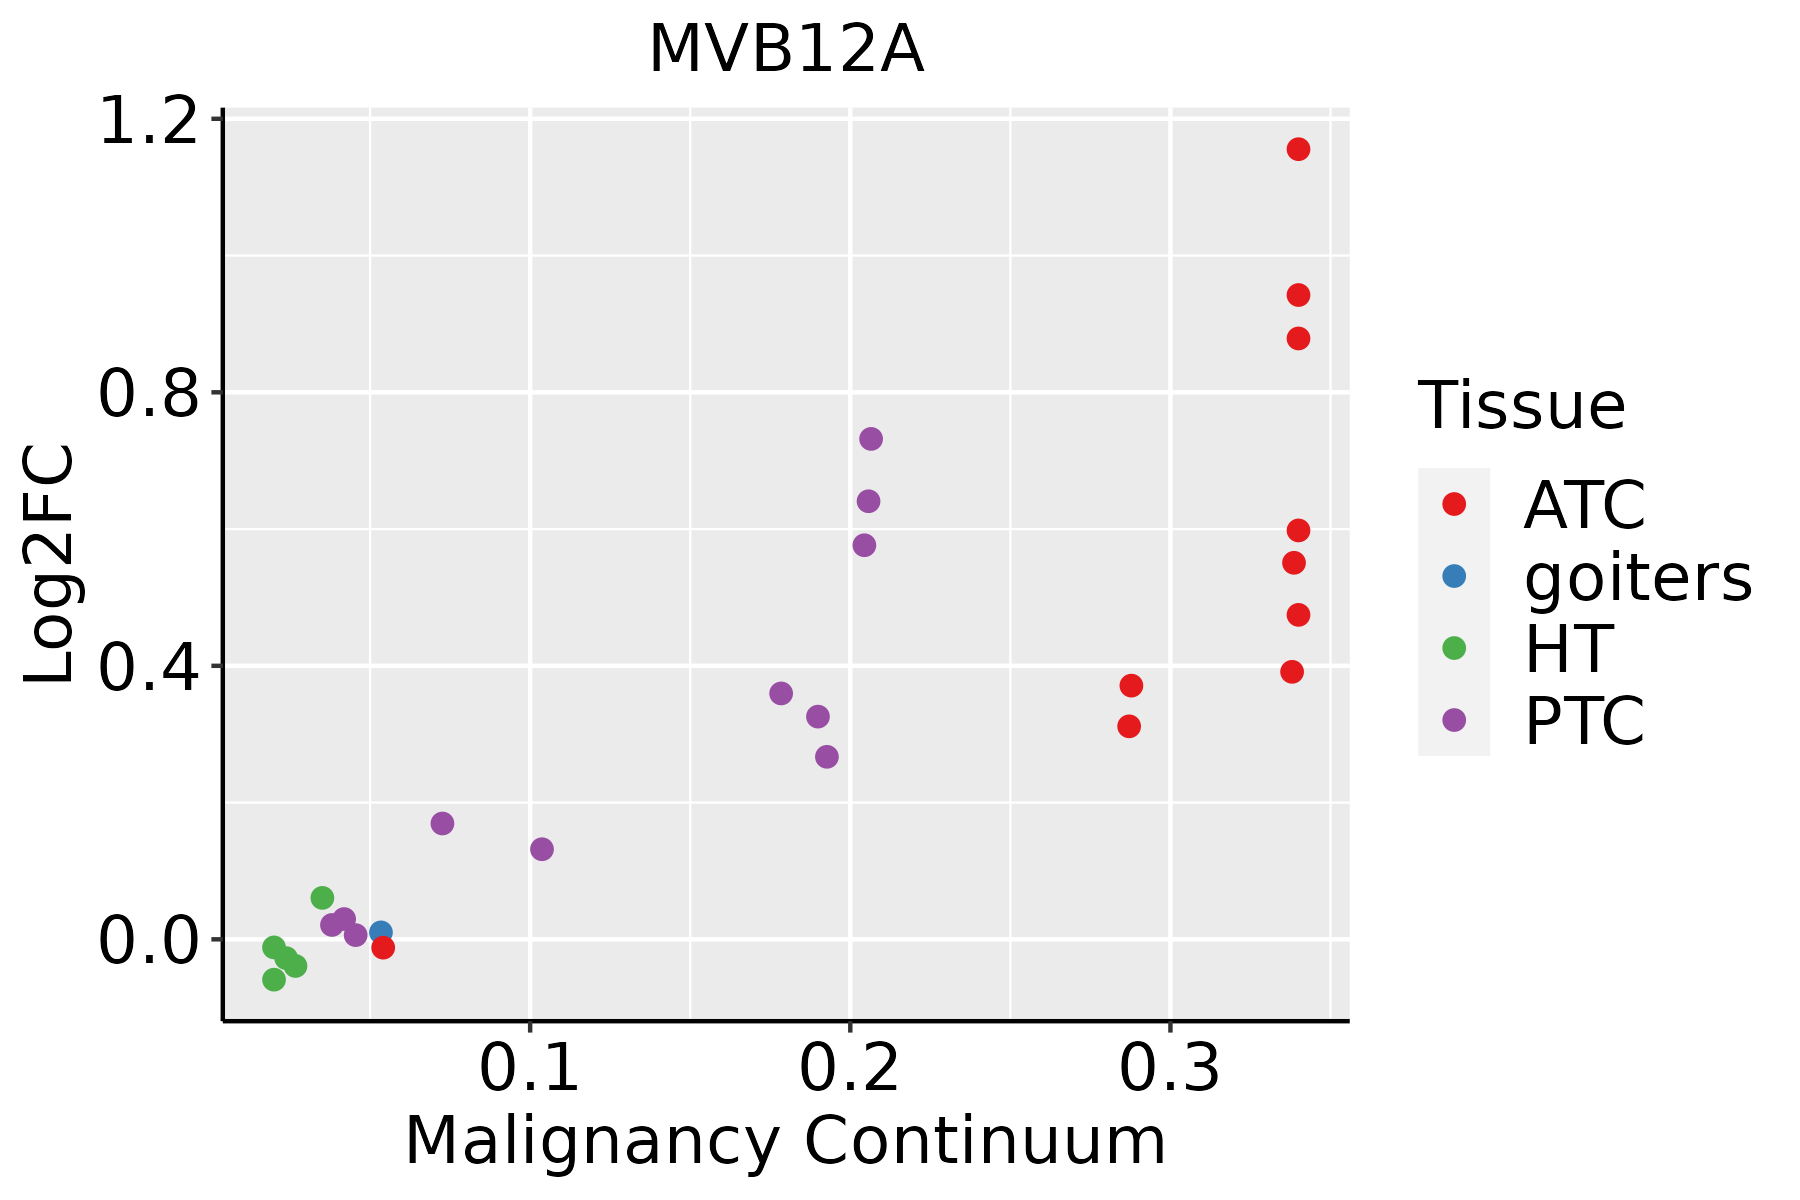 | ATC: Anaplastic thyroid cancer |
| HT: Hashimoto's thyroiditis | ||
| PTC: Papillary thyroid cancer |
| ∗log2FC in expression of this searched gene in stem-like cells from each diseased tissue sample relative to stem-like cells in normal samples in each tissue plotted against the malignancy continuum. Samples are colored based on if they are from different disease stage. |
Top |
Malignant transformation related pathway analysis |
| Find out the enriched GO biological processes and KEGG pathways involved in transition from healthy to precancer to cancer |
| Tissue | Disease Stage | Enriched GO biological Processes |
| Colorectum | AD |  |
| Colorectum | SER |  |
| Colorectum | MSS |  |
| Colorectum | MSI-H |  |
| Colorectum | FAP |  |
| ∗Top 15 enriched GO BP terms are showed in the bar plot of each disease state in each tissue. Each row represents a significant GO biological process which is colored according to the -log10(p.adjust). |
| Page: 1 2 3 4 5 6 7 8 9 |
| GO ID | Tissue | Disease Stage | Description | Gene Ratio | Bg Ratio | pvalue | p.adjust | Count |
| GO:0007173111 | Thyroid | ATC | epidermal growth factor receptor signaling pathway | 63/6293 | 108/18723 | 1.15e-07 | 1.92e-06 | 63 |
| GO:003625815 | Thyroid | ATC | multivesicular body assembly | 24/6293 | 30/18723 | 2.44e-07 | 3.77e-06 | 24 |
| GO:000704116 | Thyroid | ATC | lysosomal transport | 63/6293 | 114/18723 | 1.58e-06 | 1.93e-05 | 63 |
| GO:000703216 | Thyroid | ATC | endosome organization | 48/6293 | 82/18723 | 3.13e-06 | 3.56e-05 | 48 |
| GO:007198515 | Thyroid | ATC | multivesicular body sorting pathway | 26/6293 | 37/18723 | 5.64e-06 | 6.00e-05 | 26 |
| GO:190118415 | Thyroid | ATC | regulation of ERBB signaling pathway | 45/6293 | 79/18723 | 1.68e-05 | 1.55e-04 | 45 |
| GO:004311224 | Thyroid | ATC | receptor metabolic process | 82/6293 | 166/18723 | 1.78e-05 | 1.63e-04 | 82 |
| GO:004205814 | Thyroid | ATC | regulation of epidermal growth factor receptor signaling pathway | 42/6293 | 73/18723 | 2.29e-05 | 2.02e-04 | 42 |
| GO:001906821 | Thyroid | ATC | virion assembly | 23/6293 | 35/18723 | 1.03e-04 | 7.41e-04 | 23 |
| GO:003970215 | Thyroid | ATC | viral budding via host ESCRT complex | 15/6293 | 21/18723 | 4.45e-04 | 2.64e-03 | 15 |
| GO:004675515 | Thyroid | ATC | viral budding | 17/6293 | 26/18723 | 9.13e-04 | 4.92e-03 | 17 |
| GO:000833311 | Thyroid | ATC | endosome to lysosome transport | 29/6293 | 55/18723 | 2.65e-03 | 1.22e-02 | 29 |
| GO:003280114 | Thyroid | ATC | receptor catabolic process | 17/6293 | 28/18723 | 2.97e-03 | 1.35e-02 | 17 |
| Page: 1 2 3 4 5 6 7 8 9 10 |
| Pathway ID | Tissue | Disease Stage | Description | Gene Ratio | Bg Ratio | pvalue | p.adjust | qvalue | Count |
| hsa0414429 | Esophagus | HGIN | Endocytosis | 76/1383 | 251/8465 | 1.74e-08 | 3.34e-07 | 2.65e-07 | 76 |
| hsa04144113 | Esophagus | HGIN | Endocytosis | 76/1383 | 251/8465 | 1.74e-08 | 3.34e-07 | 2.65e-07 | 76 |
| hsa04144210 | Esophagus | ESCC | Endocytosis | 186/4205 | 251/8465 | 9.74e-16 | 4.66e-14 | 2.39e-14 | 186 |
| hsa0414437 | Esophagus | ESCC | Endocytosis | 186/4205 | 251/8465 | 9.74e-16 | 4.66e-14 | 2.39e-14 | 186 |
| hsa0414412 | Liver | Cirrhotic | Endocytosis | 119/2530 | 251/8465 | 2.33e-09 | 4.56e-08 | 2.81e-08 | 119 |
| hsa0414413 | Liver | Cirrhotic | Endocytosis | 119/2530 | 251/8465 | 2.33e-09 | 4.56e-08 | 2.81e-08 | 119 |
| hsa0414422 | Liver | HCC | Endocytosis | 178/4020 | 251/8465 | 2.03e-14 | 5.22e-13 | 2.91e-13 | 178 |
| hsa0414432 | Liver | HCC | Endocytosis | 178/4020 | 251/8465 | 2.03e-14 | 5.22e-13 | 2.91e-13 | 178 |
| hsa0414427 | Oral cavity | OSCC | Endocytosis | 174/3704 | 251/8465 | 9.42e-17 | 4.51e-15 | 2.29e-15 | 174 |
| hsa04144112 | Oral cavity | OSCC | Endocytosis | 174/3704 | 251/8465 | 9.42e-17 | 4.51e-15 | 2.29e-15 | 174 |
| hsa0414428 | Oral cavity | LP | Endocytosis | 121/2418 | 251/8465 | 1.89e-11 | 3.70e-10 | 2.38e-10 | 121 |
| hsa0414436 | Oral cavity | LP | Endocytosis | 121/2418 | 251/8465 | 1.89e-11 | 3.70e-10 | 2.38e-10 | 121 |
| Page: 1 |
Top |
Cell-cell communication analysis |
| Identification of potential cell-cell interactions between two cell types and their ligand-receptor pairs for different disease states |
| Ligand | Receptor | LRpair | Pathway | Tissue | Disease Stage |
| Page: 1 |
Top |
Single-cell gene regulatory network inference analysis |
| Find out the significant the regulons (TFs) and the target genes of each regulon across cell types for different disease states |
| TF | Cell Type | Tissue | Disease Stage | Target Gene | RSS | Regulon Activity |
| ∗The dot plots of a searched regulon are shown for all cell subpopulations in each disease state of each tissue based on the regulon specific score inferred using pySCENIC and by calculating the average expression. |
| Page: 1 |
Top |
Somatic mutation of malignant transformation related genes |
| Annotation of somatic variants for genes involved in malignant transformation |
| Hugo Symbol | Variant Class | Variant Classification | dbSNP RS | HGVSc | HGVSp | HGVSp Short | SWISSPROT | BIOTYPE | SIFT | PolyPhen | Tumor Sample Barcode | Tissue | Histology | Sex | Age | Stage | Therapy Types | Drugs | Outcome |
| MVB12A | SNV | Missense_Mutation | novel | c.608T>C | p.Ile203Thr | p.I203T | Q96EY5 | protein_coding | deleterious(0.04) | possibly_damaging(0.637) | TCGA-A8-A06O-01 | Breast | breast invasive carcinoma | Female | <65 | I/II | Hormone Therapy | letrozole | SD |
| MVB12A | SNV | Missense_Mutation | novel | c.93C>G | p.Ile31Met | p.I31M | Q96EY5 | protein_coding | deleterious(0) | probably_damaging(0.988) | TCGA-XX-A89A-01 | Breast | breast invasive carcinoma | Female | >=65 | I/II | Unknown | Unknown | SD |
| MVB12A | deletion | Frame_Shift_Del | novel | c.190delN | p.Asn64ThrfsTer44 | p.N64Tfs*44 | Q96EY5 | protein_coding | TCGA-D8-A27V-01 | Breast | breast invasive carcinoma | Female | <65 | I/II | Hormone Therapy | tamoxiphen | SD | ||
| MVB12A | SNV | Missense_Mutation | novel | c.430N>A | p.Ala144Thr | p.A144T | Q96EY5 | protein_coding | tolerated(0.07) | probably_damaging(0.95) | TCGA-2W-A8YY-01 | Cervix | cervical & endocervical cancer | Female | <65 | I/II | Chemotherapy | cisplatin | CR |
| MVB12A | SNV | Missense_Mutation | novel | c.242C>G | p.Pro81Arg | p.P81R | Q96EY5 | protein_coding | deleterious(0.01) | possibly_damaging(0.728) | TCGA-VS-A958-01 | Cervix | cervical & endocervical cancer | Female | <65 | I/II | Chemotherapy | cisplatin | CR |
| MVB12A | SNV | Missense_Mutation | c.776N>A | p.Val259Glu | p.V259E | Q96EY5 | protein_coding | deleterious(0.01) | probably_damaging(0.999) | TCGA-AA-3872-01 | Colorectum | colon adenocarcinoma | Male | <65 | III/IV | Unknown | Unknown | SD | |
| MVB12A | SNV | Missense_Mutation | c.247C>T | p.Pro83Ser | p.P83S | Q96EY5 | protein_coding | deleterious(0.01) | probably_damaging(0.999) | TCGA-AA-A01P-01 | Colorectum | colon adenocarcinoma | Female | >=65 | III/IV | Unknown | Unknown | PD | |
| MVB12A | SNV | Missense_Mutation | novel | c.430N>T | p.Ala144Ser | p.A144S | Q96EY5 | protein_coding | tolerated(0.06) | probably_damaging(0.953) | TCGA-AP-A1DV-01 | Endometrium | uterine corpus endometrioid carcinoma | Female | <65 | I/II | Unknown | Unknown | SD |
| MVB12A | SNV | Missense_Mutation | c.113C>A | p.Ala38Glu | p.A38E | Q96EY5 | protein_coding | deleterious(0.01) | benign(0.091) | TCGA-B5-A0K2-01 | Endometrium | uterine corpus endometrioid carcinoma | Female | <65 | III/IV | Hormone Therapy | megace | SD | |
| MVB12A | SNV | Missense_Mutation | c.786G>T | p.Lys262Asn | p.K262N | Q96EY5 | protein_coding | tolerated(0.1) | benign(0.19) | TCGA-BS-A0UF-01 | Endometrium | uterine corpus endometrioid carcinoma | Female | >=65 | I/II | Unknown | Unknown | SD |
| Page: 1 2 3 |
Top |
Related drugs of malignant transformation related genes |
| Identification of chemicals and drugs interact with genes involved in malignant transfromation |
| (DGIdb 4.0) |
| Entrez ID | Symbol | Category | Interaction Types | Drug Claim Name | Drug Name | PMIDs |
| Page: 1 |

Copyright 2023-Present -The University of Texas Health Science Center at Houston |