
|
|||||
|
 | |
| |
| |
| |
| |
| |
|
Gene: LSM4 |
Gene summary for LSM4 |
| Gene information | Species | Human | Gene symbol | LSM4 | Gene ID | 25804 |
| Gene name | LSM4 homolog, U6 small nuclear RNA and mRNA degradation associated | |
| Gene Alias | GRP | |
| Cytomap | 19p13.11 | |
| Gene Type | protein-coding | GO ID | GO:0000375 | UniProtAcc | U3KQK1 |
Top |
Malignant transformation analysis |
| Identification of the aberrant gene expression in precancerous and cancerous lesions by comparing the gene expression of stem-like cells in diseased tissues with normal stem cells |
| Entrez ID | Symbol | Replicates | Species | Organ | Tissue | Adj P-value | Log2FC | Malignancy |
| 25804 | LSM4 | GSM4909281 | Human | Breast | IDC | 2.01e-13 | 4.35e-01 | 0.21 |
| 25804 | LSM4 | GSM4909282 | Human | Breast | IDC | 8.82e-06 | 4.10e-01 | -0.0288 |
| 25804 | LSM4 | GSM4909285 | Human | Breast | IDC | 2.51e-25 | 5.85e-01 | 0.21 |
| 25804 | LSM4 | GSM4909286 | Human | Breast | IDC | 1.01e-09 | 3.60e-01 | 0.1081 |
| 25804 | LSM4 | GSM4909287 | Human | Breast | IDC | 4.25e-21 | 5.88e-01 | 0.2057 |
| 25804 | LSM4 | GSM4909288 | Human | Breast | IDC | 4.85e-05 | 1.49e-01 | 0.0988 |
| 25804 | LSM4 | GSM4909289 | Human | Breast | IDC | 3.82e-03 | 4.48e-01 | 0.1064 |
| 25804 | LSM4 | GSM4909290 | Human | Breast | IDC | 2.34e-14 | 5.48e-01 | 0.2096 |
| 25804 | LSM4 | GSM4909293 | Human | Breast | IDC | 2.17e-22 | 5.85e-01 | 0.1581 |
| 25804 | LSM4 | GSM4909296 | Human | Breast | IDC | 3.20e-16 | 3.38e-01 | 0.1524 |
| 25804 | LSM4 | GSM4909297 | Human | Breast | IDC | 1.64e-12 | 3.92e-02 | 0.1517 |
| 25804 | LSM4 | GSM4909298 | Human | Breast | IDC | 8.80e-05 | 2.79e-01 | 0.1551 |
| 25804 | LSM4 | GSM4909302 | Human | Breast | IDC | 3.96e-03 | 2.22e-01 | 0.1545 |
| 25804 | LSM4 | GSM4909304 | Human | Breast | IDC | 2.12e-20 | 5.22e-01 | 0.1636 |
| 25804 | LSM4 | GSM4909306 | Human | Breast | IDC | 6.05e-27 | 6.33e-01 | 0.1564 |
| 25804 | LSM4 | GSM4909307 | Human | Breast | IDC | 6.28e-11 | 4.50e-01 | 0.1569 |
| 25804 | LSM4 | GSM4909308 | Human | Breast | IDC | 2.91e-21 | 5.83e-01 | 0.158 |
| 25804 | LSM4 | GSM4909311 | Human | Breast | IDC | 2.46e-20 | -2.36e-01 | 0.1534 |
| 25804 | LSM4 | GSM4909312 | Human | Breast | IDC | 3.62e-07 | 1.08e-01 | 0.1552 |
| 25804 | LSM4 | GSM4909315 | Human | Breast | IDC | 1.91e-22 | 6.65e-01 | 0.21 |
| Page: 1 2 3 4 5 6 7 8 9 10 11 |
| Tissue | Expression Dynamics | Abbreviation |
| Breast |  | IDC: Invasive ductal carcinoma |
| DCIS: Ductal carcinoma in situ | ||
| Precancer(BRCA1-mut): Precancerous lesion from BRCA1 mutation carriers | ||
| Colorectum (GSE201348) |  | FAP: Familial adenomatous polyposis |
| CRC: Colorectal cancer | ||
| Colorectum (HTA11) |  | AD: Adenomas |
| SER: Sessile serrated lesions | ||
| MSI-H: Microsatellite-high colorectal cancer | ||
| MSS: Microsatellite stable colorectal cancer | ||
| Endometrium | 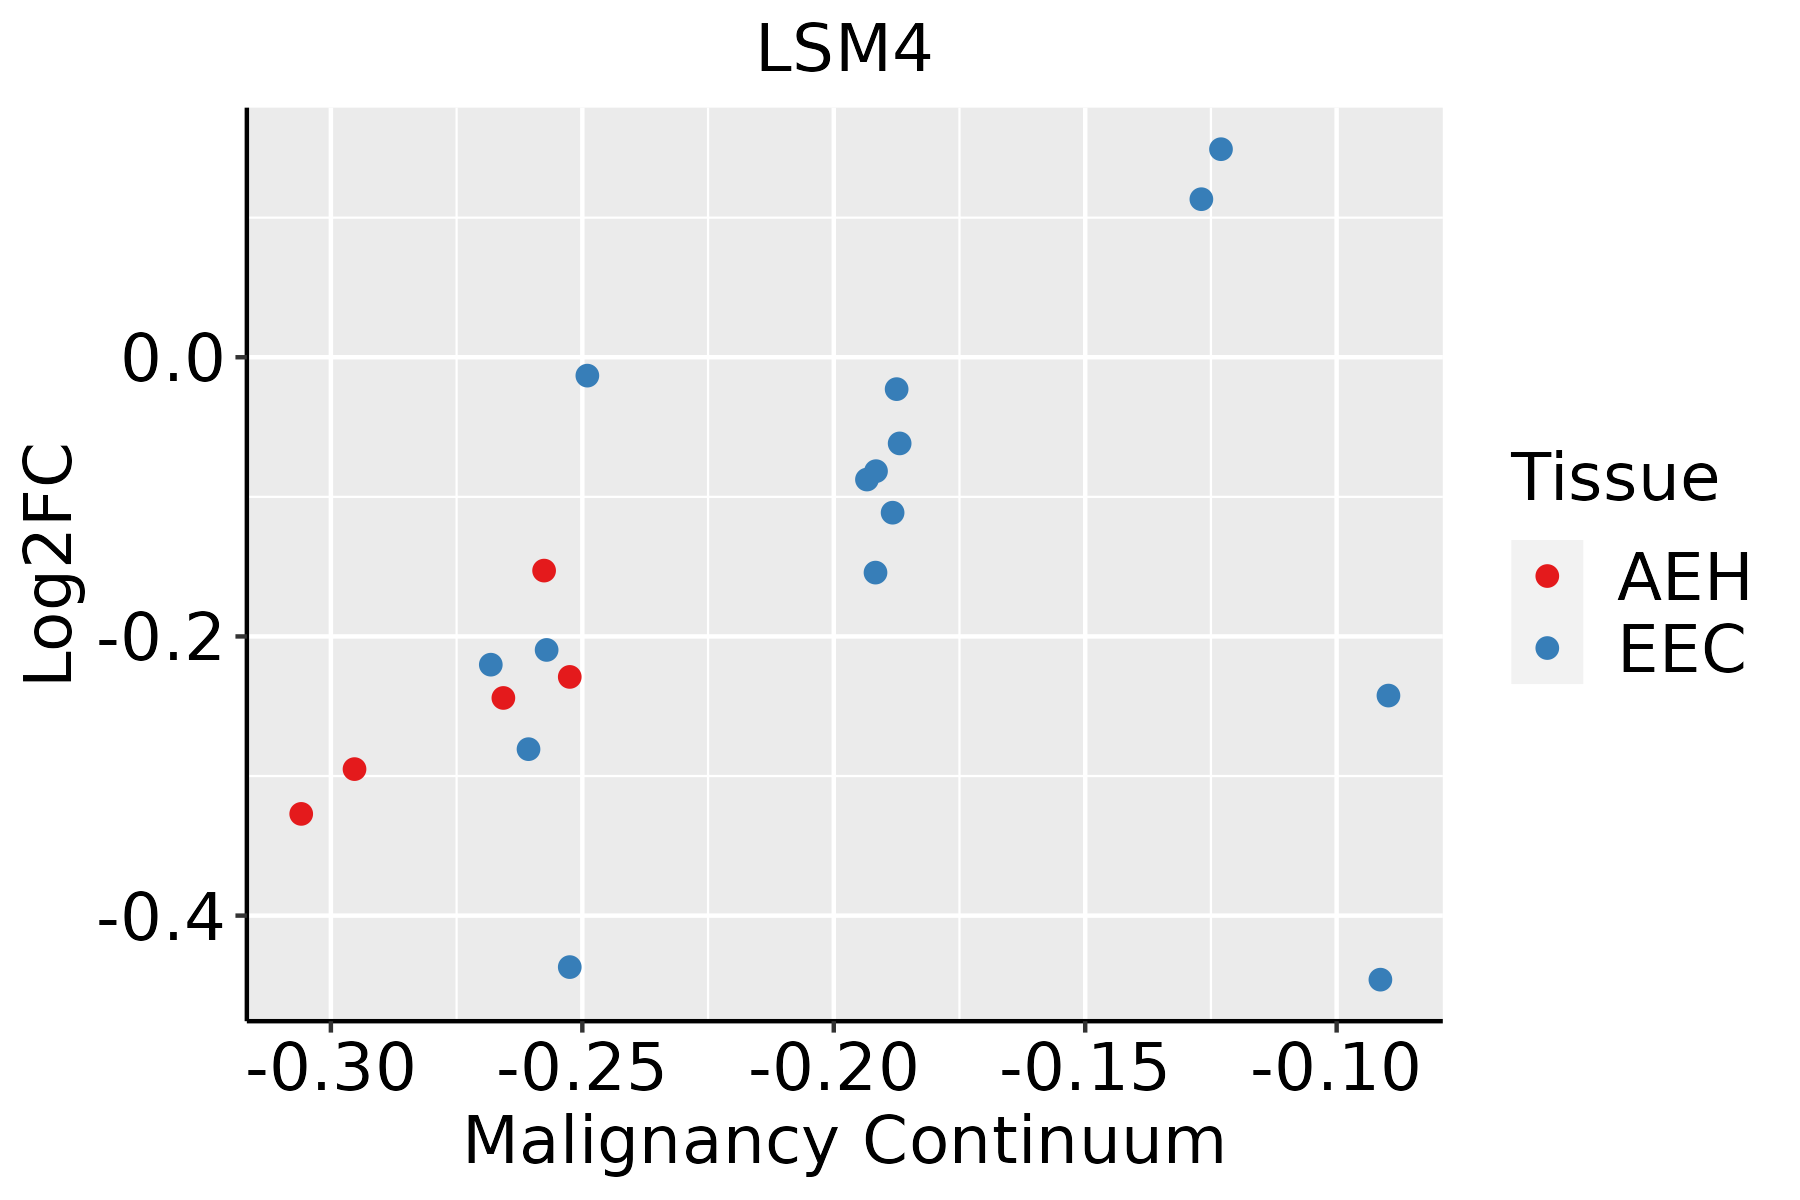 | AEH: Atypical endometrial hyperplasia |
| EEC: Endometrioid Cancer | ||
| Esophagus | 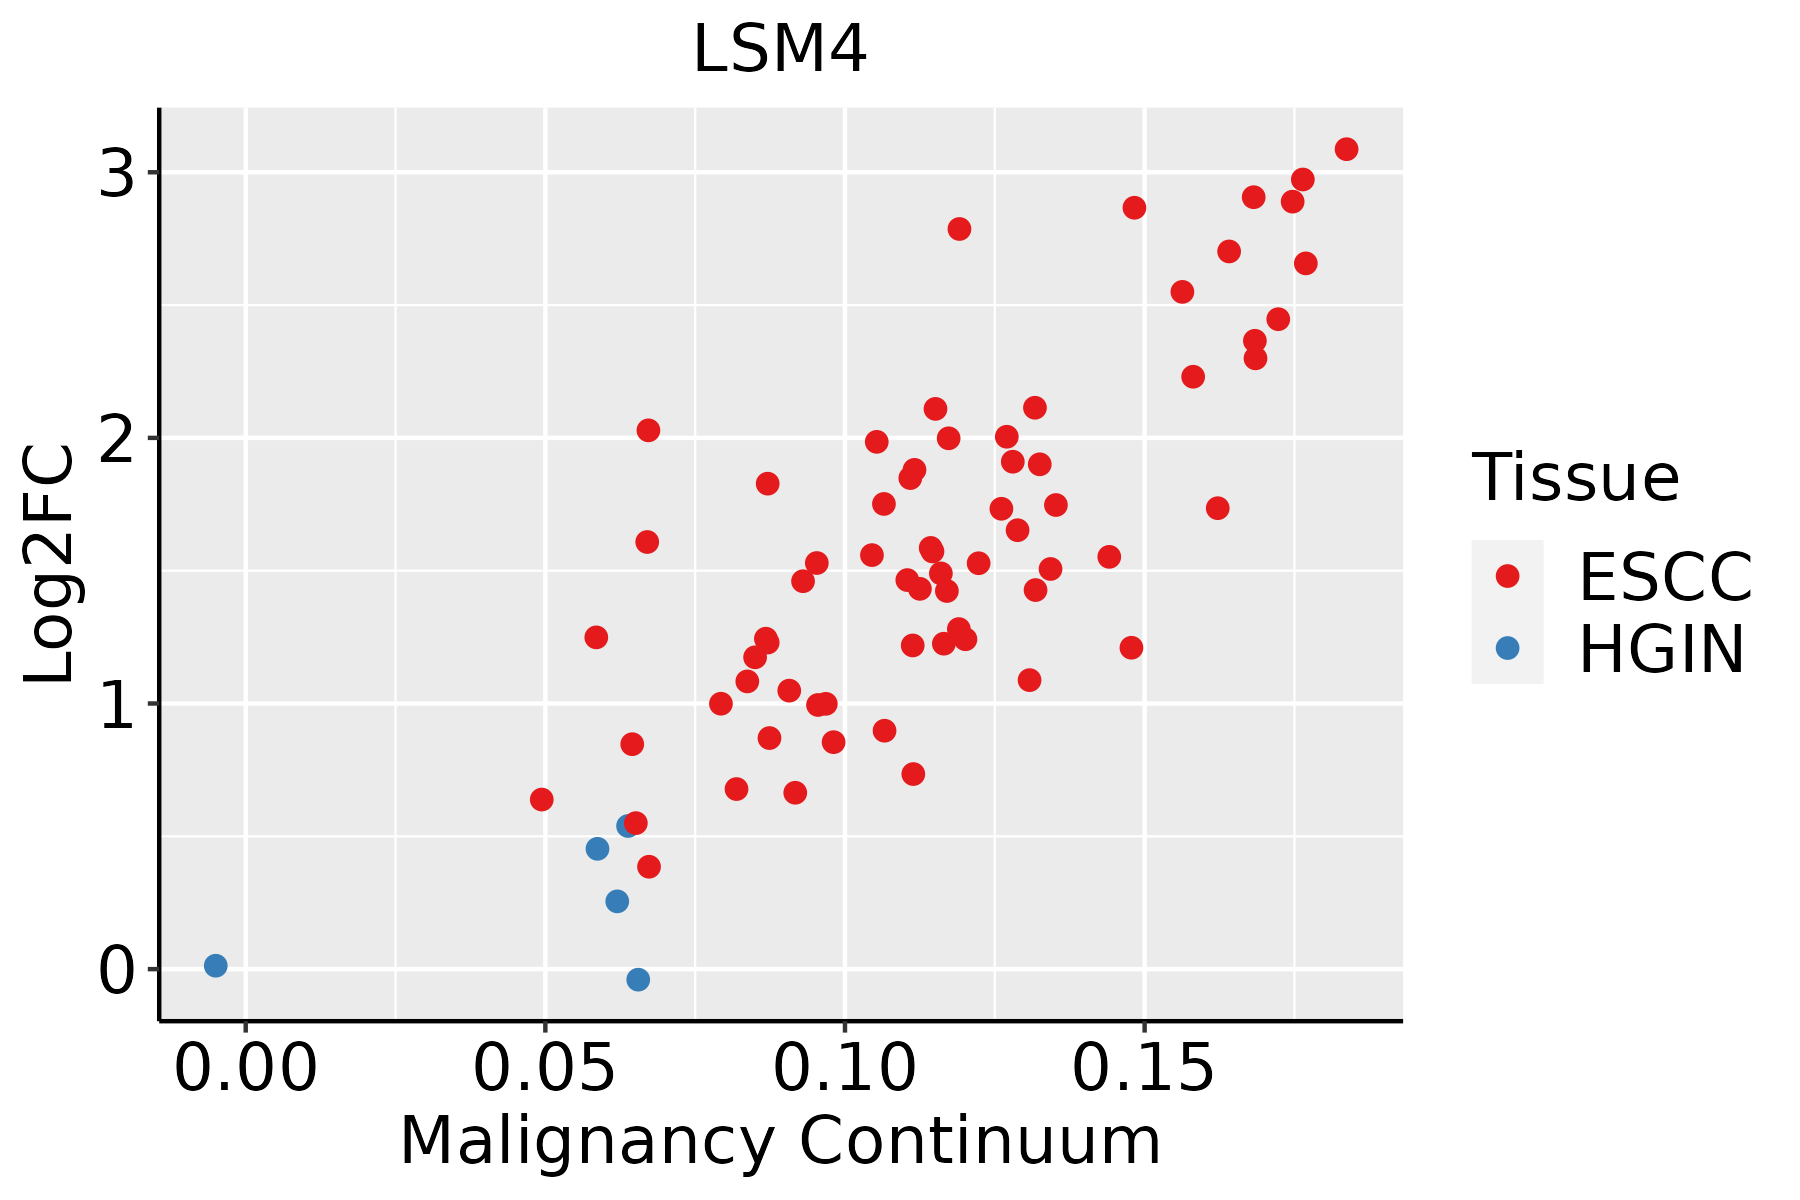 | ESCC: Esophageal squamous cell carcinoma |
| HGIN: High-grade intraepithelial neoplasias | ||
| LGIN: Low-grade intraepithelial neoplasias | ||
| Liver | 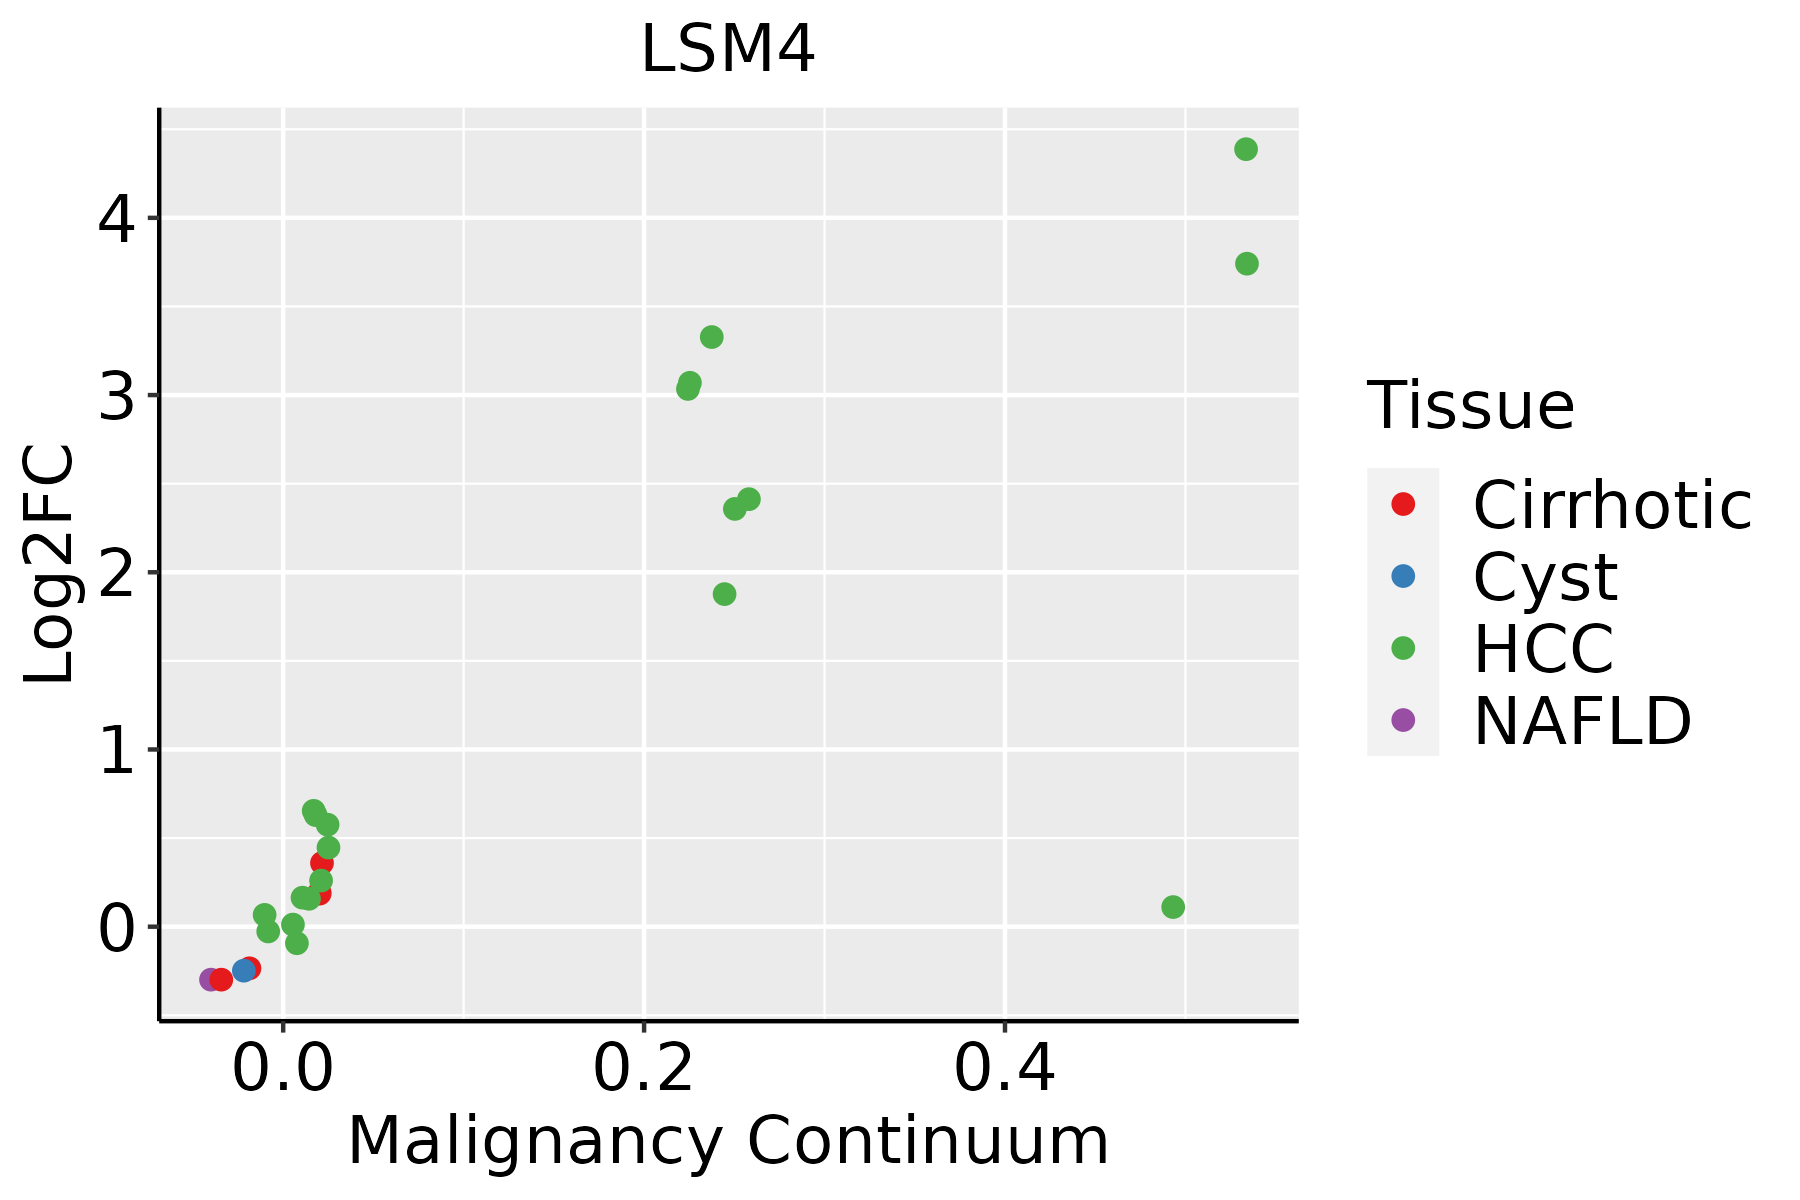 | HCC: Hepatocellular carcinoma |
| NAFLD: Non-alcoholic fatty liver disease | ||
| Oral Cavity |  | EOLP: Erosive Oral lichen planus |
| LP: leukoplakia | ||
| NEOLP: Non-erosive oral lichen planus | ||
| OSCC: Oral squamous cell carcinoma | ||
| Prostate | 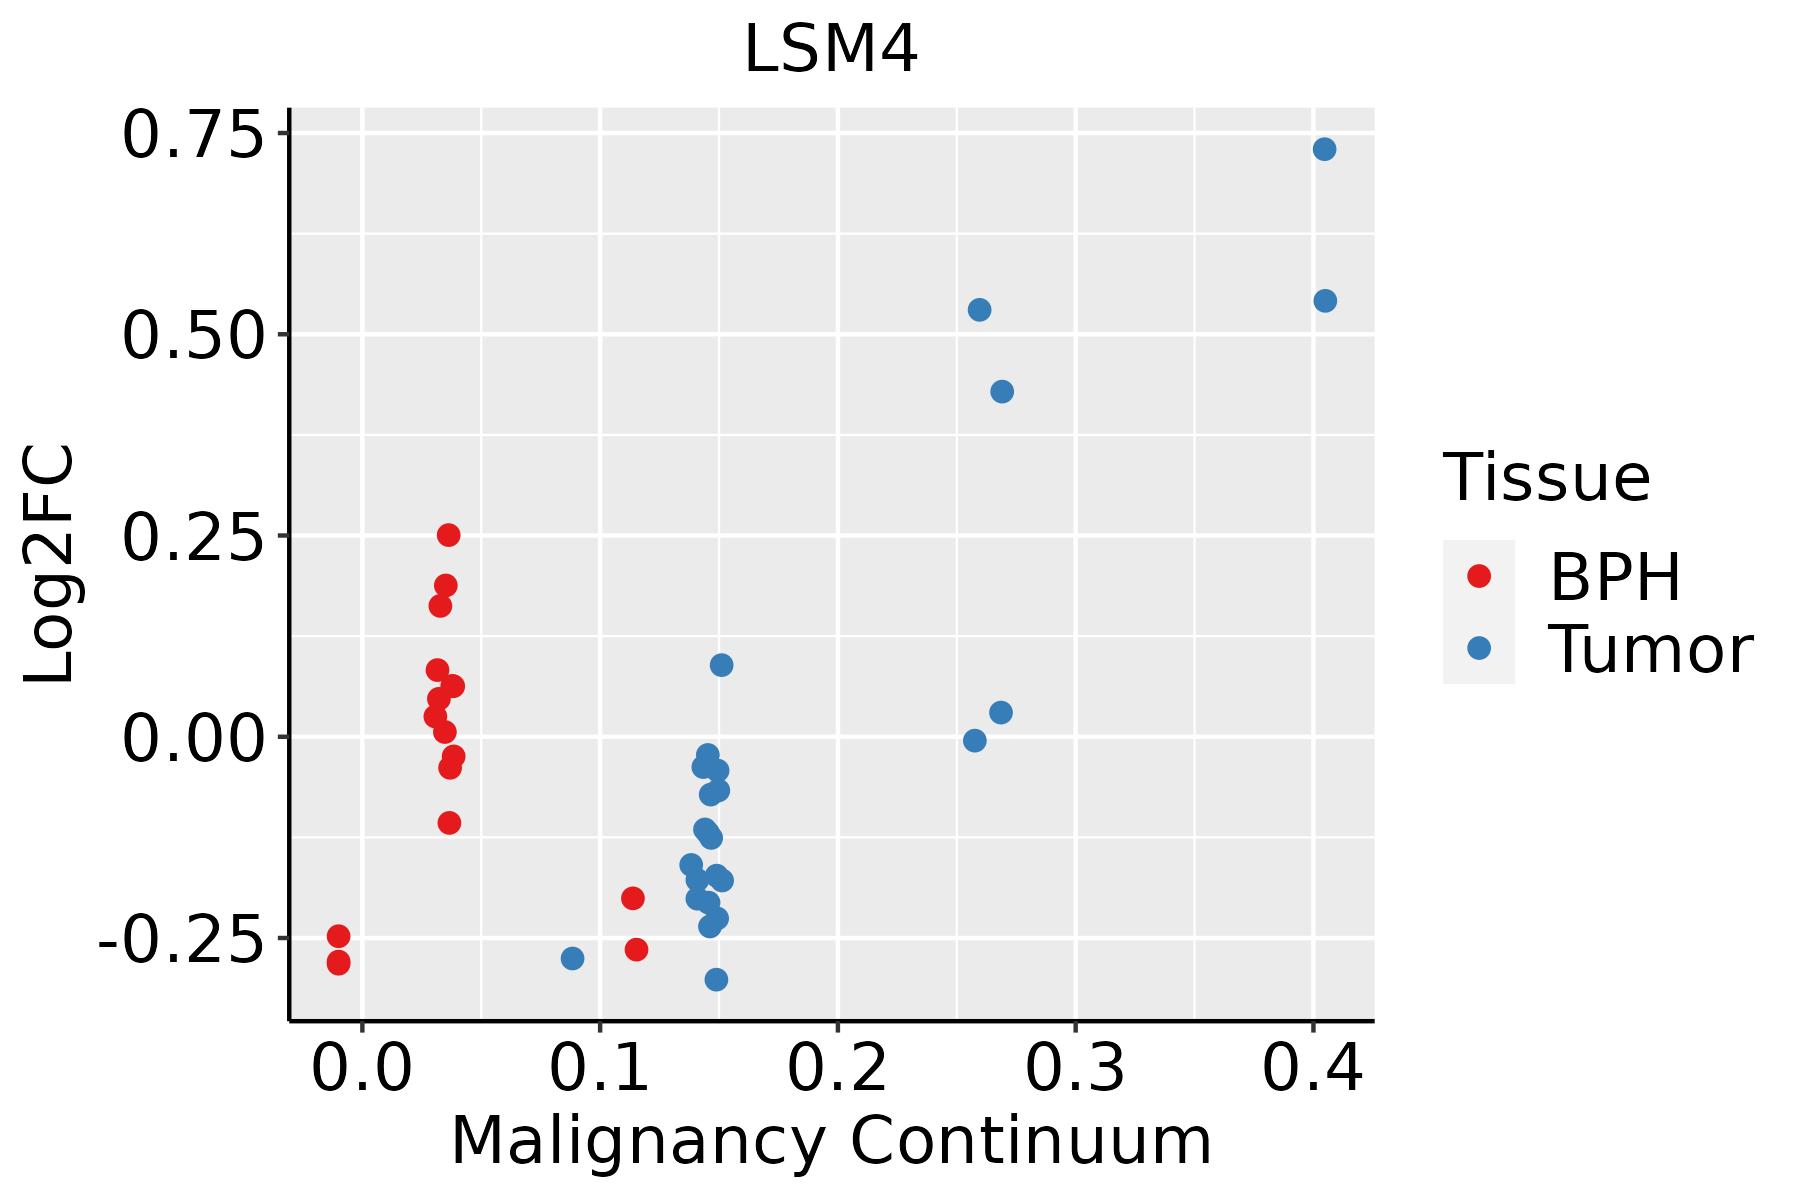 | BPH: Benign Prostatic Hyperplasia |
| Skin | 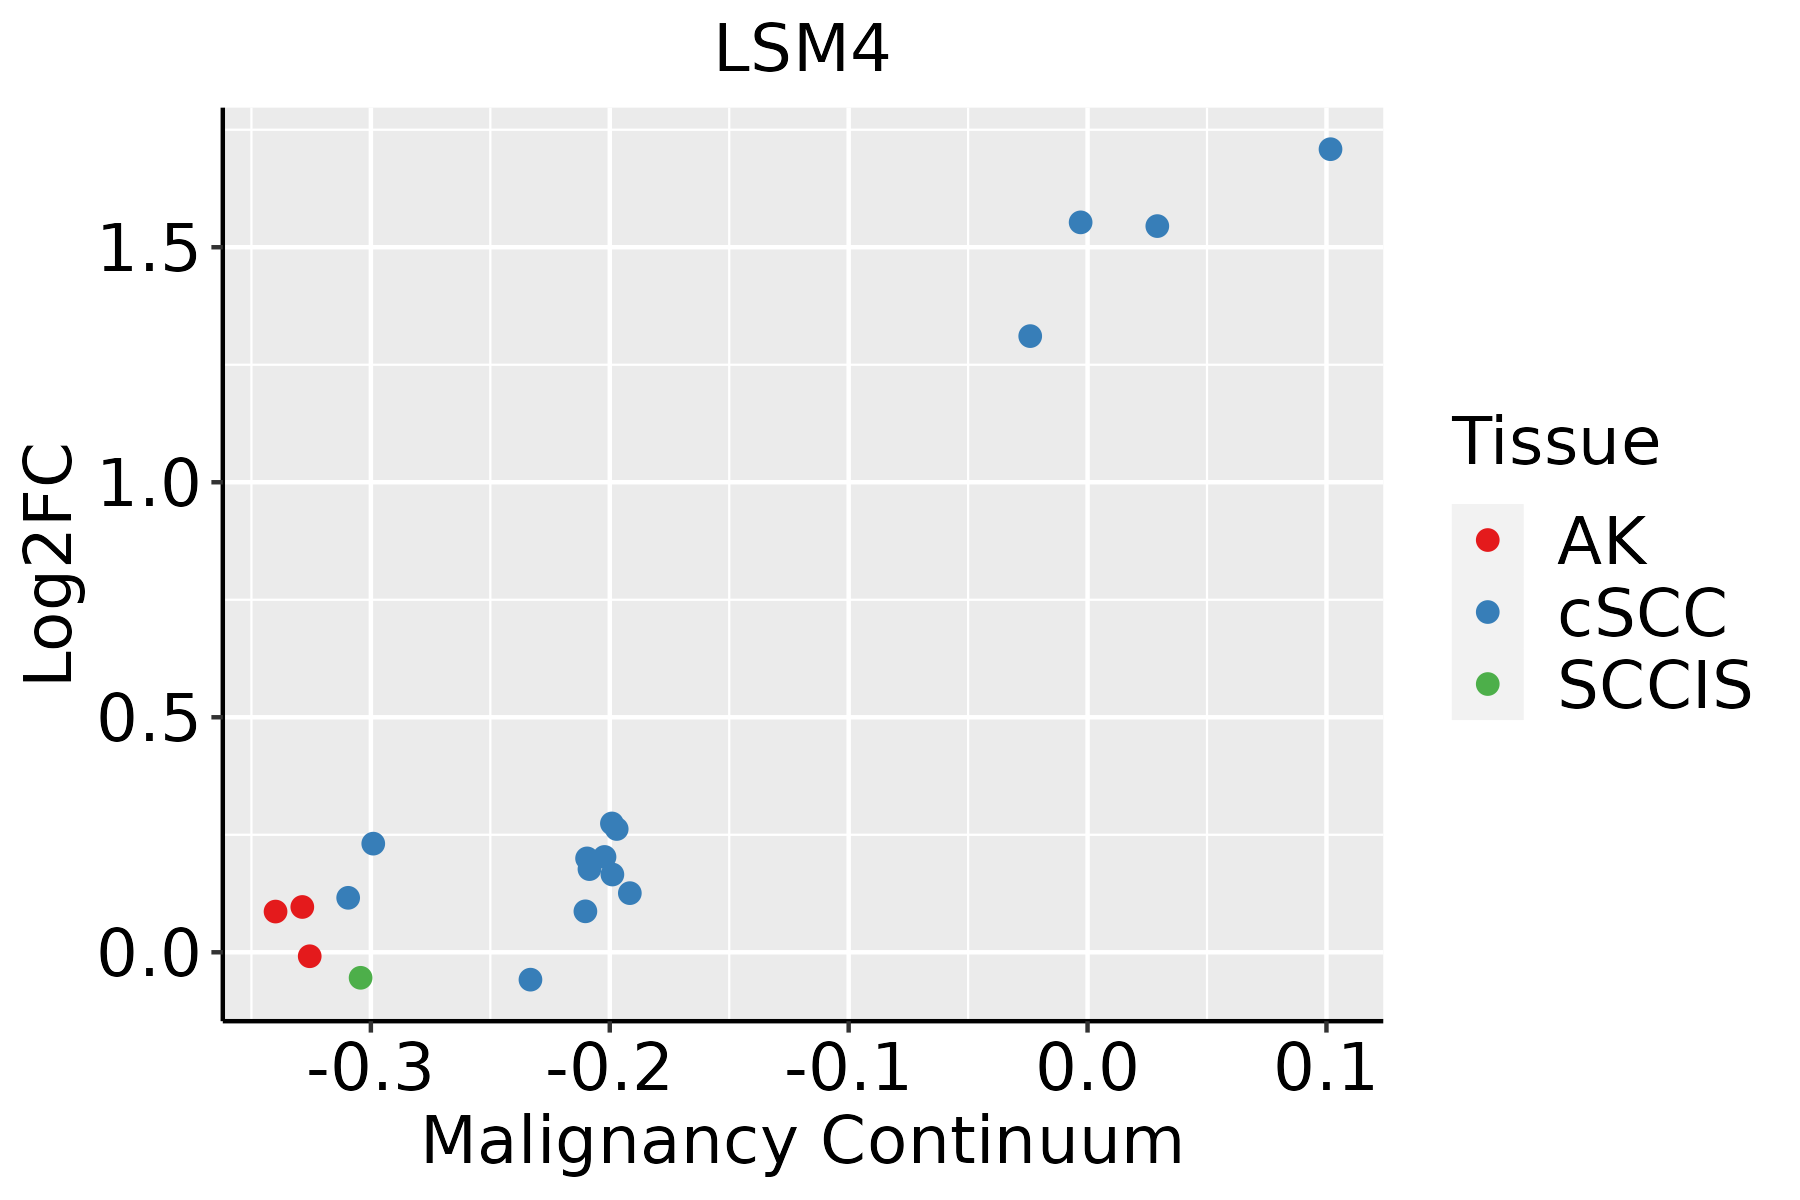 | AK: Actinic keratosis |
| cSCC: Cutaneous squamous cell carcinoma | ||
| SCCIS:squamous cell carcinoma in situ | ||
| Thyroid | 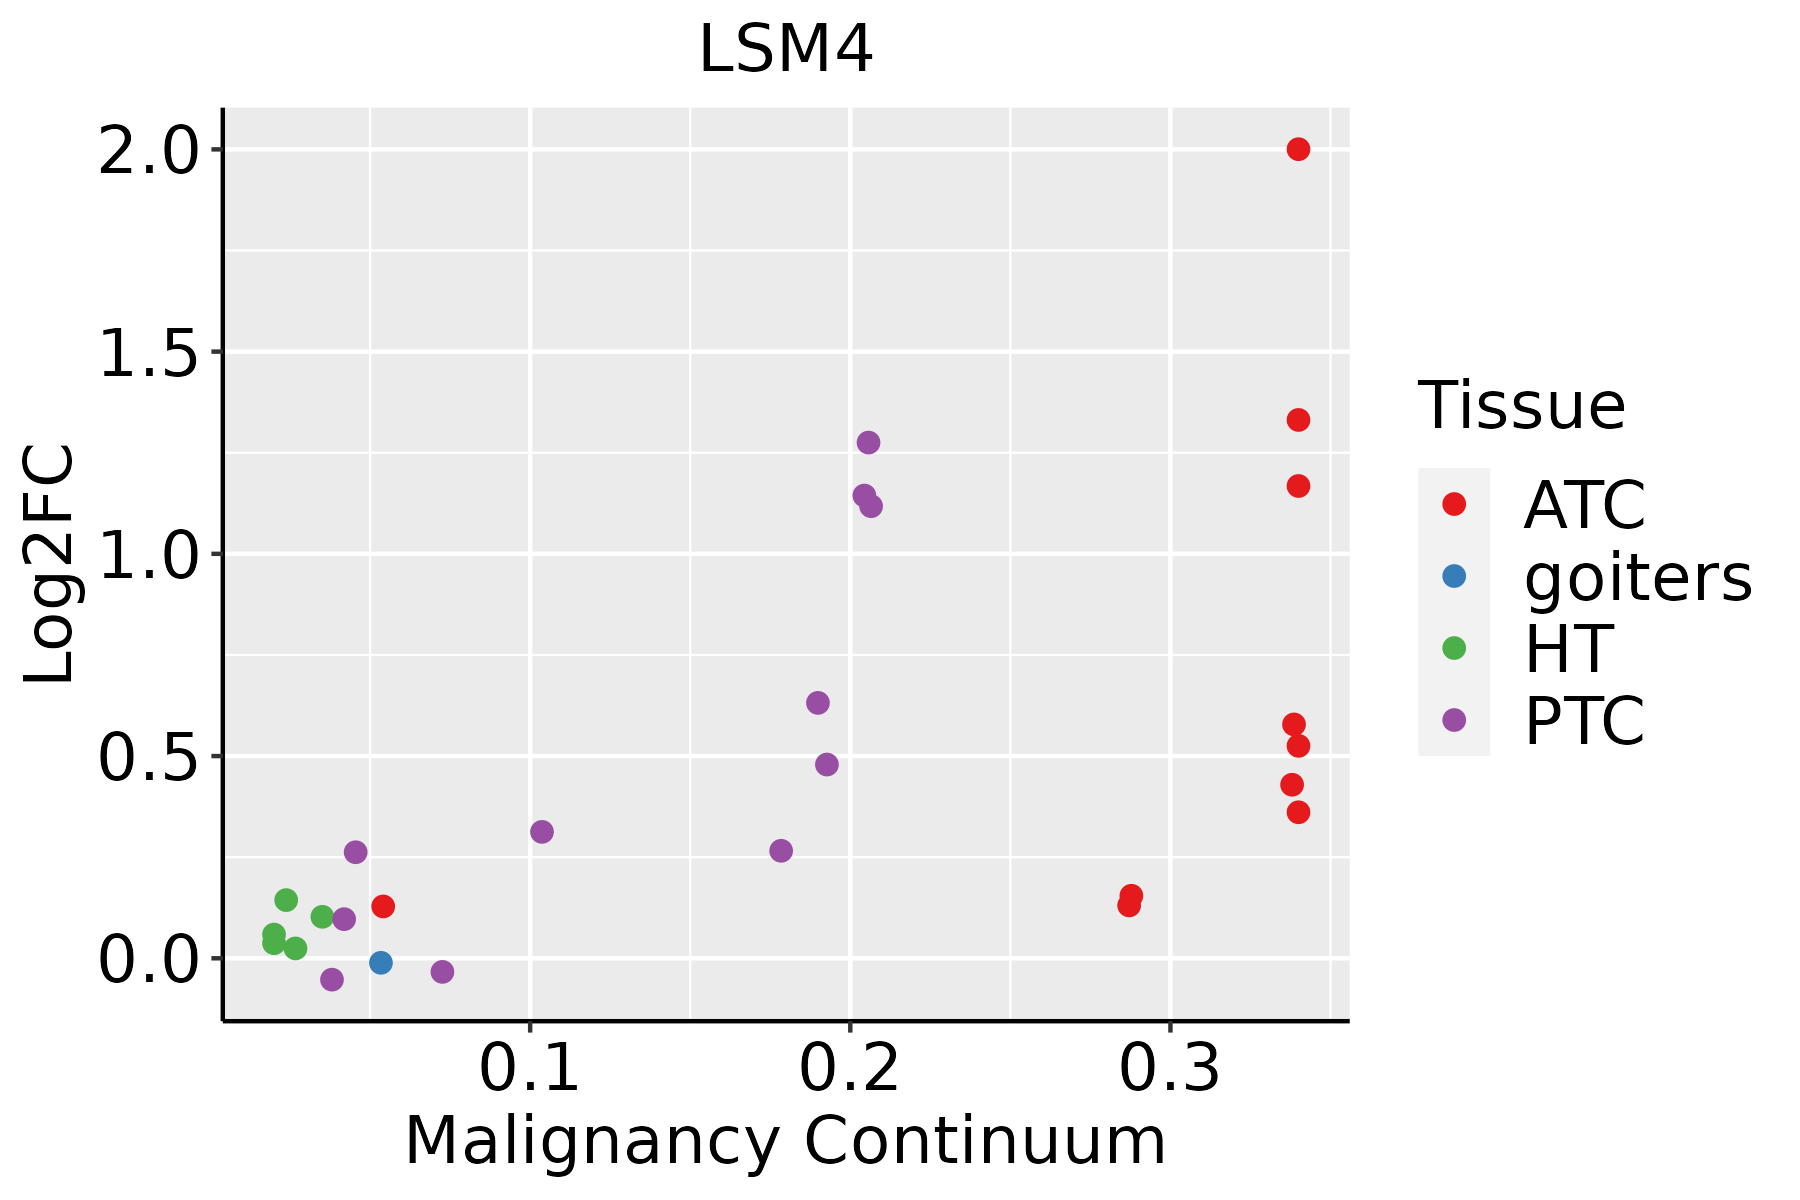 | ATC: Anaplastic thyroid cancer |
| HT: Hashimoto's thyroiditis | ||
| PTC: Papillary thyroid cancer |
| ∗log2FC in expression of this searched gene in stem-like cells from each diseased tissue sample relative to stem-like cells in normal samples in each tissue plotted against the malignancy continuum. Samples are colored based on if they are from different disease stage. |
Top |
Malignant transformation related pathway analysis |
| Find out the enriched GO biological processes and KEGG pathways involved in transition from healthy to precancer to cancer |
| Tissue | Disease Stage | Enriched GO biological Processes |
| Colorectum | AD |  |
| Colorectum | SER |  |
| Colorectum | MSS |  |
| Colorectum | MSI-H |  |
| Colorectum | FAP |  |
| ∗Top 15 enriched GO BP terms are showed in the bar plot of each disease state in each tissue. Each row represents a significant GO biological process which is colored according to the -log10(p.adjust). |
| Page: 1 2 3 4 5 6 7 8 9 |
| GO ID | Tissue | Disease Stage | Description | Gene Ratio | Bg Ratio | pvalue | p.adjust | Count |
| GO:190136111 | Liver | Cirrhotic | organic cyclic compound catabolic process | 213/4634 | 495/18723 | 1.58e-19 | 3.67e-17 | 213 |
| GO:001943911 | Liver | Cirrhotic | aromatic compound catabolic process | 202/4634 | 467/18723 | 6.93e-19 | 1.28e-16 | 202 |
| GO:004427011 | Liver | Cirrhotic | cellular nitrogen compound catabolic process | 195/4634 | 451/18723 | 2.99e-18 | 4.94e-16 | 195 |
| GO:004670011 | Liver | Cirrhotic | heterocycle catabolic process | 192/4634 | 445/18723 | 7.17e-18 | 1.12e-15 | 192 |
| GO:007182612 | Liver | Cirrhotic | ribonucleoprotein complex subunit organization | 115/4634 | 227/18723 | 2.67e-17 | 3.63e-15 | 115 |
| GO:002261812 | Liver | Cirrhotic | ribonucleoprotein complex assembly | 112/4634 | 220/18723 | 4.35e-17 | 5.81e-15 | 112 |
| GO:003465511 | Liver | Cirrhotic | nucleobase-containing compound catabolic process | 171/4634 | 407/18723 | 9.07e-15 | 9.33e-13 | 171 |
| GO:000640111 | Liver | Cirrhotic | RNA catabolic process | 126/4634 | 278/18723 | 4.64e-14 | 4.10e-12 | 126 |
| GO:000640211 | Liver | Cirrhotic | mRNA catabolic process | 109/4634 | 232/18723 | 1.30e-13 | 1.09e-11 | 109 |
| GO:000095611 | Liver | Cirrhotic | nuclear-transcribed mRNA catabolic process | 58/4634 | 112/18723 | 6.55e-10 | 3.06e-08 | 58 |
| GO:00339624 | Liver | Cirrhotic | P-body assembly | 12/4634 | 21/18723 | 1.53e-03 | 9.98e-03 | 12 |
| GO:002261322 | Liver | HCC | ribonucleoprotein complex biogenesis | 355/7958 | 463/18723 | 7.76e-52 | 4.92e-48 | 355 |
| GO:000838022 | Liver | HCC | RNA splicing | 313/7958 | 434/18723 | 1.36e-36 | 1.73e-33 | 313 |
| GO:004427021 | Liver | HCC | cellular nitrogen compound catabolic process | 303/7958 | 451/18723 | 9.76e-27 | 3.64e-24 | 303 |
| GO:004670021 | Liver | HCC | heterocycle catabolic process | 299/7958 | 445/18723 | 2.07e-26 | 7.29e-24 | 299 |
| GO:190136121 | Liver | HCC | organic cyclic compound catabolic process | 325/7958 | 495/18723 | 6.52e-26 | 2.18e-23 | 325 |
| GO:001943921 | Liver | HCC | aromatic compound catabolic process | 309/7958 | 467/18723 | 1.56e-25 | 4.94e-23 | 309 |
| GO:000037522 | Liver | HCC | RNA splicing, via transesterification reactions | 228/7958 | 324/18723 | 1.47e-24 | 4.06e-22 | 228 |
| GO:000640121 | Liver | HCC | RNA catabolic process | 201/7958 | 278/18723 | 3.88e-24 | 1.02e-21 | 201 |
| GO:003465521 | Liver | HCC | nucleobase-containing compound catabolic process | 273/7958 | 407/18723 | 4.84e-24 | 1.23e-21 | 273 |
| Page: 1 2 3 4 5 6 7 8 9 10 11 12 13 14 15 16 |
| Pathway ID | Tissue | Disease Stage | Description | Gene Ratio | Bg Ratio | pvalue | p.adjust | qvalue | Count |
| hsa030408 | Breast | Precancer | Spliceosome | 39/684 | 217/8465 | 1.44e-06 | 2.27e-05 | 1.74e-05 | 39 |
| hsa030186 | Breast | Precancer | RNA degradation | 14/684 | 79/8465 | 3.97e-03 | 2.37e-02 | 1.81e-02 | 14 |
| hsa0304013 | Breast | Precancer | Spliceosome | 39/684 | 217/8465 | 1.44e-06 | 2.27e-05 | 1.74e-05 | 39 |
| hsa0301811 | Breast | Precancer | RNA degradation | 14/684 | 79/8465 | 3.97e-03 | 2.37e-02 | 1.81e-02 | 14 |
| hsa0304023 | Breast | IDC | Spliceosome | 40/867 | 217/8465 | 1.53e-04 | 1.42e-03 | 1.06e-03 | 40 |
| hsa0301821 | Breast | IDC | RNA degradation | 16/867 | 79/8465 | 5.65e-03 | 3.13e-02 | 2.34e-02 | 16 |
| hsa0304033 | Breast | IDC | Spliceosome | 40/867 | 217/8465 | 1.53e-04 | 1.42e-03 | 1.06e-03 | 40 |
| hsa0301831 | Breast | IDC | RNA degradation | 16/867 | 79/8465 | 5.65e-03 | 3.13e-02 | 2.34e-02 | 16 |
| hsa0304043 | Breast | DCIS | Spliceosome | 40/846 | 217/8465 | 8.97e-05 | 8.52e-04 | 6.28e-04 | 40 |
| hsa030184 | Breast | DCIS | RNA degradation | 16/846 | 79/8465 | 4.45e-03 | 2.46e-02 | 1.82e-02 | 16 |
| hsa0304053 | Breast | DCIS | Spliceosome | 40/846 | 217/8465 | 8.97e-05 | 8.52e-04 | 6.28e-04 | 40 |
| hsa030185 | Breast | DCIS | RNA degradation | 16/846 | 79/8465 | 4.45e-03 | 2.46e-02 | 1.82e-02 | 16 |
| hsa03040 | Colorectum | AD | Spliceosome | 73/2092 | 217/8465 | 1.73e-03 | 9.68e-03 | 6.18e-03 | 73 |
| hsa030401 | Colorectum | AD | Spliceosome | 73/2092 | 217/8465 | 1.73e-03 | 9.68e-03 | 6.18e-03 | 73 |
| hsa030402 | Colorectum | MSS | Spliceosome | 66/1875 | 217/8465 | 2.58e-03 | 1.27e-02 | 7.81e-03 | 66 |
| hsa030403 | Colorectum | MSS | Spliceosome | 66/1875 | 217/8465 | 2.58e-03 | 1.27e-02 | 7.81e-03 | 66 |
| hsa030404 | Colorectum | MSI-H | Spliceosome | 37/797 | 217/8465 | 2.49e-04 | 3.23e-03 | 2.70e-03 | 37 |
| hsa030405 | Colorectum | MSI-H | Spliceosome | 37/797 | 217/8465 | 2.49e-04 | 3.23e-03 | 2.70e-03 | 37 |
| hsa030409 | Endometrium | AEH | Spliceosome | 54/1197 | 217/8465 | 1.47e-05 | 1.65e-04 | 1.21e-04 | 54 |
| hsa0304014 | Endometrium | AEH | Spliceosome | 54/1197 | 217/8465 | 1.47e-05 | 1.65e-04 | 1.21e-04 | 54 |
| Page: 1 2 3 |
Top |
Cell-cell communication analysis |
| Identification of potential cell-cell interactions between two cell types and their ligand-receptor pairs for different disease states |
| Ligand | Receptor | LRpair | Pathway | Tissue | Disease Stage |
| Page: 1 |
Top |
Single-cell gene regulatory network inference analysis |
| Find out the significant the regulons (TFs) and the target genes of each regulon across cell types for different disease states |
| TF | Cell Type | Tissue | Disease Stage | Target Gene | RSS | Regulon Activity |
| ∗The dot plots of a searched regulon are shown for all cell subpopulations in each disease state of each tissue based on the regulon specific score inferred using pySCENIC and by calculating the average expression. |
| Page: 1 |
Top |
Somatic mutation of malignant transformation related genes |
| Annotation of somatic variants for genes involved in malignant transformation |
| Hugo Symbol | Variant Class | Variant Classification | dbSNP RS | HGVSc | HGVSp | HGVSp Short | SWISSPROT | BIOTYPE | SIFT | PolyPhen | Tumor Sample Barcode | Tissue | Histology | Sex | Age | Stage | Therapy Types | Drugs | Outcome |
| LSM4 | SNV | Missense_Mutation | c.137C>T | p.Thr46Met | p.T46M | Q9Y4Z0 | protein_coding | deleterious(0) | probably_damaging(0.956) | TCGA-AR-A0TS-01 | Breast | breast invasive carcinoma | Female | <65 | I/II | Chemotherapy | doxorubicin | SD | |
| LSM4 | SNV | Missense_Mutation | rs764476513 | c.172G>A | p.Glu58Lys | p.E58K | Q9Y4Z0 | protein_coding | deleterious(0.01) | possibly_damaging(0.545) | TCGA-AA-3864-01 | Colorectum | colon adenocarcinoma | Male | >=65 | I/II | Unknown | Unknown | SD |
| LSM4 | SNV | Missense_Mutation | c.169C>T | p.Pro57Ser | p.P57S | Q9Y4Z0 | protein_coding | tolerated(0.13) | benign(0.055) | TCGA-AD-6895-01 | Colorectum | colon adenocarcinoma | Male | >=65 | III/IV | Unknown | Unknown | SD | |
| LSM4 | SNV | Missense_Mutation | rs781537682 | c.164G>A | p.Arg55Gln | p.R55Q | Q9Y4Z0 | protein_coding | deleterious(0.01) | benign(0.183) | TCGA-AJ-A8CT-01 | Endometrium | uterine corpus endometrioid carcinoma | Female | <65 | I/II | Unknown | Unknown | SD |
| LSM4 | SNV | Missense_Mutation | rs780420380 | c.217N>A | p.Asp73Asn | p.D73N | Q9Y4Z0 | protein_coding | tolerated(0.07) | benign(0.151) | TCGA-AX-A0J1-01 | Endometrium | uterine corpus endometrioid carcinoma | Female | >=65 | I/II | Unknown | Unknown | SD |
| LSM4 | SNV | Missense_Mutation | novel | c.319N>A | p.Ala107Thr | p.A107T | Q9Y4Z0 | protein_coding | tolerated(0.11) | benign(0.001) | TCGA-AX-A2HD-01 | Endometrium | uterine corpus endometrioid carcinoma | Female | >=65 | III/IV | Unknown | Unknown | SD |
| LSM4 | SNV | Missense_Mutation | c.208C>T | p.Arg70Cys | p.R70C | Q9Y4Z0 | protein_coding | deleterious(0.02) | possibly_damaging(0.502) | TCGA-B5-A3FC-01 | Endometrium | uterine corpus endometrioid carcinoma | Female | <65 | I/II | Unknown | Unknown | SD | |
| LSM4 | SNV | Missense_Mutation | novel | c.253G>C | p.Ala85Pro | p.A85P | Q9Y4Z0 | protein_coding | tolerated(0.07) | benign(0.43) | TCGA-DI-A1NO-01 | Endometrium | uterine corpus endometrioid carcinoma | Female | >=65 | III/IV | Unknown | Unknown | PD |
| LSM4 | SNV | Missense_Mutation | c.8N>T | p.Pro3Leu | p.P3L | Q9Y4Z0 | protein_coding | deleterious(0) | probably_damaging(1) | TCGA-18-3409-01 | Lung | lung squamous cell carcinoma | Male | >=65 | I/II | Unknown | Unknown | PD | |
| LSM4 | SNV | Missense_Mutation | c.159N>G | p.Phe53Leu | p.F53L | Q9Y4Z0 | protein_coding | deleterious(0.01) | possibly_damaging(0.477) | TCGA-34-5929-01 | Lung | lung squamous cell carcinoma | Female | >=65 | I/II | Unknown | Unknown | SD |
| Page: 1 2 |
Top |
Related drugs of malignant transformation related genes |
| Identification of chemicals and drugs interact with genes involved in malignant transfromation |
| (DGIdb 4.0) |
| Entrez ID | Symbol | Category | Interaction Types | Drug Claim Name | Drug Name | PMIDs |
| Page: 1 |

Copyright 2023-Present -The University of Texas Health Science Center at Houston |