Schematic overview of the cellular and molecular mechanisms involved in the cancer progression, including the proposed cellular and molecular mechanisms in cancer cells trajectory. AT1: alveolar type 1 cells; AT2: alveolar type 2 cells; AAH: atypical adenomatous hyperplasia; AIS: adenocarcinoma in situ; MIA: minimally invasive adenocarcinoma; IA: invasive adenocarcinoma; EMT: epithelial-mesenchymal transition

Home

Download

Statistics

Help

Contact

Center for Computational Systems Medicine
leaf

Gene summary

leaf

Malignant transformation analysis

leaf

Malignant transformation related pathway analysis

leaf

Cell-cell communication analysis

leaf

Single-cell gene regulatory network inference analysis

leaf

Somatic mutation of malignant transformation related genes

leaf

Related drugs of malignant transformation related genes

Gene: LIMS1

Gene summary for LIMS1

check button Gene summary.

Gene informationSpeciesHuman
Gene symbol

LIMS1

Gene ID

3987

Gene nameLIM zinc finger domain containing 1
Gene AliasPINCH
Cytomap2q12.3
Gene Typeprotein-coding
GO ID

GO:0000902

UniProtAcc

P48059


Top

Malignant transformation analysis

check button Identification of the aberrant gene expression in precancerous and cancerous lesions by comparing the gene expression of stem-like cells in diseased tissues with normal stem cells
check button Malignant transformation involving gene list.
Entrez IDSymbolReplicatesSpeciesOrganTissueAdj P-valueLog2FCMalignancy
3987LIMS1AEH-subject3HumanEndometriumAEH4.82e-02-1.98e-01-0.2576
3987LIMS1EEC-subject1HumanEndometriumEEC4.71e-036.95e-02-0.2682
3987LIMS1EEC-subject2HumanEndometriumEEC6.57e-06-3.53e-01-0.2607
3987LIMS1EEC-subject3HumanEndometriumEEC2.48e-22-3.67e-01-0.2525
3987LIMS1GSM6177620_NYU_UCEC1_lib1_lib1HumanEndometriumEEC6.90e-22-5.55e-01-0.1869
3987LIMS1GSM6177620_NYU_UCEC1_lib2_lib2HumanEndometriumEEC1.99e-26-6.42e-01-0.1875
3987LIMS1GSM6177620_NYU_UCEC1_lib3_lib3HumanEndometriumEEC1.07e-21-5.25e-01-0.1883
3987LIMS1GSM6177621_NYU_UCEC2_lib1_lib1HumanEndometriumEEC5.38e-27-4.57e-01-0.1934
3987LIMS1GSM6177622_NYU_UCEC3_lib1_lib1HumanEndometriumEEC5.53e-50-6.98e-01-0.1917
3987LIMS1GSM6177622_NYU_UCEC3_lib2_lib2HumanEndometriumEEC1.17e-43-7.64e-01-0.1916
3987LIMS1GSM6177623_NYU_UCEC3_VisHumanEndometriumEEC8.90e-16-4.93e-01-0.1269
3987LIMS1LZE2DHumanEsophagusHGIN2.29e-034.43e-010.0642
3987LIMS1LZE2THumanEsophagusESCC1.66e-059.74e-010.082
3987LIMS1LZE3DHumanEsophagusHGIN1.12e-058.33e-010.0668
3987LIMS1LZE4THumanEsophagusESCC9.91e-451.51e+000.0811
3987LIMS1LZE7THumanEsophagusESCC4.63e-137.30e-010.0667
3987LIMS1LZE8THumanEsophagusESCC5.57e-144.05e-010.067
3987LIMS1LZE20THumanEsophagusESCC2.61e-041.89e-010.0662
3987LIMS1LZE22D1HumanEsophagusHGIN4.17e-027.00e-020.0595
3987LIMS1LZE22THumanEsophagusESCC1.43e-022.96e-010.068
Page: 1 2 3 4 5 6 7 8 

check button Transcriptomic changes along malignancy continuum.
TissueExpression DynamicsAbbreviation
EndometriumThe image shows the transcriptomic changes along malignancy continuum.log2FC in expression of this searched gene in stem-like cells from each diseased tissue sample relative to stem-like cells in normal samples in each tissue plotted against the malignancy continuum. Samples are colored based on if they are from different disease stage.
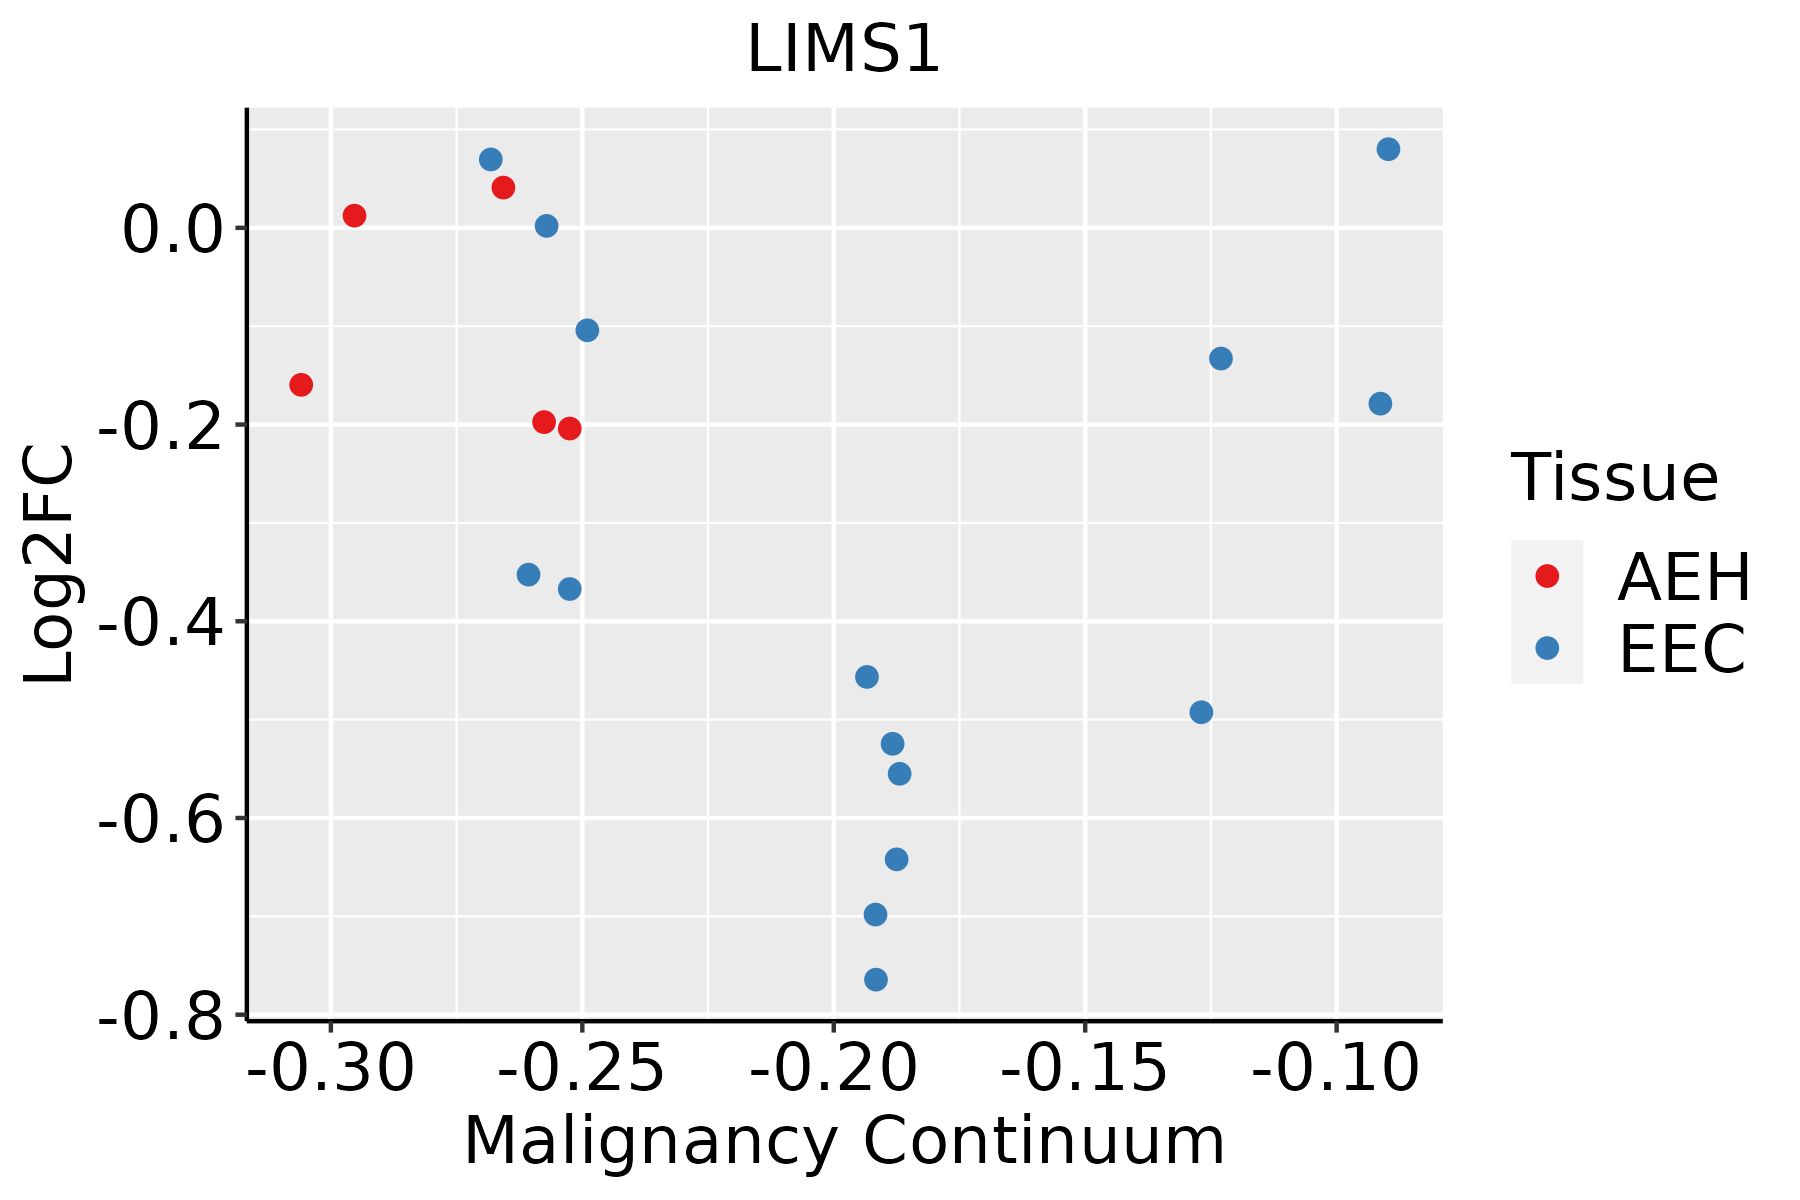
AEH: Atypical endometrial hyperplasia
EEC: Endometrioid Cancer
EsophagusThe image shows the transcriptomic changes along malignancy continuum.log2FC in expression of this searched gene in stem-like cells from each diseased tissue sample relative to stem-like cells in normal samples in each tissue plotted against the malignancy continuum. Samples are colored based on if they are from different disease stage.
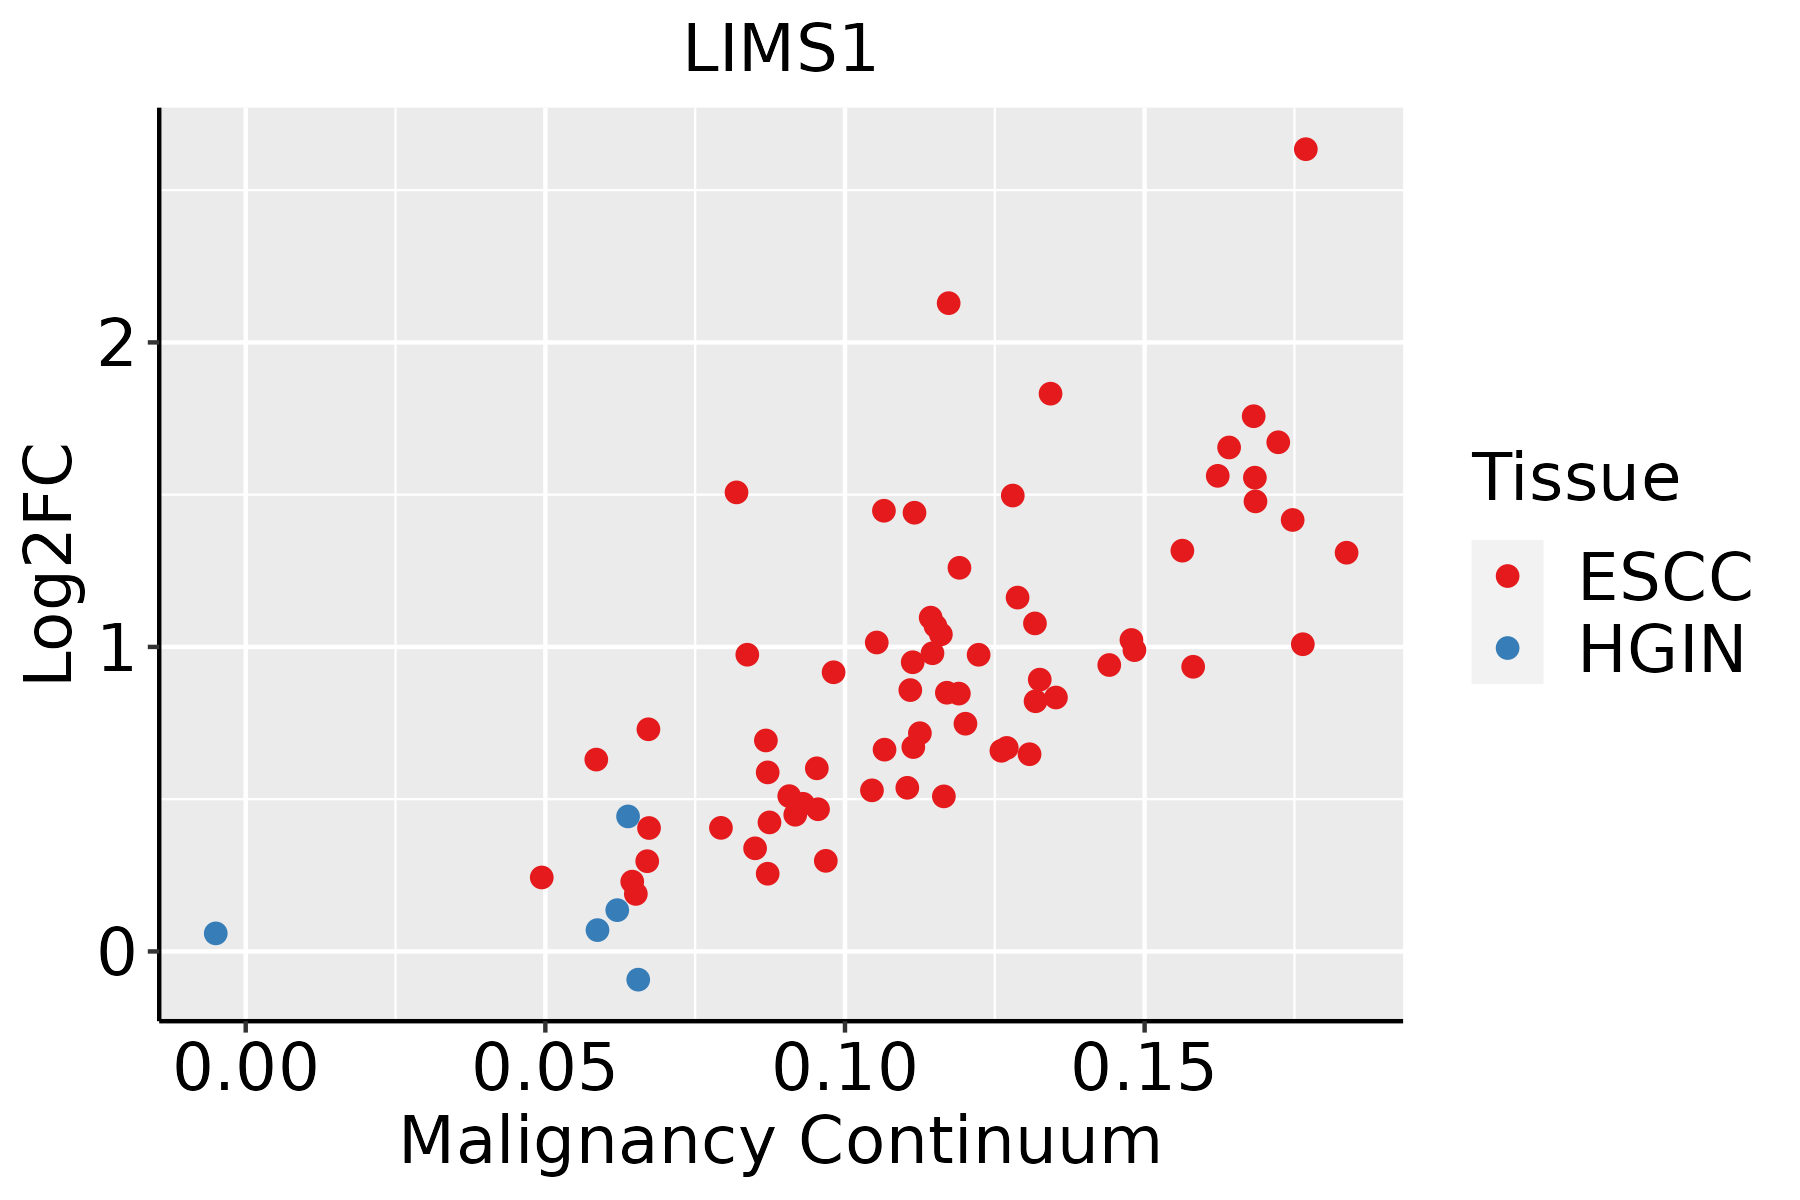
ESCC: Esophageal squamous cell carcinoma
HGIN: High-grade intraepithelial neoplasias
LGIN: Low-grade intraepithelial neoplasias
LiverThe image shows the transcriptomic changes along malignancy continuum.log2FC in expression of this searched gene in stem-like cells from each diseased tissue sample relative to stem-like cells in normal samples in each tissue plotted against the malignancy continuum. Samples are colored based on if they are from different disease stage.
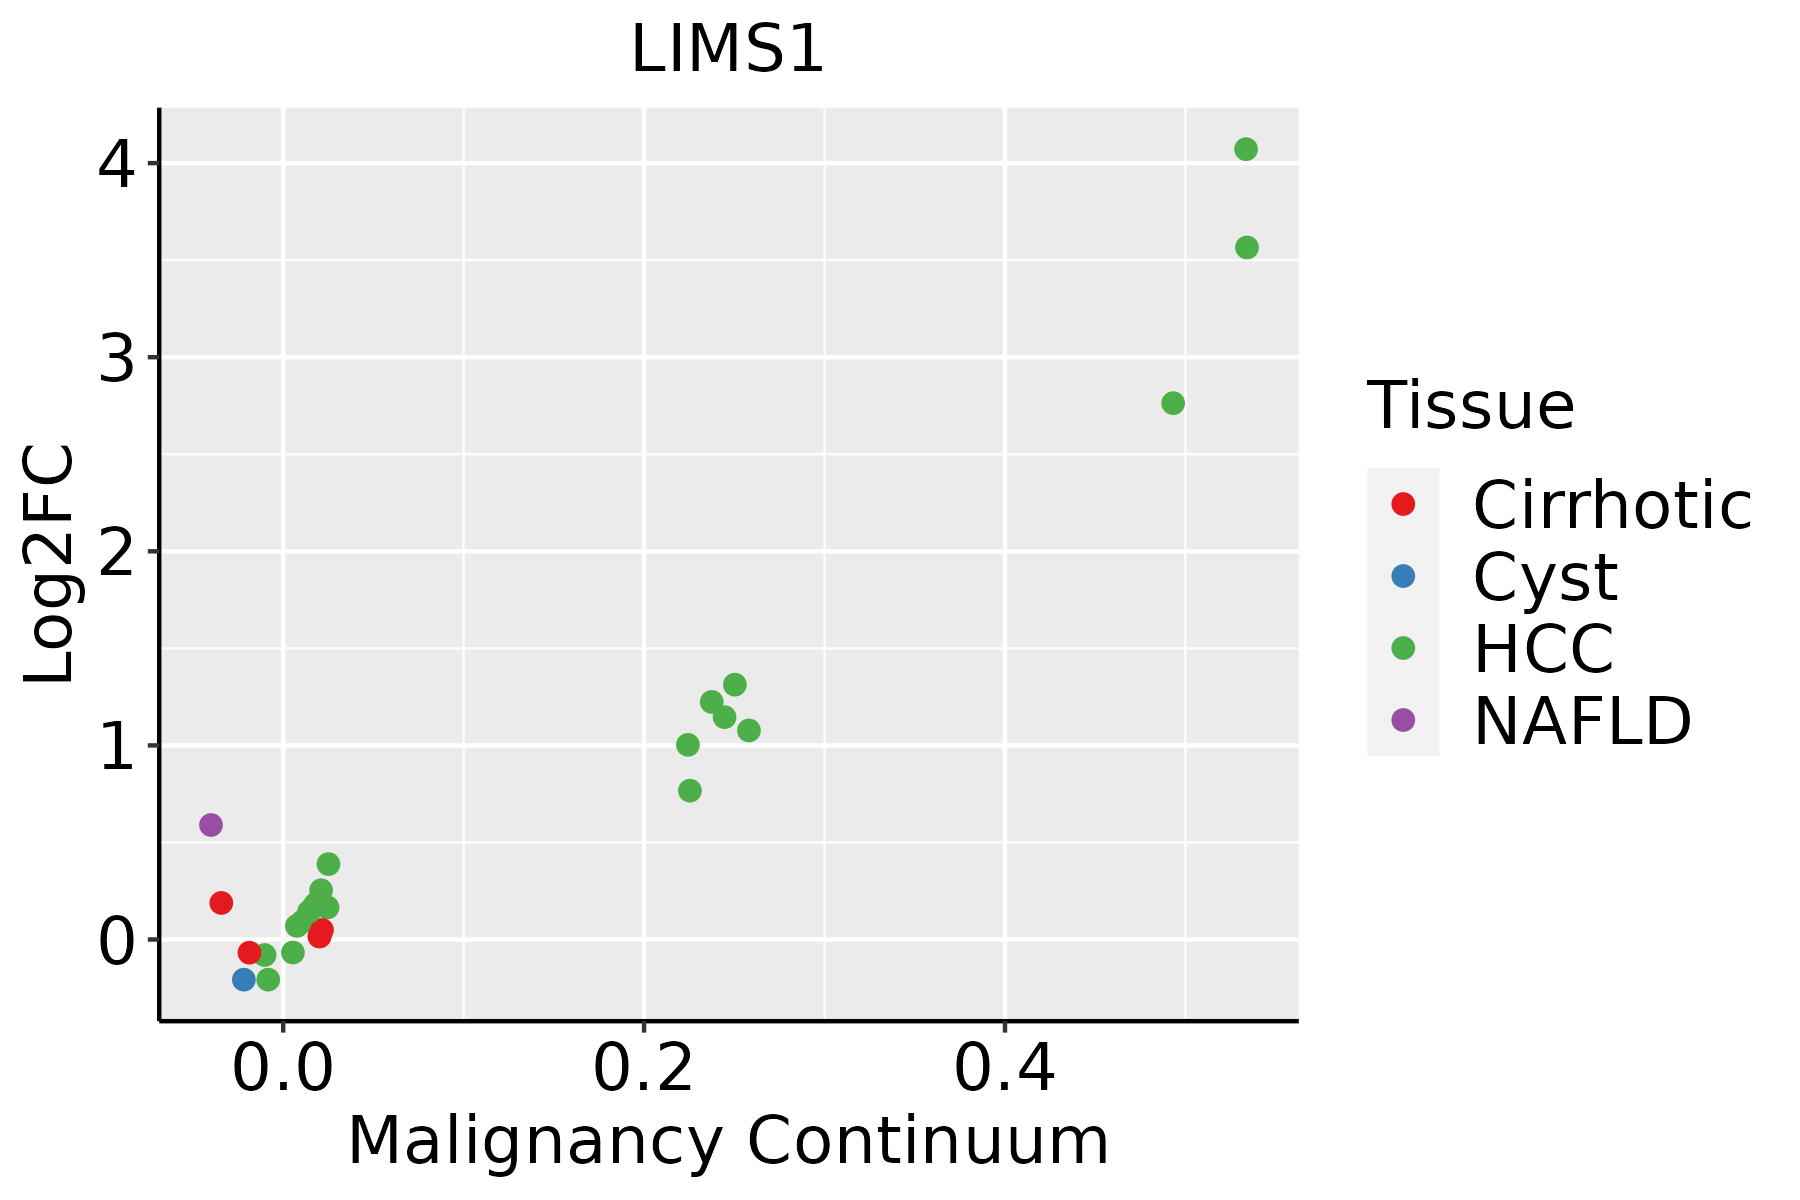
HCC: Hepatocellular carcinoma
NAFLD: Non-alcoholic fatty liver disease
LungThe image shows the transcriptomic changes along malignancy continuum.log2FC in expression of this searched gene in stem-like cells from each diseased tissue sample relative to stem-like cells in normal samples in each tissue plotted against the malignancy continuum. Samples are colored based on if they are from different disease stage.
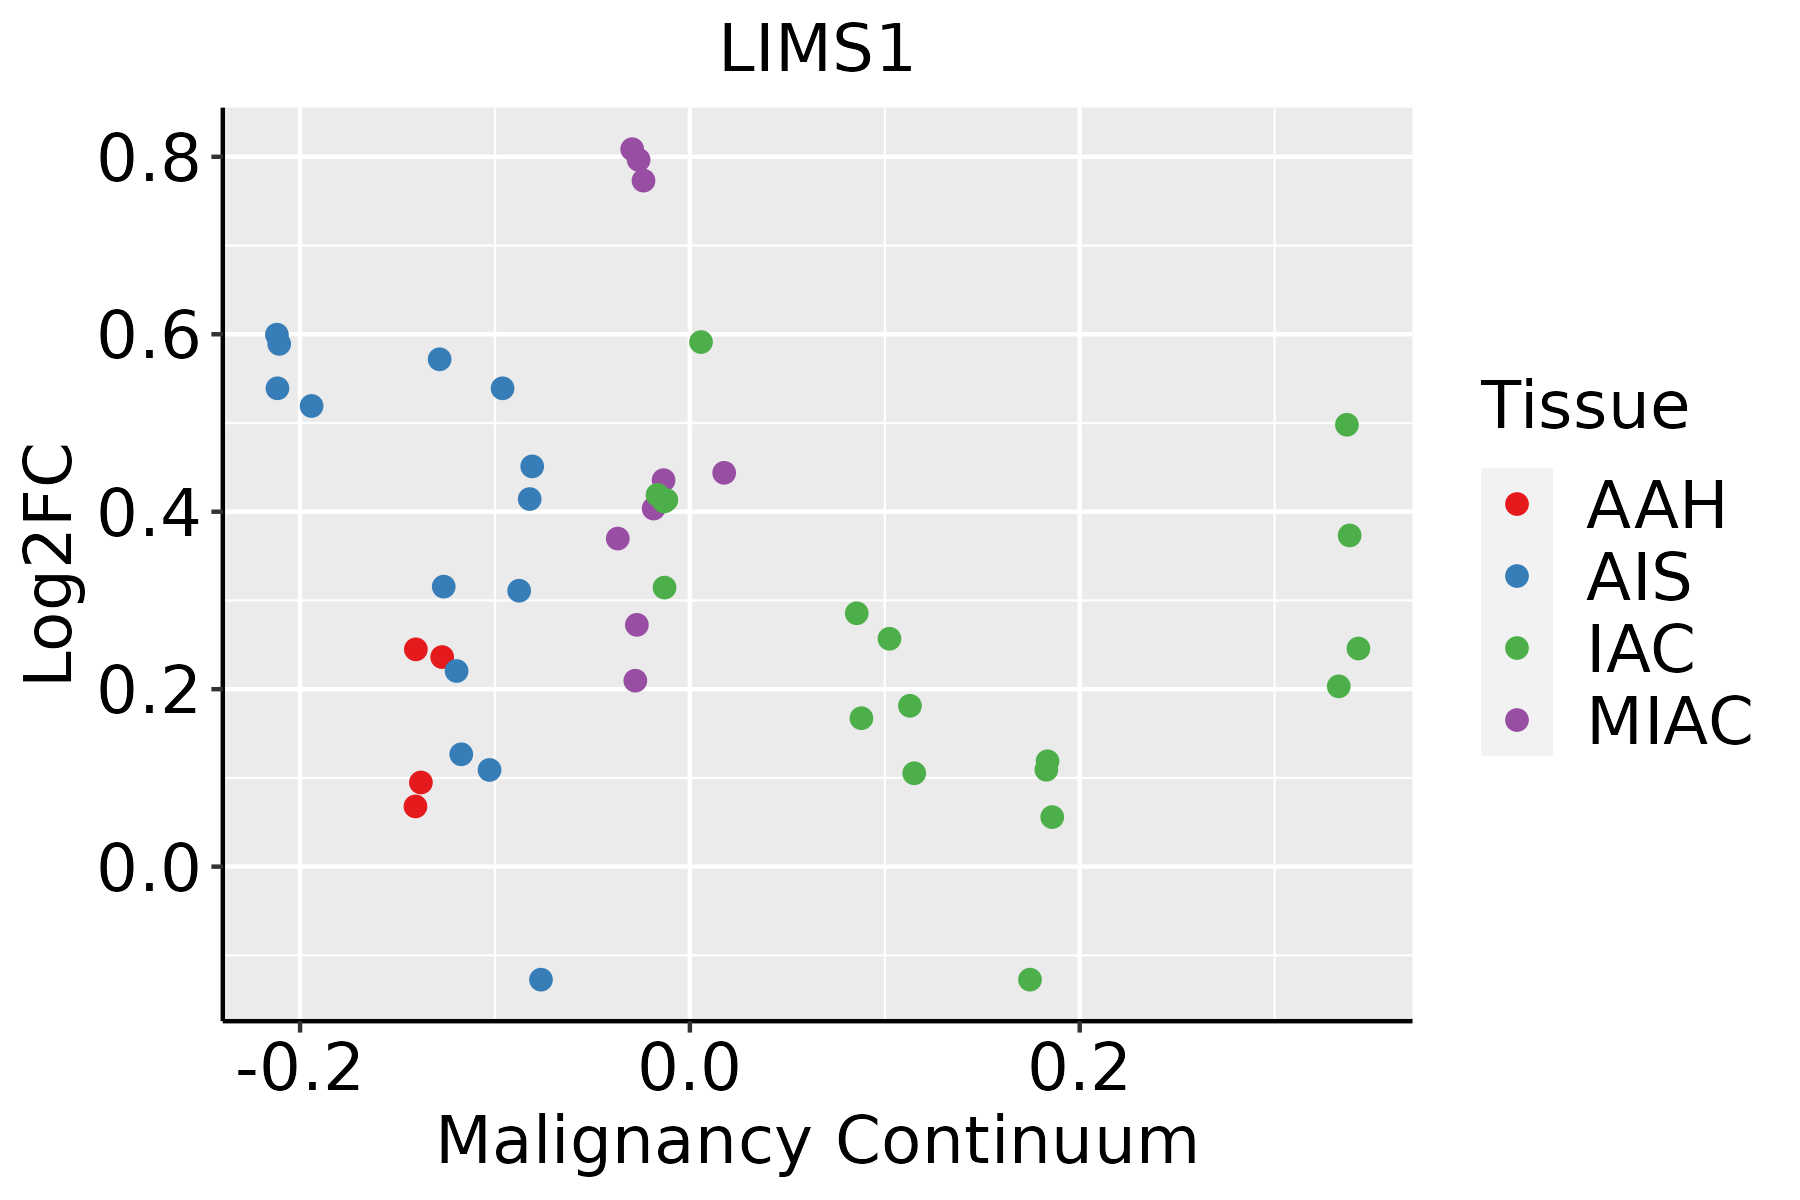
AAH: Atypical adenomatous hyperplasia
AIS: Adenocarcinoma in situ
IAC: Invasive lung adenocarcinoma
MIA: Minimally invasive adenocarcinoma
Oral CavityThe image shows the transcriptomic changes along malignancy continuum.log2FC in expression of this searched gene in stem-like cells from each diseased tissue sample relative to stem-like cells in normal samples in each tissue plotted against the malignancy continuum. Samples are colored based on if they are from different disease stage.
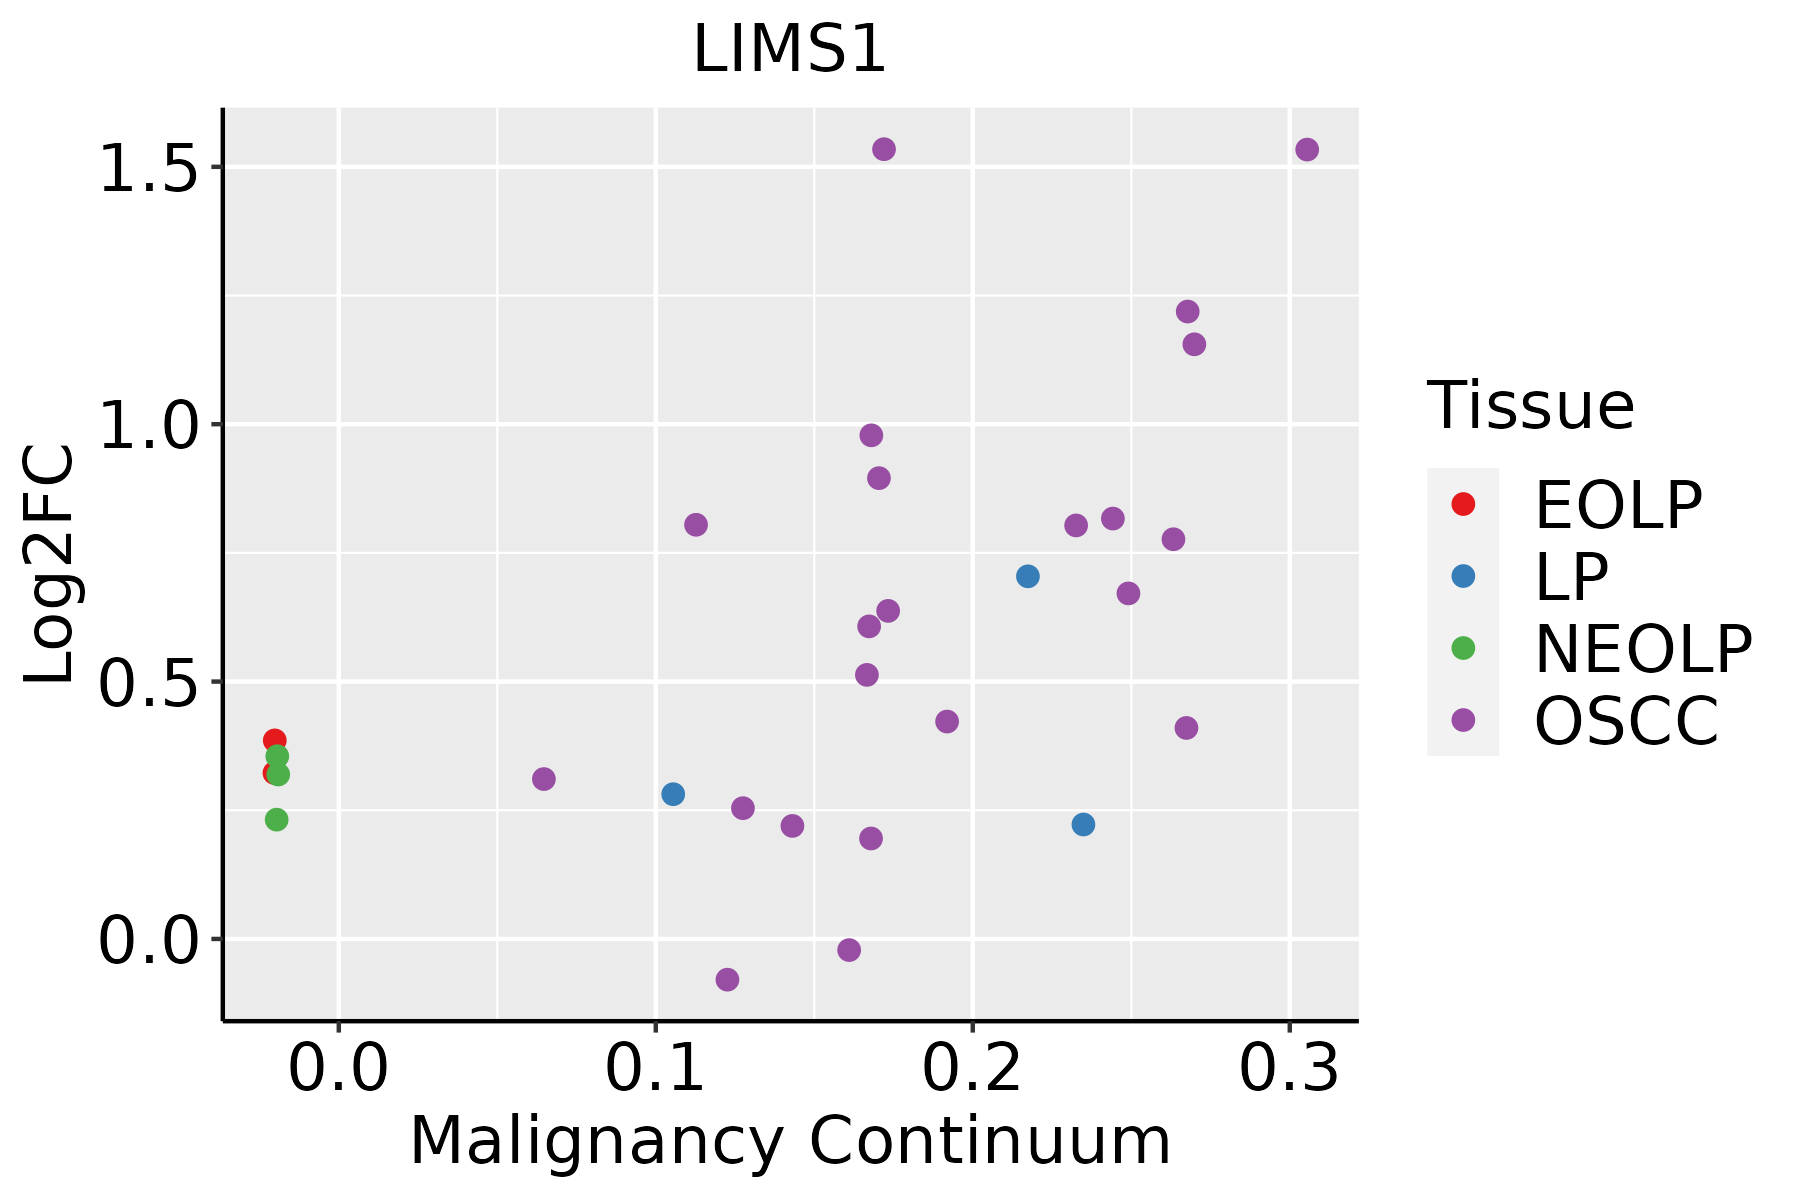
EOLP: Erosive Oral lichen planus
LP: leukoplakia
NEOLP: Non-erosive oral lichen planus
OSCC: Oral squamous cell carcinoma
ProstateThe image shows the transcriptomic changes along malignancy continuum.log2FC in expression of this searched gene in stem-like cells from each diseased tissue sample relative to stem-like cells in normal samples in each tissue plotted against the malignancy continuum. Samples are colored based on if they are from different disease stage.
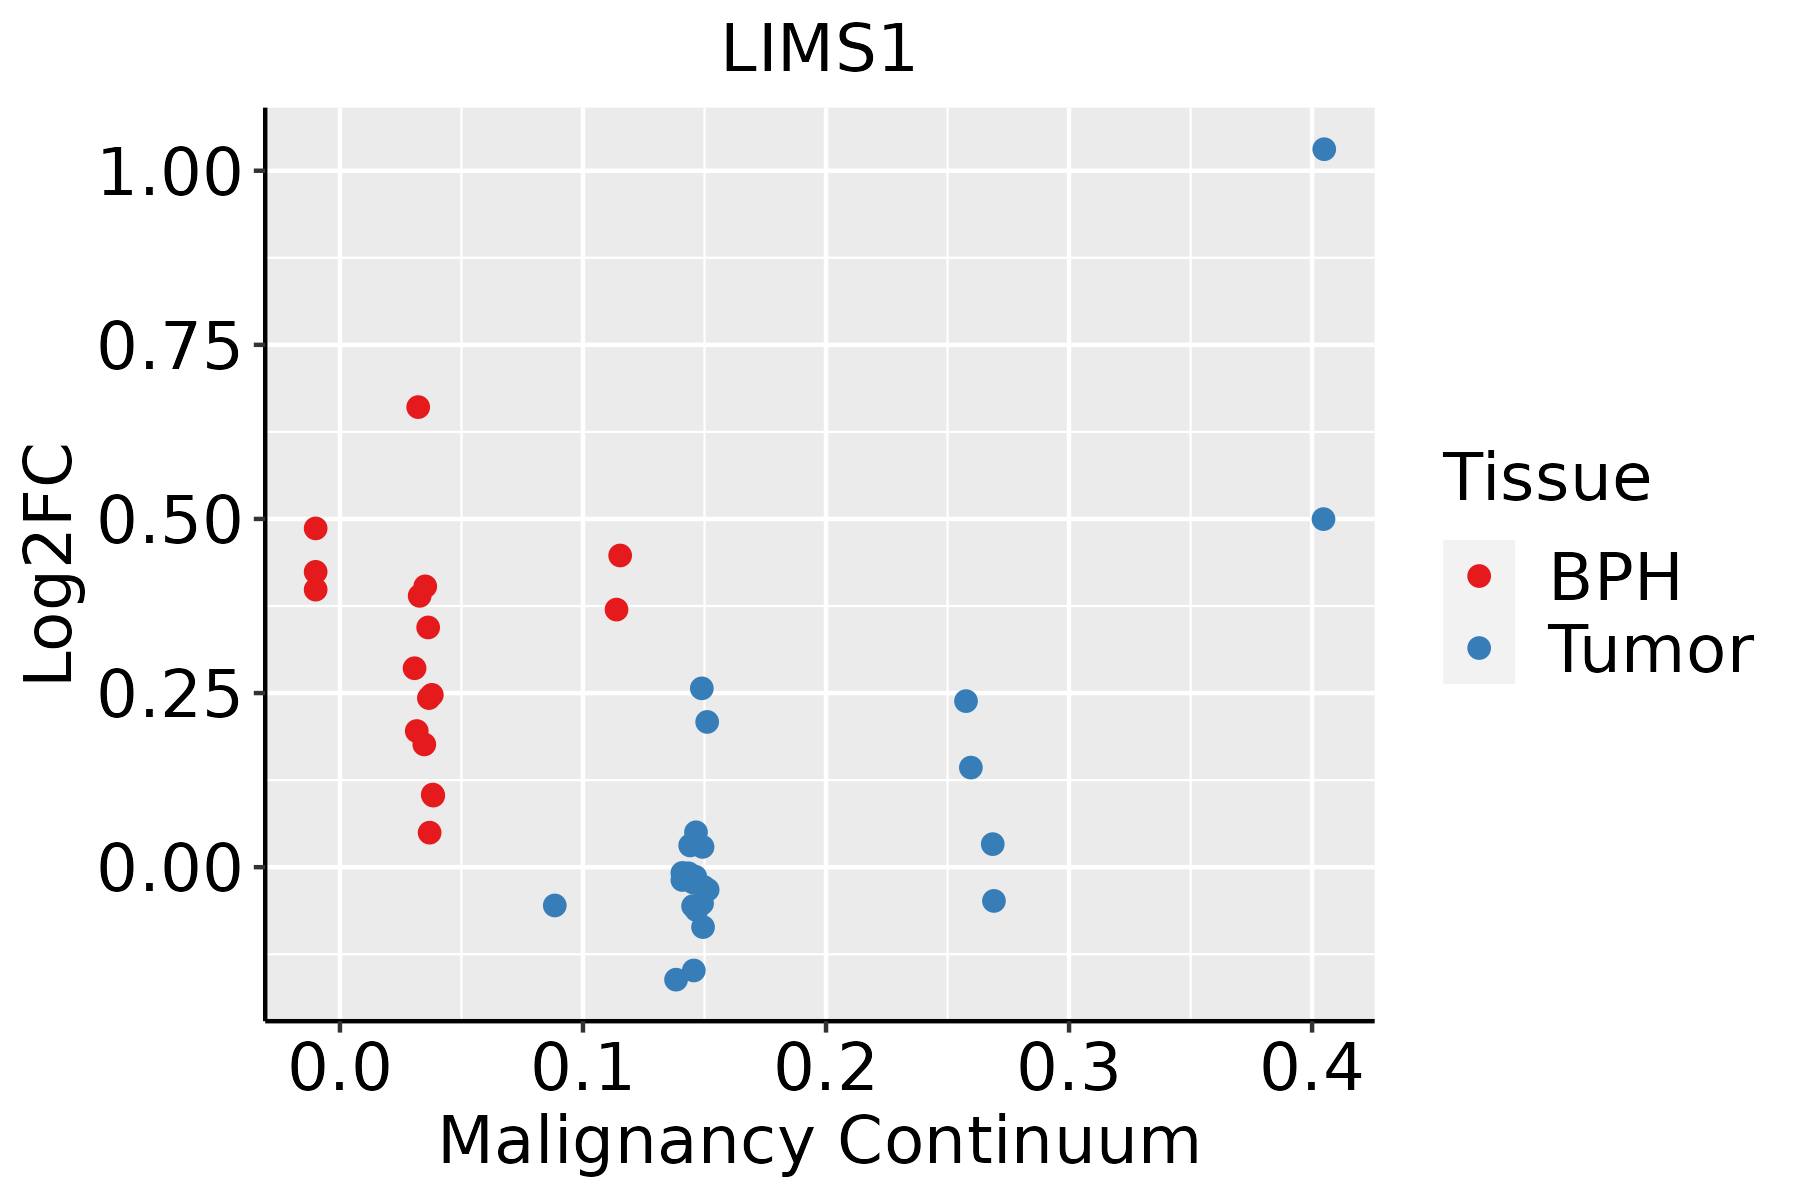
BPH: Benign Prostatic Hyperplasia
SkinThe image shows the transcriptomic changes along malignancy continuum.log2FC in expression of this searched gene in stem-like cells from each diseased tissue sample relative to stem-like cells in normal samples in each tissue plotted against the malignancy continuum. Samples are colored based on if they are from different disease stage.
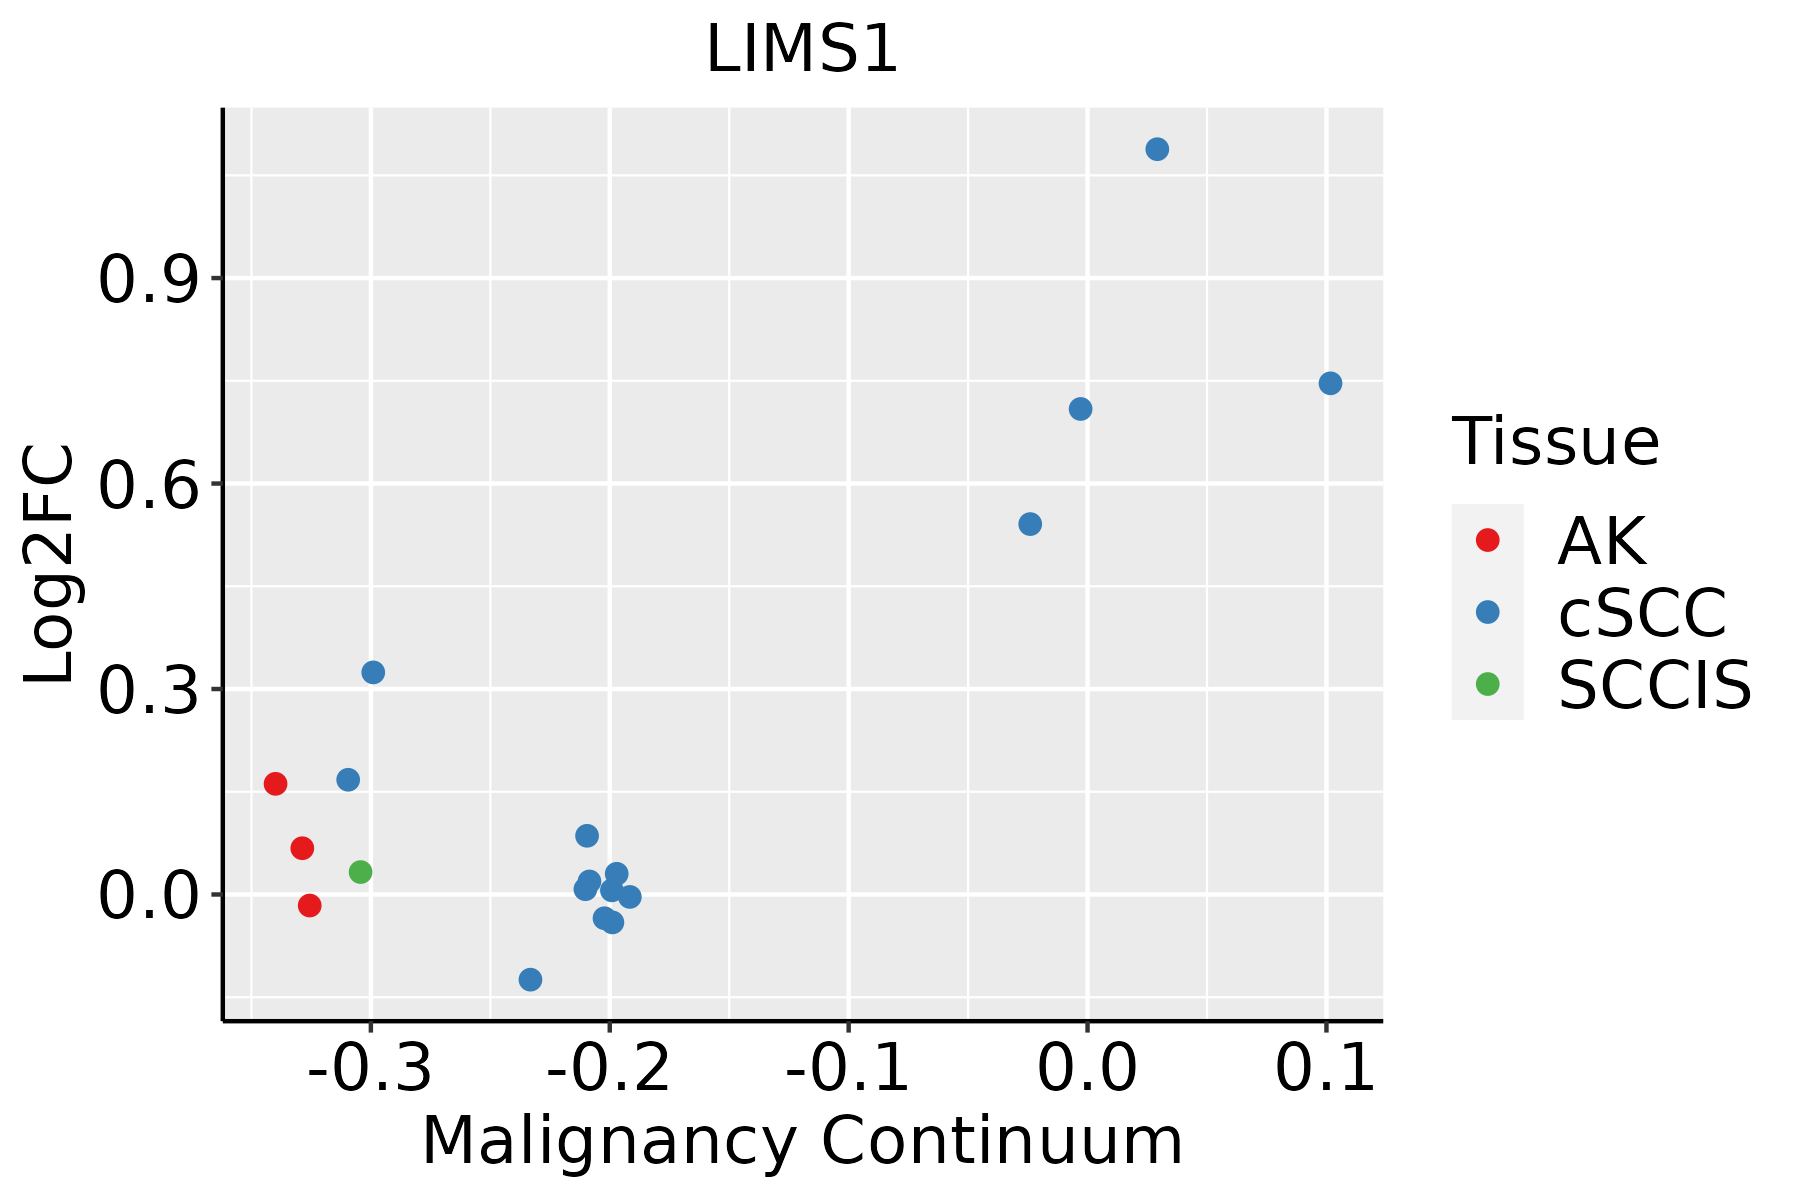
AK: Actinic keratosis
cSCC: Cutaneous squamous cell carcinoma
SCCIS:squamous cell carcinoma in situ
ThyroidThe image shows the transcriptomic changes along malignancy continuum.log2FC in expression of this searched gene in stem-like cells from each diseased tissue sample relative to stem-like cells in normal samples in each tissue plotted against the malignancy continuum. Samples are colored based on if they are from different disease stage.ATC: Anaplastic thyroid cancer
HT: Hashimoto's thyroiditis
PTC: Papillary thyroid cancer
∗log2FC in expression of this searched gene in stem-like cells from each diseased tissue sample relative to stem-like cells in normal samples in each tissue plotted against the malignancy continuum. Samples are colored based on if they are from different disease stage.

Top

Malignant transformation related pathway analysis

check buttonFind out the enriched GO biological processes and KEGG pathways involved in transition from healthy to precancer to cancer
check button Figure of enriched GO biological processes.
TissueDisease StageEnriched GO biological Processes
ColorectumADGO analysis - Figure of enriched GO biological processes: Top 15 enriched GO BP terms are showed in the bar plot of each disease state in each tissue. Each row represents a significant GO biological process which is colored according to the -log10(p.adjust).
ColorectumSERGO analysis - Figure of enriched GO biological processes: Top 15 enriched GO BP terms are showed in the bar plot of each disease state in each tissue. Each row represents a significant GO biological process which is colored according to the -log10(p.adjust).
ColorectumMSSGO analysis - Figure of enriched GO biological processes: Top 15 enriched GO BP terms are showed in the bar plot of each disease state in each tissue. Each row represents a significant GO biological process which is colored according to the -log10(p.adjust).
ColorectumMSI-HGO analysis - Figure of enriched GO biological processes: Top 15 enriched GO BP terms are showed in the bar plot of each disease state in each tissue. Each row represents a significant GO biological process which is colored according to the -log10(p.adjust).
ColorectumFAPGO analysis - Figure of enriched GO biological processes: Top 15 enriched GO BP terms are showed in the bar plot of each disease state in each tissue. Each row represents a significant GO biological process which is colored according to the -log10(p.adjust).
∗Top 15 enriched GO BP terms are showed in the bar plot of each disease state in each tissue. Each row represents a significant GO biological process which is colored according to the -log10(p.adjust).
Page: 1 2 3 4 5 6 7 8 9 

check button Enriched GO biological processes.
GO IDTissueDisease StageDescriptionGene RatioBg Ratiopvaluep.adjustCount
GO:00315897LungIACcell-substrate adhesion85/2061363/187238.57e-124.27e-0985
GO:00480416LungIACfocal adhesion assembly34/206187/187239.46e-124.27e-0934
GO:00518937LungIACregulation of focal adhesion assembly29/206166/187231.01e-114.27e-0929
GO:00901097LungIACregulation of cell-substrate junction assembly29/206166/187231.01e-114.27e-0929
GO:01501157LungIACcell-substrate junction organization36/2061101/187235.37e-111.52e-0836
GO:00226048LungIACregulation of cell morphogenesis74/2061309/187236.31e-111.70e-0874
GO:01501167LungIACregulation of cell-substrate junction organization29/206171/187238.86e-112.29e-0829
GO:00019527LungIACregulation of cell-matrix adhesion40/2061128/187234.69e-109.93e-0840
GO:00108108LungIACregulation of cell-substrate adhesion57/2061221/187235.09e-101.04e-0757
GO:00343297LungIACcell junction assembly86/2061420/187237.98e-091.10e-0686
GO:00715594LungIACresponse to transforming growth factor beta60/2061256/187239.50e-091.25e-0660
GO:00457858LungIACpositive regulation of cell adhesion87/2061437/187232.59e-083.13e-0687
GO:00715604LungIACcellular response to transforming growth factor beta stimulus57/2061250/187236.17e-086.54e-0657
GO:19018885LungIACregulation of cell junction assembly46/2061204/187231.56e-067.76e-0546
GO:00430876LungIACregulation of GTPase activity67/2061348/187233.43e-061.44e-0467
GO:00072294LungIACintegrin-mediated signaling pathway28/2061107/187239.18e-063.06e-0428
GO:00452168LungIACcell-cell junction organization43/2061200/187231.21e-053.64e-0443
GO:00108118LungIACpositive regulation of cell-substrate adhesion29/2061123/187235.35e-051.21e-0329
GO:00435475LungIACpositive regulation of GTPase activity48/2061255/187231.40e-042.60e-0348
GO:00019546LungIACpositive regulation of cell-matrix adhesion16/206158/187233.85e-045.87e-0316
Page: 1 2 3 4 5 6 7 8 9 10 11 12 13 14 15 16 17 18 19 20 21 22 23 24 25 26 27 28 29 30 

check button Enriched KEGG pathways.
Pathway IDTissueDisease StageDescriptionGene RatioBg Ratiopvaluep.adjustqvalueCount
Page: 1 

Top

Cell-cell communication analysis

check buttonIdentification of potential cell-cell interactions between two cell types and their ligand-receptor pairs for different disease states
LigandReceptorLRpairPathwayTissueDisease Stage
Page: 1 

Top

Single-cell gene regulatory network inference analysis

check buttonFind out the significant the regulons (TFs) and the target genes of each regulon across cell types for different disease states
TFCell TypeTissueDisease StageTarget GeneRSSRegulon Activity
∗The dot plots of a searched regulon are shown for all cell subpopulations in each disease state of each tissue based on the regulon specific score inferred using pySCENIC and by calculating the average expression.
Page: 1 

Top

Somatic mutation of malignant transformation related genes

check buttonAnnotation of somatic variants for genes involved in malignant transformation
Hugo SymbolVariant ClassVariant ClassificationdbSNP RSHGVScHGVSpHGVSp ShortSWISSPROTBIOTYPESIFTPolyPhenTumor Sample BarcodeTissueHistologySexAgeStageTherapy TypesDrugsOutcome
LIMS1SNVMissense_Mutationnovelc.61N>Tp.Arg21Cysp.R21CP48059protein_codingdeleterious_low_confidence(0.01)benign(0.348)TCGA-AC-A2FE-01Breastbreast invasive carcinomaFemale<65III/IVChemotherapyadriamycinPD
LIMS1SNVMissense_Mutationnovelc.473N>Tp.Arg158Leup.R158LP48059protein_codingtolerated(0.39)benign(0.015)TCGA-BH-A1FC-01Breastbreast invasive carcinomaFemale>=65I/IIUnknownUnknownSD
LIMS1SNVMissense_Mutationc.1127G>Tp.Arg376Ilep.R376IP48059protein_codingtolerated(0.06)probably_damaging(0.991)TCGA-D8-A1X6-01Breastbreast invasive carcinomaFemale>=65III/IVHormone TherapytamoxiphenSD
LIMS1SNVMissense_Mutationrs149119038c.67N>Ap.Asp23Asnp.D23NP48059protein_codingtolerated_low_confidence(0.48)benign(0)TCGA-EA-A3QE-01Cervixcervical & endocervical cancerFemale<65I/IIUnknownUnknownSD
LIMS1SNVMissense_Mutationc.247N>Ap.Glu83Lysp.E83KP48059protein_codingdeleterious(0)probably_damaging(0.973)TCGA-Q1-A73O-01Cervixcervical & endocervical cancerFemale<65I/IIChemotherapycisplatinCR
LIMS1SNVMissense_Mutationc.874C>Tp.Arg292Cysp.R292CP48059protein_codingdeleterious(0)probably_damaging(0.982)TCGA-AA-A00N-01Colorectumcolon adenocarcinomaMale>=65I/IIUnknownUnknownPD
LIMS1SNVMissense_Mutationrs200004487c.220N>Tp.Arg74Cysp.R74CP48059protein_codingdeleterious(0.02)probably_damaging(0.953)TCGA-D5-6930-01Colorectumcolon adenocarcinomaMale>=65I/IIUnknownUnknownSD
LIMS1insertionNonsense_Mutationnovelc.892_893insTTTGAGACAp.Gly298delinsValTerAspSerp.G298delinsV*DSP48059protein_codingTCGA-AM-5820-01Colorectumcolon adenocarcinomaFemale<65I/IIUnknownUnknownSD
LIMS1SNVMissense_Mutationnovelc.556N>Tp.Arg186Cysp.R186CP48059protein_codingdeleterious(0.01)possibly_damaging(0.901)TCGA-AJ-A3EL-01Endometriumuterine corpus endometrioid carcinomaFemale<65I/IIUnknownUnknownSD
LIMS1SNVMissense_Mutationrs377342624c.794N>Ap.Arg265Hisp.R265HP48059protein_codingdeleterious(0.04)probably_damaging(0.918)TCGA-AJ-A3OK-01Endometriumuterine corpus endometrioid carcinomaFemale>=65I/IIChemotherapycarboplatinCR
Page: 1 2 3 

Top

Related drugs of malignant transformation related genes

check buttonIdentification of chemicals and drugs interact with genes involved in malignant transfromation
(DGIdb 4.0)
Entrez IDSymbolCategoryInteraction TypesDrug Claim NameDrug NamePMIDs
Page: 1