
|
|||||
|
 | |
| |
| |
| |
| |
| |
|
Gene: HSD17B10 |
Gene summary for HSD17B10 |
| Gene information | Species | Human | Gene symbol | HSD17B10 | Gene ID | 3028 |
| Gene name | hydroxysteroid 17-beta dehydrogenase 10 | |
| Gene Alias | 17b-HSD10 | |
| Cytomap | Xp11.22 | |
| Gene Type | protein-coding | GO ID | GO:0000959 | UniProtAcc | Q99714 |
Top |
Malignant transformation analysis |
| Identification of the aberrant gene expression in precancerous and cancerous lesions by comparing the gene expression of stem-like cells in diseased tissues with normal stem cells |
| Entrez ID | Symbol | Replicates | Species | Organ | Tissue | Adj P-value | Log2FC | Malignancy |
| 3028 | HSD17B10 | GSM4909281 | Human | Breast | IDC | 2.85e-05 | 3.74e-01 | 0.21 |
| 3028 | HSD17B10 | GSM4909282 | Human | Breast | IDC | 5.05e-08 | 4.44e-01 | -0.0288 |
| 3028 | HSD17B10 | GSM4909290 | Human | Breast | IDC | 1.29e-02 | 3.31e-01 | 0.2096 |
| 3028 | HSD17B10 | GSM4909291 | Human | Breast | IDC | 1.72e-03 | 3.70e-01 | 0.1753 |
| 3028 | HSD17B10 | GSM4909294 | Human | Breast | IDC | 2.23e-02 | 2.16e-01 | 0.2022 |
| 3028 | HSD17B10 | GSM4909296 | Human | Breast | IDC | 2.31e-14 | 3.42e-01 | 0.1524 |
| 3028 | HSD17B10 | GSM4909297 | Human | Breast | IDC | 3.30e-08 | 4.56e-02 | 0.1517 |
| 3028 | HSD17B10 | GSM4909301 | Human | Breast | IDC | 1.20e-03 | 2.53e-01 | 0.1577 |
| 3028 | HSD17B10 | GSM4909306 | Human | Breast | IDC | 4.49e-08 | 4.14e-01 | 0.1564 |
| 3028 | HSD17B10 | GSM4909307 | Human | Breast | IDC | 8.26e-09 | 4.24e-01 | 0.1569 |
| 3028 | HSD17B10 | GSM4909308 | Human | Breast | IDC | 4.64e-22 | 5.79e-01 | 0.158 |
| 3028 | HSD17B10 | GSM4909311 | Human | Breast | IDC | 4.25e-30 | -4.33e-02 | 0.1534 |
| 3028 | HSD17B10 | GSM4909312 | Human | Breast | IDC | 1.36e-11 | 5.78e-02 | 0.1552 |
| 3028 | HSD17B10 | GSM4909316 | Human | Breast | IDC | 1.30e-02 | 3.07e-01 | 0.21 |
| 3028 | HSD17B10 | GSM4909319 | Human | Breast | IDC | 5.95e-31 | -6.37e-02 | 0.1563 |
| 3028 | HSD17B10 | GSM4909320 | Human | Breast | IDC | 2.93e-05 | 2.51e-01 | 0.1575 |
| 3028 | HSD17B10 | GSM4909321 | Human | Breast | IDC | 3.58e-16 | 2.75e-01 | 0.1559 |
| 3028 | HSD17B10 | brca1 | Human | Breast | Precancer | 1.05e-12 | 4.99e-01 | -0.0338 |
| 3028 | HSD17B10 | brca2 | Human | Breast | Precancer | 1.33e-08 | 3.66e-01 | -0.024 |
| 3028 | HSD17B10 | NCCBC14 | Human | Breast | DCIS | 3.85e-02 | -7.12e-02 | 0.2021 |
| Page: 1 2 3 4 5 6 7 8 9 10 11 |
| Tissue | Expression Dynamics | Abbreviation |
| Breast | 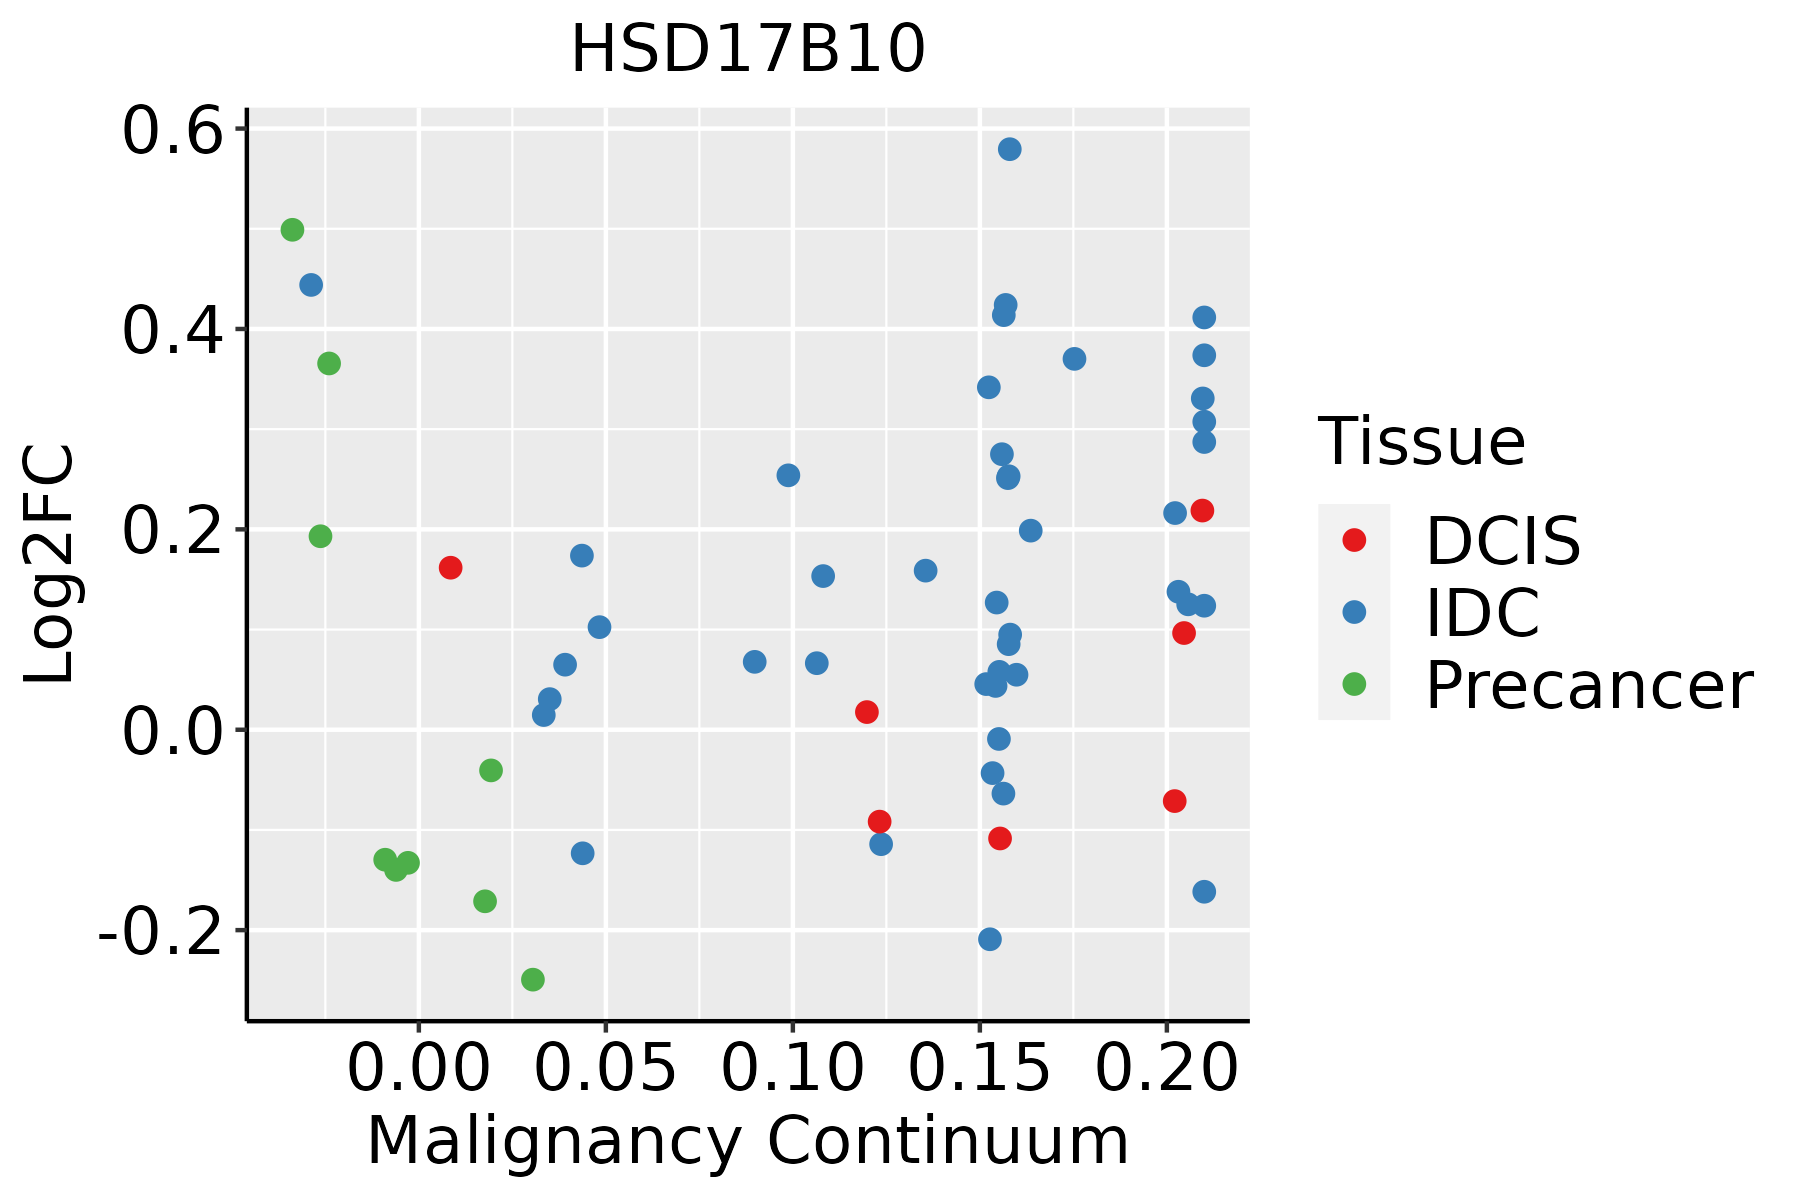 | IDC: Invasive ductal carcinoma |
| DCIS: Ductal carcinoma in situ | ||
| Precancer(BRCA1-mut): Precancerous lesion from BRCA1 mutation carriers | ||
| Colorectum (GSE201348) |  | FAP: Familial adenomatous polyposis |
| CRC: Colorectal cancer | ||
| Colorectum (HTA11) |  | AD: Adenomas |
| SER: Sessile serrated lesions | ||
| MSI-H: Microsatellite-high colorectal cancer | ||
| MSS: Microsatellite stable colorectal cancer | ||
| Endometrium | 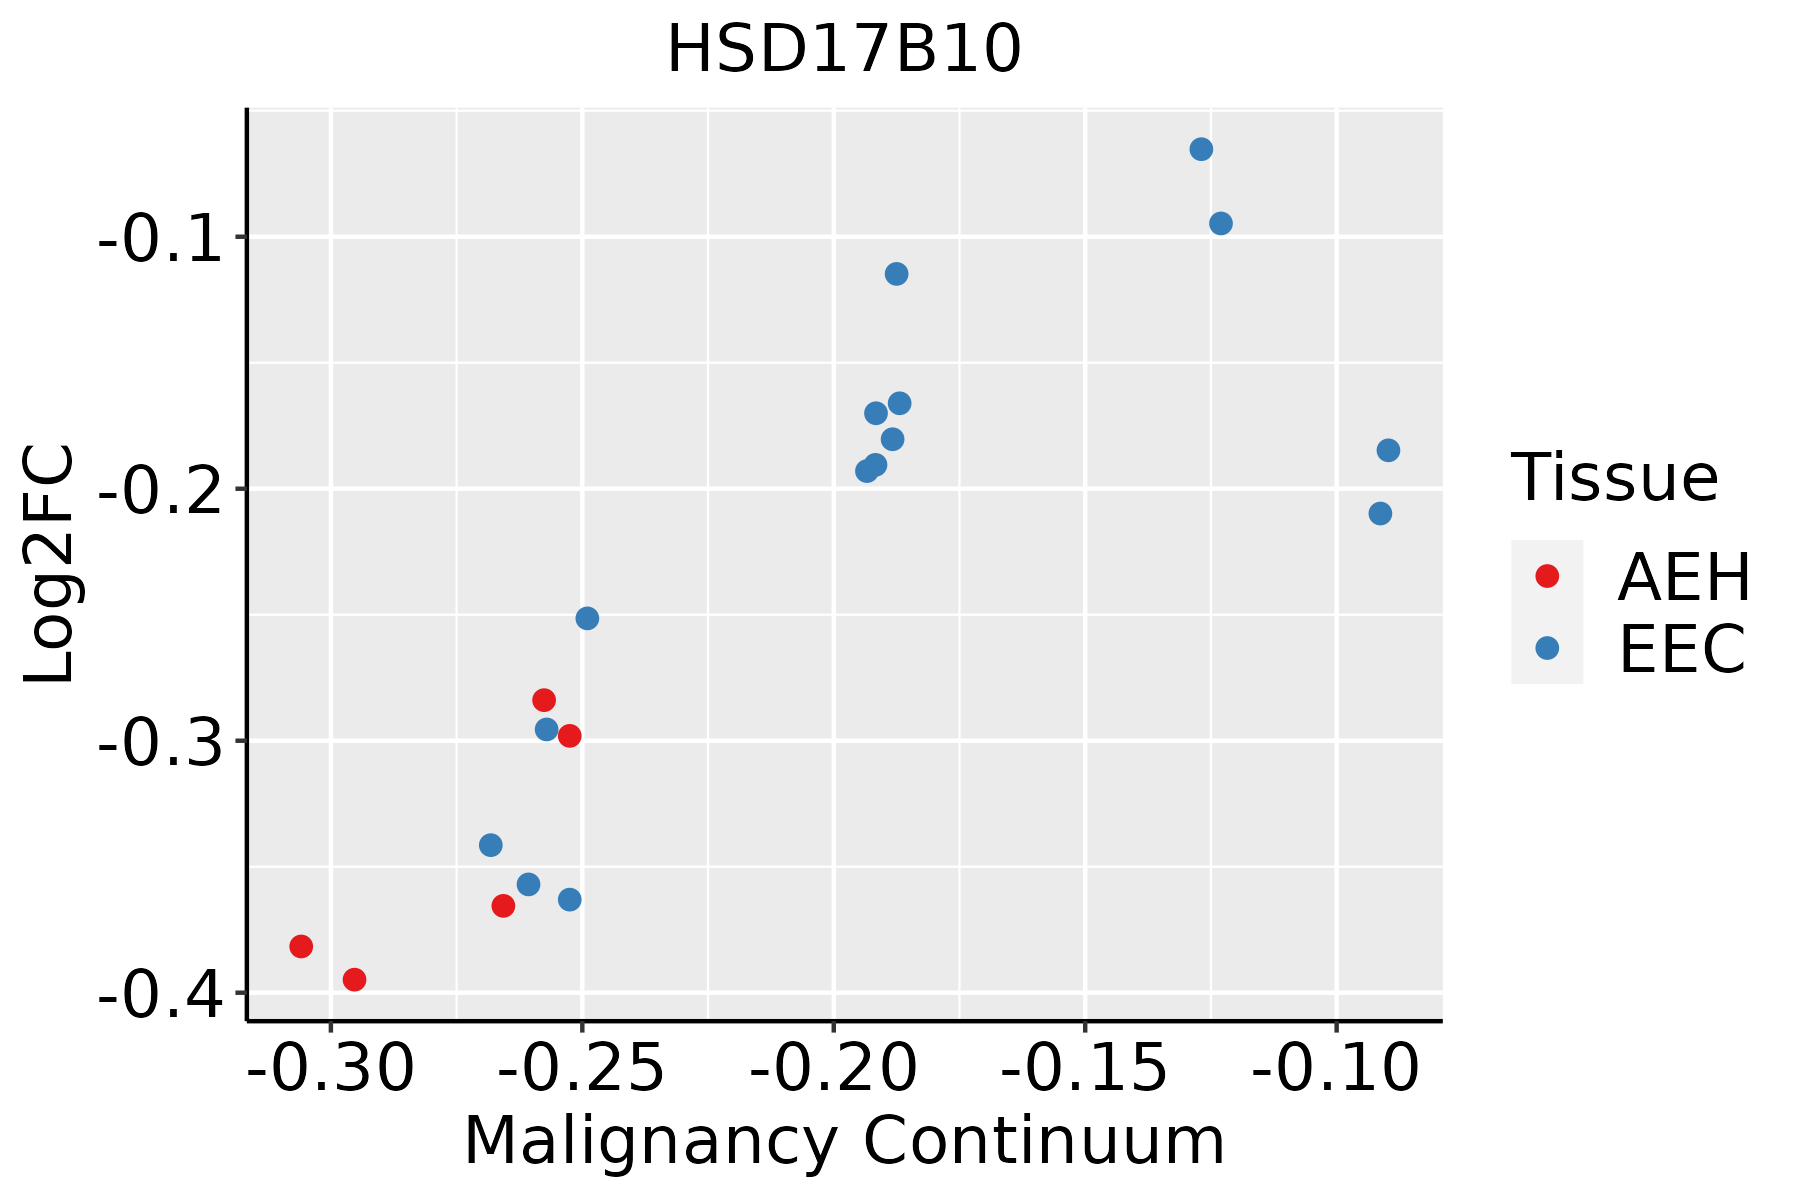 | AEH: Atypical endometrial hyperplasia |
| EEC: Endometrioid Cancer | ||
| Esophagus | 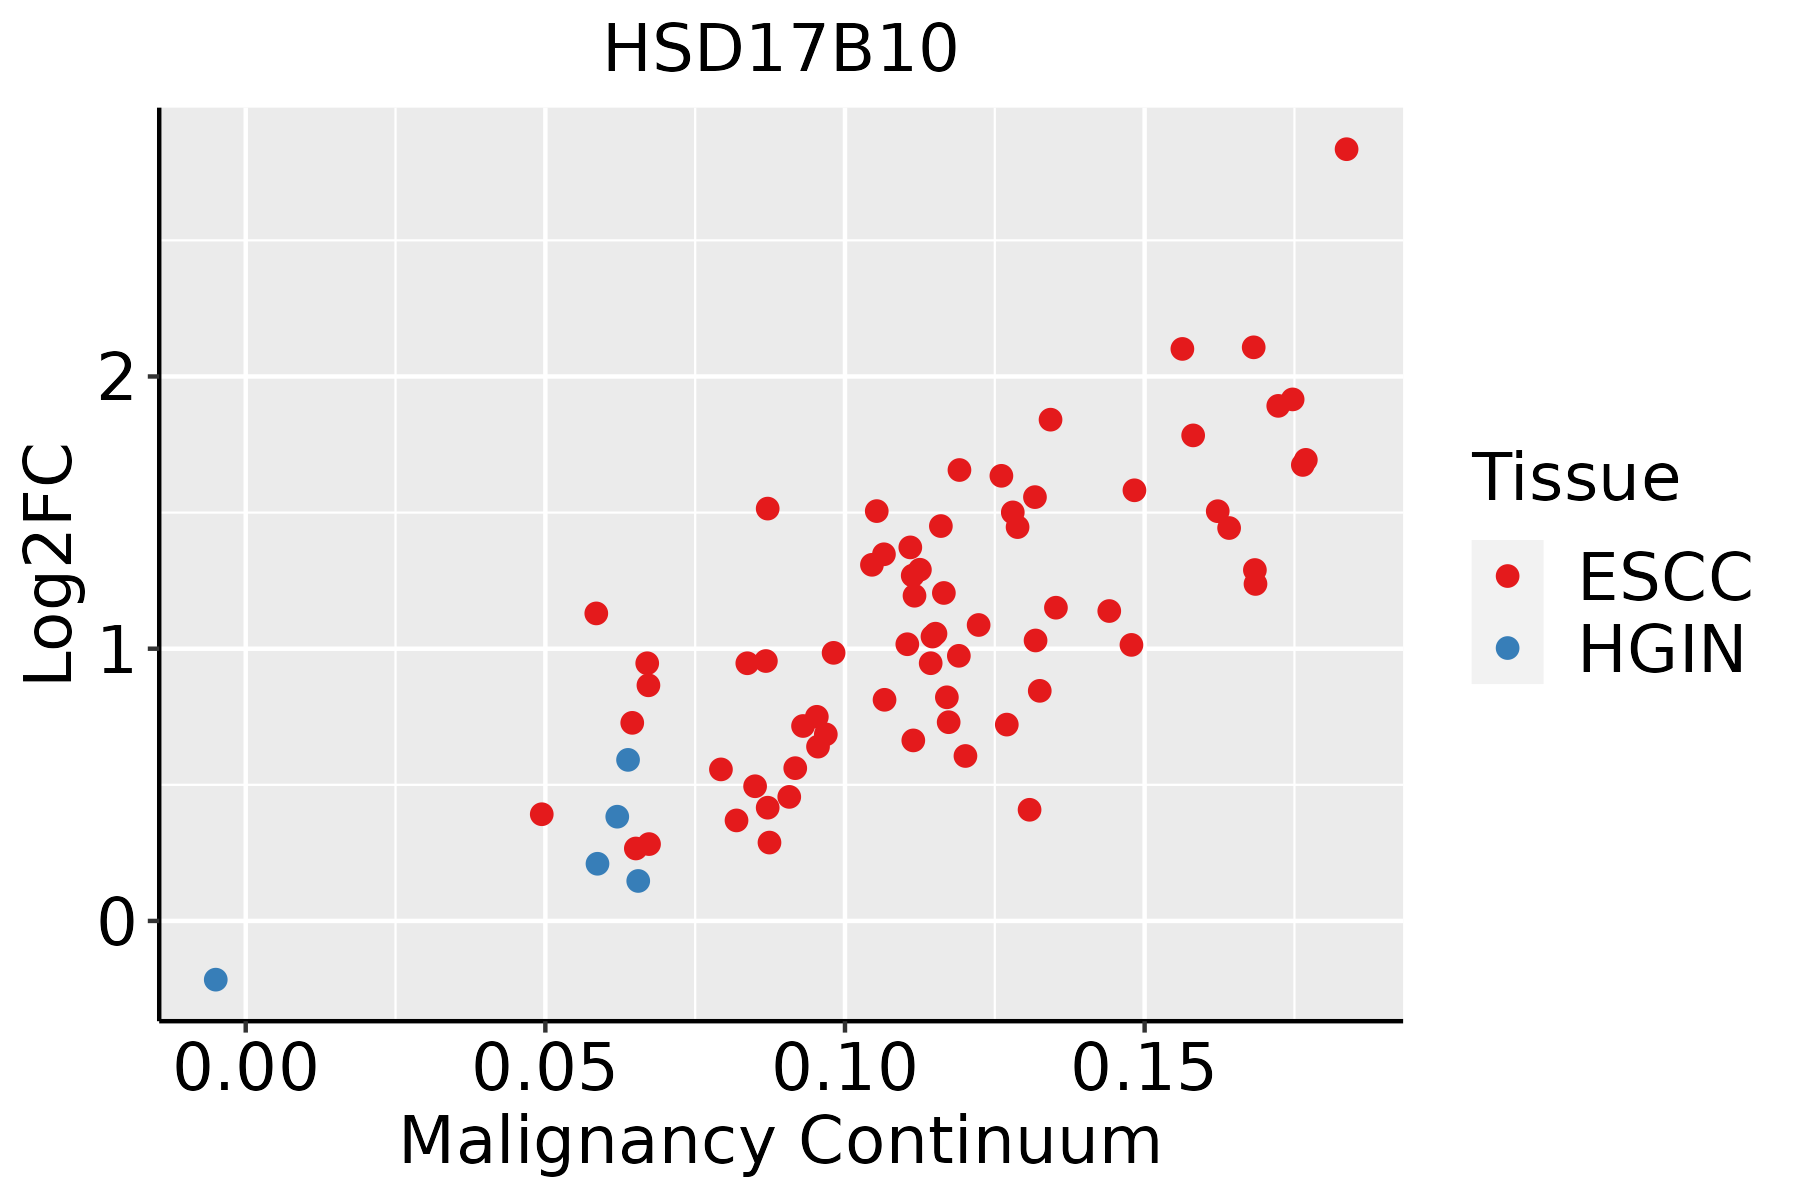 | ESCC: Esophageal squamous cell carcinoma |
| HGIN: High-grade intraepithelial neoplasias | ||
| LGIN: Low-grade intraepithelial neoplasias | ||
| Liver | 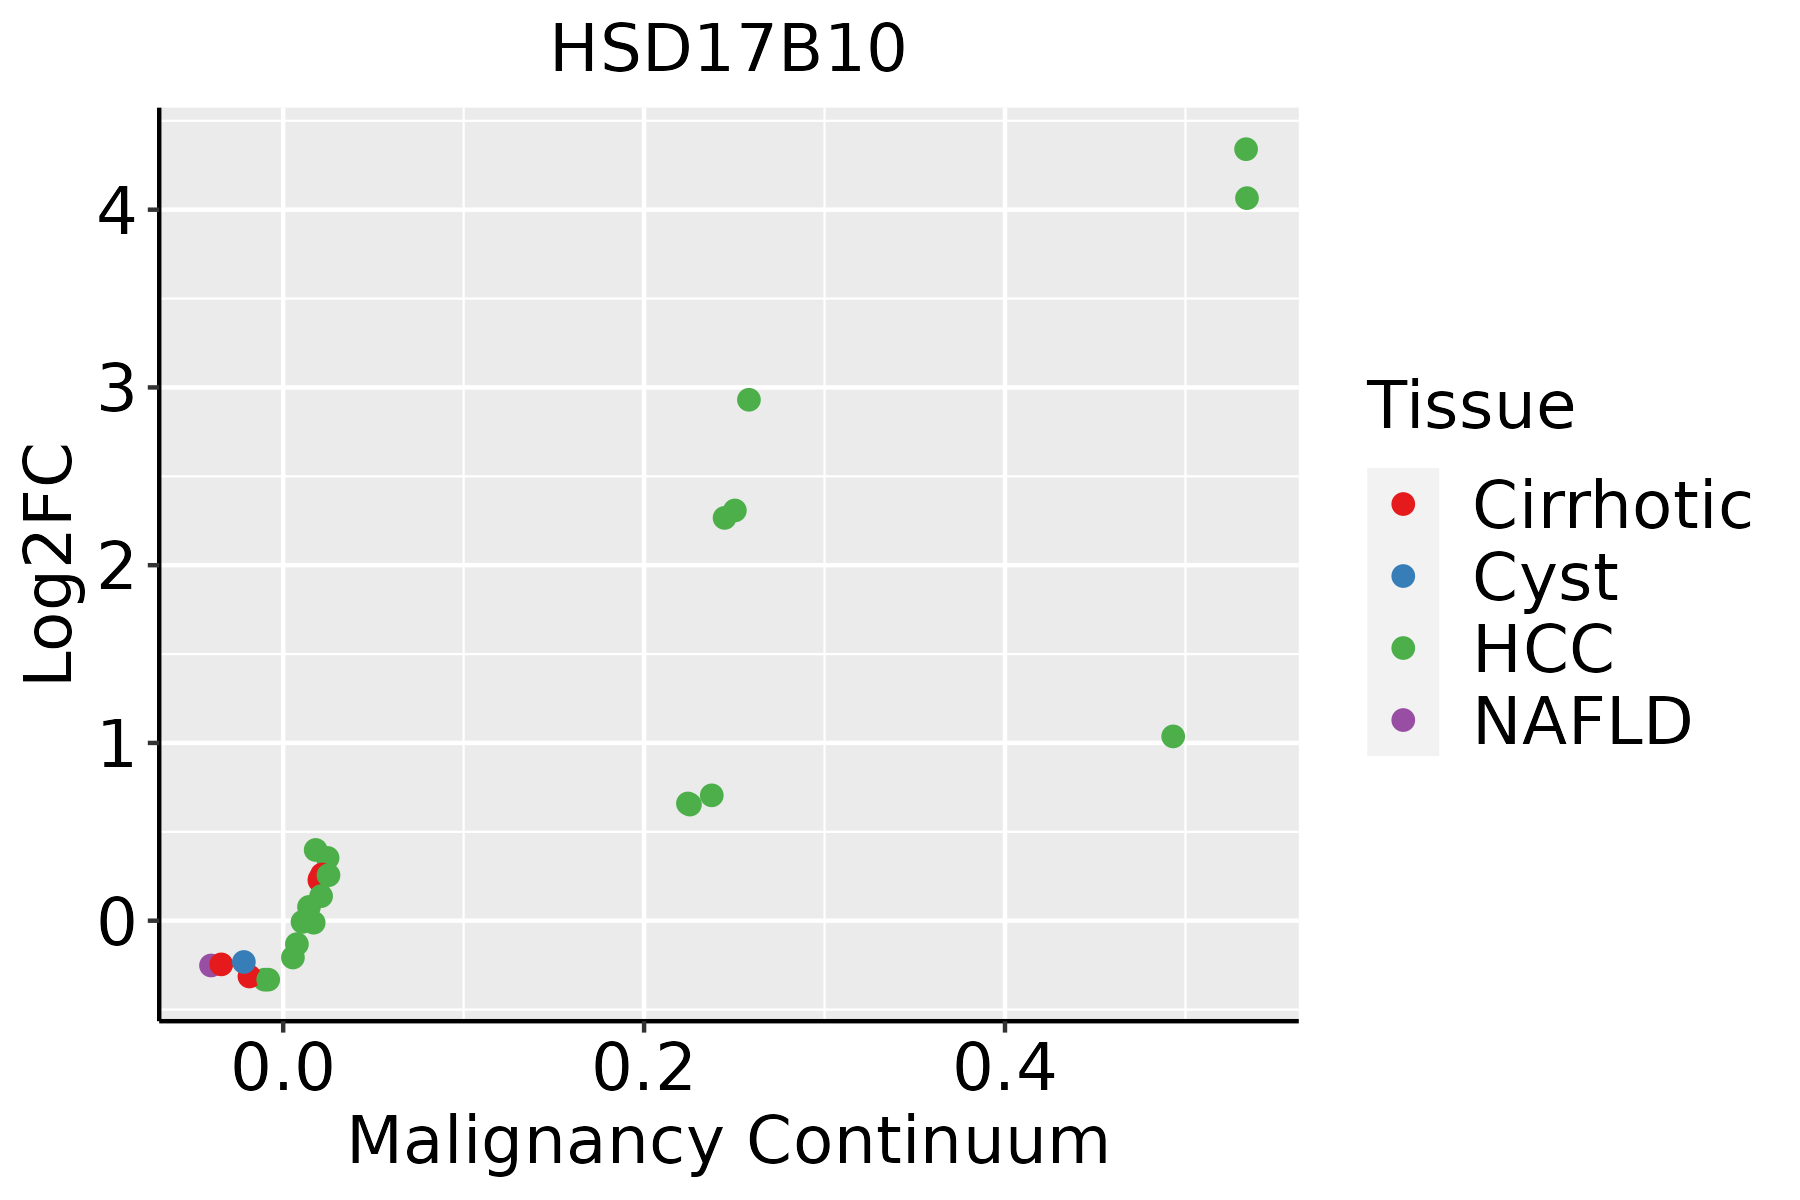 | HCC: Hepatocellular carcinoma |
| NAFLD: Non-alcoholic fatty liver disease | ||
| Oral Cavity | 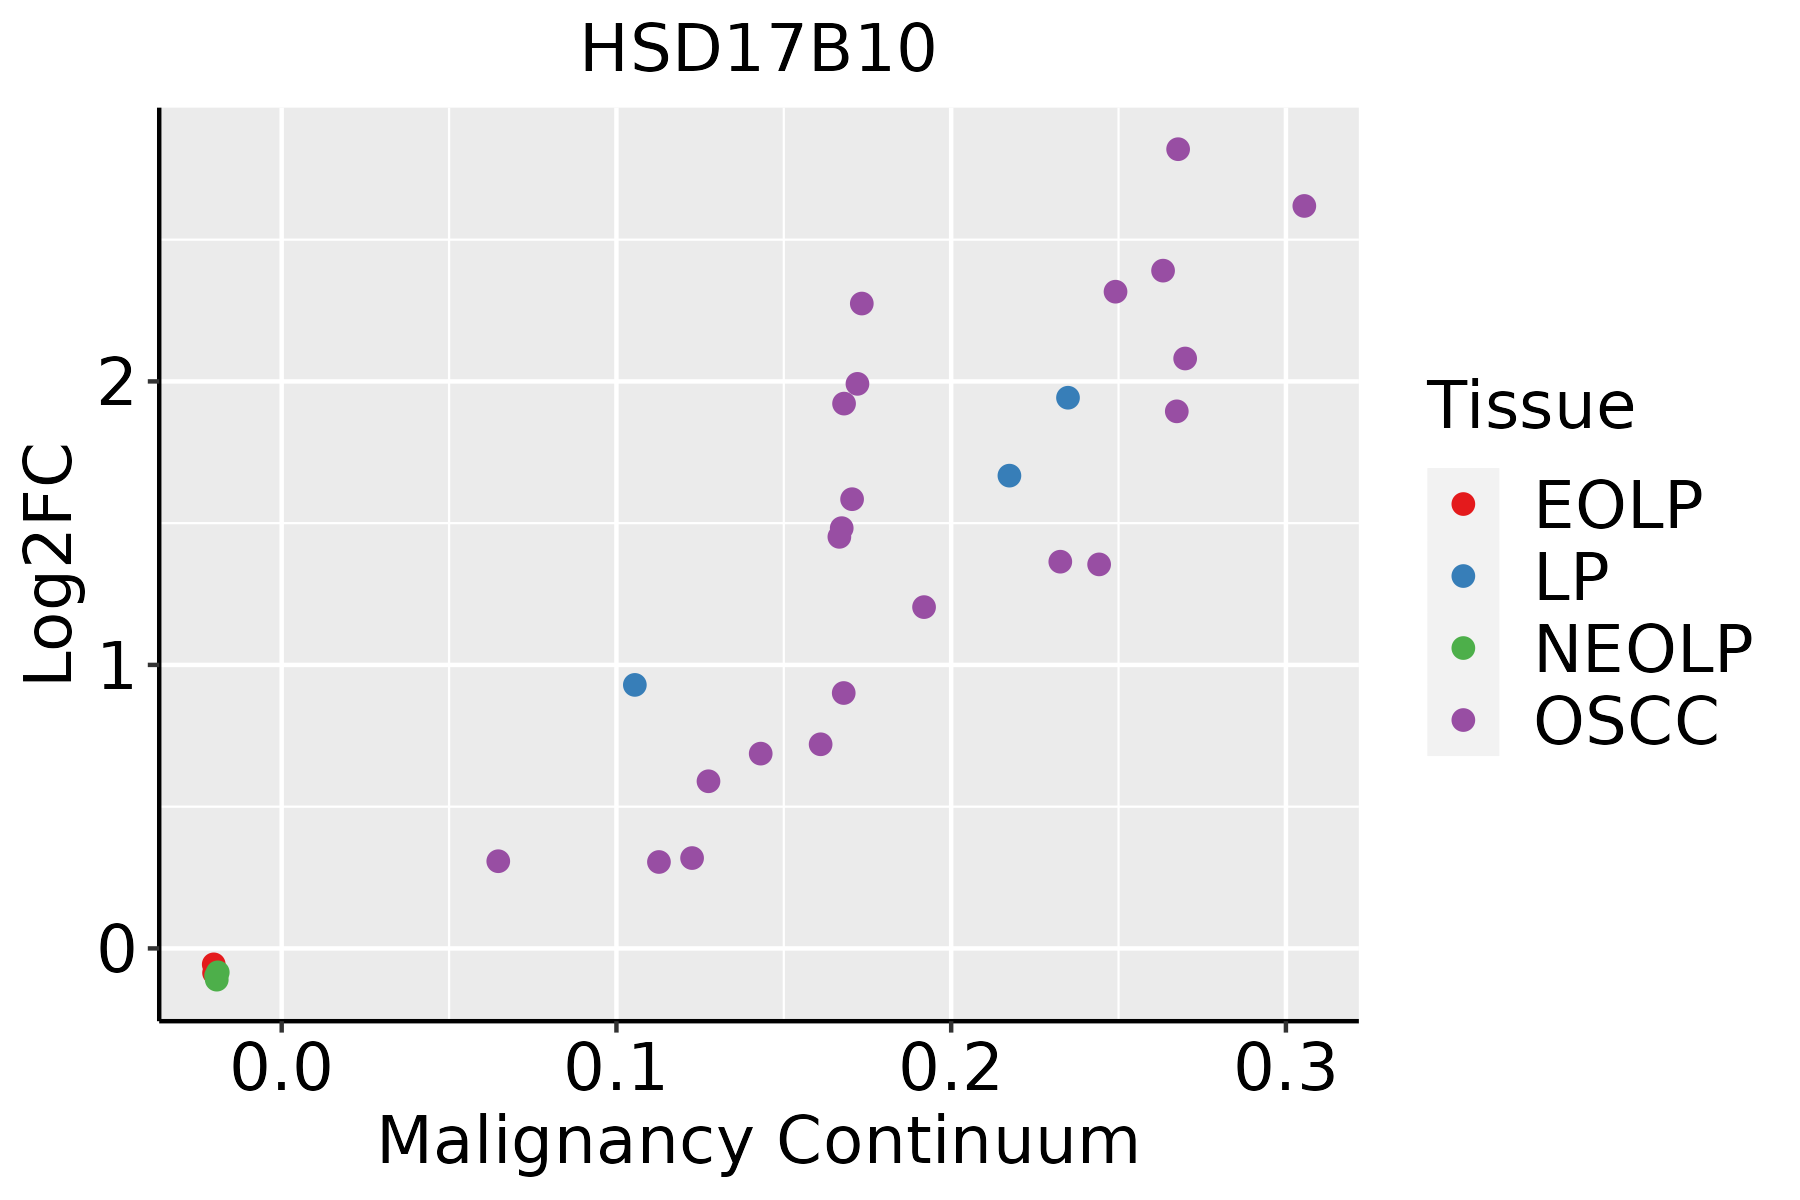 | EOLP: Erosive Oral lichen planus |
| LP: leukoplakia | ||
| NEOLP: Non-erosive oral lichen planus | ||
| OSCC: Oral squamous cell carcinoma | ||
| Prostate |  | BPH: Benign Prostatic Hyperplasia |
| Skin |  | AK: Actinic keratosis |
| cSCC: Cutaneous squamous cell carcinoma | ||
| SCCIS:squamous cell carcinoma in situ | ||
| Thyroid |  | ATC: Anaplastic thyroid cancer |
| HT: Hashimoto's thyroiditis | ||
| PTC: Papillary thyroid cancer |
| ∗log2FC in expression of this searched gene in stem-like cells from each diseased tissue sample relative to stem-like cells in normal samples in each tissue plotted against the malignancy continuum. Samples are colored based on if they are from different disease stage. |
Top |
Malignant transformation related pathway analysis |
| Find out the enriched GO biological processes and KEGG pathways involved in transition from healthy to precancer to cancer |
| Tissue | Disease Stage | Enriched GO biological Processes |
| Colorectum | AD |  |
| Colorectum | SER |  |
| Colorectum | MSS |  |
| Colorectum | MSI-H |  |
| Colorectum | FAP |  |
| ∗Top 15 enriched GO BP terms are showed in the bar plot of each disease state in each tissue. Each row represents a significant GO biological process which is colored according to the -log10(p.adjust). |
| Page: 1 2 3 4 5 6 7 8 9 |
| GO ID | Tissue | Disease Stage | Description | Gene Ratio | Bg Ratio | pvalue | p.adjust | Count |
| GO:00346605 | Oral cavity | OSCC | ncRNA metabolic process | 296/7305 | 485/18723 | 2.94e-23 | 6.65e-21 | 296 |
| GO:01400533 | Oral cavity | OSCC | mitochondrial gene expression | 78/7305 | 108/18723 | 2.37e-12 | 9.86e-11 | 78 |
| GO:00311232 | Oral cavity | OSCC | RNA 3'-end processing | 75/7305 | 116/18723 | 1.93e-08 | 3.79e-07 | 75 |
| GO:00080332 | Oral cavity | OSCC | tRNA processing | 78/7305 | 127/18723 | 2.56e-07 | 4.00e-06 | 78 |
| GO:00063991 | Oral cavity | OSCC | tRNA metabolic process | 101/7305 | 179/18723 | 1.65e-06 | 2.15e-05 | 101 |
| GO:00094511 | Oral cavity | OSCC | RNA modification | 95/7305 | 167/18723 | 2.05e-06 | 2.62e-05 | 95 |
| GO:00421804 | Oral cavity | OSCC | cellular ketone metabolic process | 111/7305 | 211/18723 | 3.94e-05 | 3.45e-04 | 111 |
| GO:00090627 | Oral cavity | OSCC | fatty acid catabolic process | 59/7305 | 100/18723 | 3.99e-05 | 3.48e-04 | 59 |
| GO:00991162 | Oral cavity | OSCC | tRNA 5'-end processing | 14/7305 | 16/18723 | 9.15e-05 | 6.93e-04 | 14 |
| GO:00064001 | Oral cavity | OSCC | tRNA modification | 53/7305 | 90/18723 | 1.04e-04 | 7.70e-04 | 53 |
| GO:00344712 | Oral cavity | OSCC | ncRNA 5'-end processing | 17/7305 | 21/18723 | 1.07e-04 | 7.89e-04 | 17 |
| GO:0051259 | Oral cavity | OSCC | protein complex oligomerization | 121/7305 | 238/18723 | 1.29e-04 | 9.21e-04 | 121 |
| GO:00009662 | Oral cavity | OSCC | RNA 5'-end processing | 18/7305 | 23/18723 | 1.47e-04 | 1.04e-03 | 18 |
| GO:00160537 | Oral cavity | OSCC | organic acid biosynthetic process | 155/7305 | 316/18723 | 1.64e-04 | 1.13e-03 | 155 |
| GO:00463947 | Oral cavity | OSCC | carboxylic acid biosynthetic process | 154/7305 | 314/18723 | 1.73e-04 | 1.19e-03 | 154 |
| GO:00066317 | Oral cavity | OSCC | fatty acid metabolic process | 186/7305 | 390/18723 | 2.65e-04 | 1.69e-03 | 186 |
| GO:00723296 | Oral cavity | OSCC | monocarboxylic acid catabolic process | 66/7305 | 122/18723 | 5.02e-04 | 2.95e-03 | 66 |
| GO:00193957 | Oral cavity | OSCC | fatty acid oxidation | 57/7305 | 103/18723 | 5.58e-04 | 3.23e-03 | 57 |
| GO:00066945 | Oral cavity | OSCC | steroid biosynthetic process | 89/7305 | 173/18723 | 5.77e-04 | 3.30e-03 | 89 |
| GO:00344406 | Oral cavity | OSCC | lipid oxidation | 59/7305 | 108/18723 | 7.01e-04 | 3.89e-03 | 59 |
| Page: 1 2 3 4 5 6 7 8 9 10 11 12 13 |
| Pathway ID | Tissue | Disease Stage | Description | Gene Ratio | Bg Ratio | pvalue | p.adjust | qvalue | Count |
| hsa0501016 | Breast | Precancer | Alzheimer disease | 103/684 | 384/8465 | 1.03e-29 | 4.66e-28 | 3.57e-28 | 103 |
| hsa0502216 | Breast | Precancer | Pathways of neurodegeneration - multiple diseases | 112/684 | 476/8465 | 6.96e-27 | 2.44e-25 | 1.87e-25 | 112 |
| hsa0501017 | Breast | Precancer | Alzheimer disease | 103/684 | 384/8465 | 1.03e-29 | 4.66e-28 | 3.57e-28 | 103 |
| hsa0502217 | Breast | Precancer | Pathways of neurodegeneration - multiple diseases | 112/684 | 476/8465 | 6.96e-27 | 2.44e-25 | 1.87e-25 | 112 |
| hsa0501023 | Breast | IDC | Alzheimer disease | 107/867 | 384/8465 | 1.70e-23 | 7.88e-22 | 5.90e-22 | 107 |
| hsa0502223 | Breast | IDC | Pathways of neurodegeneration - multiple diseases | 116/867 | 476/8465 | 3.63e-20 | 1.18e-18 | 8.82e-19 | 116 |
| hsa0501033 | Breast | IDC | Alzheimer disease | 107/867 | 384/8465 | 1.70e-23 | 7.88e-22 | 5.90e-22 | 107 |
| hsa0502233 | Breast | IDC | Pathways of neurodegeneration - multiple diseases | 116/867 | 476/8465 | 3.63e-20 | 1.18e-18 | 8.82e-19 | 116 |
| hsa0501043 | Breast | DCIS | Alzheimer disease | 105/846 | 384/8465 | 3.23e-23 | 1.49e-21 | 1.10e-21 | 105 |
| hsa0502243 | Breast | DCIS | Pathways of neurodegeneration - multiple diseases | 114/846 | 476/8465 | 4.74e-20 | 1.53e-18 | 1.13e-18 | 114 |
| hsa0501053 | Breast | DCIS | Alzheimer disease | 105/846 | 384/8465 | 3.23e-23 | 1.49e-21 | 1.10e-21 | 105 |
| hsa0502253 | Breast | DCIS | Pathways of neurodegeneration - multiple diseases | 114/846 | 476/8465 | 4.74e-20 | 1.53e-18 | 1.13e-18 | 114 |
| hsa05010 | Colorectum | AD | Alzheimer disease | 174/2092 | 384/8465 | 1.82e-19 | 9.26e-18 | 5.91e-18 | 174 |
| hsa05022 | Colorectum | AD | Pathways of neurodegeneration - multiple diseases | 201/2092 | 476/8465 | 4.54e-18 | 1.27e-16 | 8.09e-17 | 201 |
| hsa00280 | Colorectum | AD | Valine, leucine and isoleucine degradation | 25/2092 | 48/8465 | 3.97e-05 | 3.41e-04 | 2.18e-04 | 25 |
| hsa050101 | Colorectum | AD | Alzheimer disease | 174/2092 | 384/8465 | 1.82e-19 | 9.26e-18 | 5.91e-18 | 174 |
| hsa050221 | Colorectum | AD | Pathways of neurodegeneration - multiple diseases | 201/2092 | 476/8465 | 4.54e-18 | 1.27e-16 | 8.09e-17 | 201 |
| hsa002801 | Colorectum | AD | Valine, leucine and isoleucine degradation | 25/2092 | 48/8465 | 3.97e-05 | 3.41e-04 | 2.18e-04 | 25 |
| hsa050102 | Colorectum | SER | Alzheimer disease | 146/1580 | 384/8465 | 6.52e-20 | 2.40e-18 | 1.75e-18 | 146 |
| hsa050222 | Colorectum | SER | Pathways of neurodegeneration - multiple diseases | 168/1580 | 476/8465 | 6.23e-19 | 2.07e-17 | 1.50e-17 | 168 |
| Page: 1 2 3 4 |
Top |
Cell-cell communication analysis |
| Identification of potential cell-cell interactions between two cell types and their ligand-receptor pairs for different disease states |
| Ligand | Receptor | LRpair | Pathway | Tissue | Disease Stage |
| Page: 1 |
Top |
Single-cell gene regulatory network inference analysis |
| Find out the significant the regulons (TFs) and the target genes of each regulon across cell types for different disease states |
| TF | Cell Type | Tissue | Disease Stage | Target Gene | RSS | Regulon Activity |
| ∗The dot plots of a searched regulon are shown for all cell subpopulations in each disease state of each tissue based on the regulon specific score inferred using pySCENIC and by calculating the average expression. |
| Page: 1 |
Top |
Somatic mutation of malignant transformation related genes |
| Annotation of somatic variants for genes involved in malignant transformation |
| Hugo Symbol | Variant Class | Variant Classification | dbSNP RS | HGVSc | HGVSp | HGVSp Short | SWISSPROT | BIOTYPE | SIFT | PolyPhen | Tumor Sample Barcode | Tissue | Histology | Sex | Age | Stage | Therapy Types | Drugs | Outcome |
| HSD17B10 | SNV | Missense_Mutation | c.101N>A | p.Gly34Glu | p.G34E | Q99714 | protein_coding | deleterious(0) | possibly_damaging(0.907) | TCGA-A2-A0YL-01 | Breast | breast invasive carcinoma | Female | <65 | III/IV | Chemotherapy | cytoxan | SD | |
| HSD17B10 | SNV | Missense_Mutation | novel | c.352N>T | p.Leu118Phe | p.L118F | Q99714 | protein_coding | deleterious(0.02) | benign(0.05) | TCGA-2W-A8YY-01 | Cervix | cervical & endocervical cancer | Female | <65 | I/II | Chemotherapy | cisplatin | CR |
| HSD17B10 | SNV | Missense_Mutation | c.297N>T | p.Lys99Asn | p.K99N | Q99714 | protein_coding | deleterious(0) | probably_damaging(0.952) | TCGA-LP-A4AV-01 | Cervix | cervical & endocervical cancer | Female | <65 | I/II | Unknown | Unknown | SD | |
| HSD17B10 | SNV | Missense_Mutation | c.299N>T | p.Thr100Met | p.T100M | Q99714 | protein_coding | deleterious(0.02) | probably_damaging(0.993) | TCGA-A6-3809-01 | Colorectum | colon adenocarcinoma | Female | >=65 | I/II | Unknown | Unknown | SD | |
| HSD17B10 | SNV | Missense_Mutation | c.16N>T | p.Arg6Trp | p.R6W | Q99714 | protein_coding | deleterious(0) | probably_damaging(0.948) | TCGA-AA-3492-01 | Colorectum | colon adenocarcinoma | Female | >=65 | I/II | Unknown | Unknown | SD | |
| HSD17B10 | SNV | Missense_Mutation | rs12847788 | c.35N>C | p.Val12Ala | p.V12A | Q99714 | protein_coding | tolerated(0.05) | probably_damaging(0.992) | TCGA-F5-6814-01 | Colorectum | rectum adenocarcinoma | Male | <65 | I/II | Unknown | Unknown | SD |
| HSD17B10 | SNV | Missense_Mutation | novel | c.548C>T | p.Ala183Val | p.A183V | Q99714 | protein_coding | deleterious(0) | probably_damaging(0.989) | TCGA-A5-A0G1-01 | Endometrium | uterine corpus endometrioid carcinoma | Female | >=65 | I/II | Unknown | Unknown | SD |
| HSD17B10 | SNV | Missense_Mutation | novel | c.239G>A | p.Gly80Glu | p.G80E | Q99714 | protein_coding | tolerated(1) | benign(0) | TCGA-A5-A0G1-01 | Endometrium | uterine corpus endometrioid carcinoma | Female | >=65 | I/II | Unknown | Unknown | SD |
| HSD17B10 | SNV | Missense_Mutation | novel | c.664N>T | p.Pro222Ser | p.P222S | Q99714 | protein_coding | deleterious(0) | probably_damaging(0.954) | TCGA-A5-A2K5-01 | Endometrium | uterine corpus endometrioid carcinoma | Female | >=65 | I/II | Unknown | Unknown | SD |
| HSD17B10 | SNV | Missense_Mutation | c.716C>T | p.Ala239Val | p.A239V | Q99714 | protein_coding | tolerated(0.25) | benign(0.001) | TCGA-AP-A051-01 | Endometrium | uterine corpus endometrioid carcinoma | Female | >=65 | I/II | Unknown | Unknown | SD |
| Page: 1 2 3 |
Top |
Related drugs of malignant transformation related genes |
| Identification of chemicals and drugs interact with genes involved in malignant transfromation |
| (DGIdb 4.0) |
| Entrez ID | Symbol | Category | Interaction Types | Drug Claim Name | Drug Name | PMIDs |
| 3028 | HSD17B10 | DRUGGABLE GENOME, SHORT CHAIN DEHYDROGENASE REDUCTASE, ENZYME | PYRENE | PYRENE | ||
| 3028 | HSD17B10 | DRUGGABLE GENOME, SHORT CHAIN DEHYDROGENASE REDUCTASE, ENZYME | CID 1245272 | CHEMBL408850 | ||
| 3028 | HSD17B10 | DRUGGABLE GENOME, SHORT CHAIN DEHYDROGENASE REDUCTASE, ENZYME | MYRICETIN | MYRICETIN | ||
| 3028 | HSD17B10 | DRUGGABLE GENOME, SHORT CHAIN DEHYDROGENASE REDUCTASE, ENZYME | BILIRUBIN | BILIRUBIN | ||
| 3028 | HSD17B10 | DRUGGABLE GENOME, SHORT CHAIN DEHYDROGENASE REDUCTASE, ENZYME | 3-HYDROXY-3',4'-DIMETHOXYFLAVONE | 3-HYDROXY-3',4'-DIMETHOXYFLAVONE | ||
| 3028 | HSD17B10 | DRUGGABLE GENOME, SHORT CHAIN DEHYDROGENASE REDUCTASE, ENZYME | TERAZOSIN HYDROCHLORIDE | TERAZOSIN HYDROCHLORIDE | ||
| 3028 | HSD17B10 | DRUGGABLE GENOME, SHORT CHAIN DEHYDROGENASE REDUCTASE, ENZYME | PYRROLIDINE DITHIOCARBAMATE | PYRROLIDINE DITHIOCARBAMATE | ||
| 3028 | HSD17B10 | DRUGGABLE GENOME, SHORT CHAIN DEHYDROGENASE REDUCTASE, ENZYME | PRAZOSIN HYDROCHLORIDE | PRAZOSIN HYDROCHLORIDE | ||
| 3028 | HSD17B10 | DRUGGABLE GENOME, SHORT CHAIN DEHYDROGENASE REDUCTASE, ENZYME | METHYL 7-DESHYDROXYPYROGALLIN-4-CARBOXYLATE | METHYL 7-DESHYDROXYPYROGALLIN-4-CARBOXYLATE | ||
| 3028 | HSD17B10 | DRUGGABLE GENOME, SHORT CHAIN DEHYDROGENASE REDUCTASE, ENZYME | SKF-82526 | CHEMBL1161520 |
| Page: 1 2 3 4 5 6 7 8 9 10 11 12 13 14 15 16 17 18 19 20 21 22 23 24 25 26 27 28 29 30 31 32 33 34 35 36 37 38 39 40 41 42 |

Copyright 2023-Present -The University of Texas Health Science Center at Houston |