Schematic overview of the cellular and molecular mechanisms involved in the cancer progression, including the proposed cellular and molecular mechanisms in cancer cells trajectory. AT1: alveolar type 1 cells; AT2: alveolar type 2 cells; AAH: atypical adenomatous hyperplasia; AIS: adenocarcinoma in situ; MIA: minimally invasive adenocarcinoma; IA: invasive adenocarcinoma; EMT: epithelial-mesenchymal transition

Home

Download

Statistics

Help

Contact

Center for Computational Systems Medicine
leaf

Gene summary

leaf

Malignant transformation analysis

leaf

Malignant transformation related pathway analysis

leaf

Cell-cell communication analysis

leaf

Single-cell gene regulatory network inference analysis

leaf

Somatic mutation of malignant transformation related genes

leaf

Related drugs of malignant transformation related genes

Gene: HN1

Gene summary for HN1

check button Gene summary.

Gene informationSpeciesHuman
Gene symbol

HN1

Gene ID

51155

Gene nameJupiter microtubule associated homolog 1
Gene AliasARM2
Cytomap17q25.1
Gene Typeprotein-coding
GO ID

GO:0005575

UniProtAcc

Q9UK76


Top

Malignant transformation analysis

check button Identification of the aberrant gene expression in precancerous and cancerous lesions by comparing the gene expression of stem-like cells in diseased tissues with normal stem cells
check button Malignant transformation involving gene list.
Entrez IDSymbolReplicatesSpeciesOrganTissueAdj P-valueLog2FCMalignancy
51155HN1GSM4909281HumanBreastIDC3.69e-10-2.03e-010.21
51155HN1GSM4909282HumanBreastIDC7.71e-11-2.03e-01-0.0288
51155HN1GSM4909285HumanBreastIDC7.71e-11-2.03e-010.21
51155HN1GSM4909286HumanBreastIDC1.69e-10-2.03e-010.1081
51155HN1GSM4909287HumanBreastIDC5.04e-09-2.03e-010.2057
51155HN1GSM4909290HumanBreastIDC6.20e-06-2.03e-010.2096
51155HN1GSM4909291HumanBreastIDC1.86e-04-2.03e-010.1753
51155HN1GSM4909293HumanBreastIDC7.71e-11-2.03e-010.1581
51155HN1GSM4909294HumanBreastIDC3.52e-11-2.03e-010.2022
51155HN1GSM4909295HumanBreastIDC4.17e-03-2.03e-010.0898
51155HN1GSM4909296HumanBreastIDC1.69e-10-2.03e-010.1524
51155HN1GSM4909297HumanBreastIDC3.69e-10-2.03e-010.1517
51155HN1GSM4909298HumanBreastIDC1.69e-10-2.03e-010.1551
51155HN1GSM4909299HumanBreastIDC3.69e-10-2.03e-010.035
51155HN1GSM4909300HumanBreastIDC1.59e-02-2.03e-010.0334
51155HN1GSM4909301HumanBreastIDC3.30e-12-2.03e-010.1577
51155HN1GSM4909302HumanBreastIDC7.22e-09-2.03e-010.1545
51155HN1GSM4909304HumanBreastIDC1.60e-11-2.03e-010.1636
51155HN1GSM4909305HumanBreastIDC1.14e-05-2.03e-010.0436
51155HN1GSM4909306HumanBreastIDC7.71e-11-2.03e-010.1564
Page: 1 2 3 4 5 6 7 8 9 10 11 

check button Transcriptomic changes along malignancy continuum.
TissueExpression DynamicsAbbreviation
BreastThe image shows the transcriptomic changes along malignancy continuum.log2FC in expression of this searched gene in stem-like cells from each diseased tissue sample relative to stem-like cells in normal samples in each tissue plotted against the malignancy continuum. Samples are colored based on if they are from different disease stage.
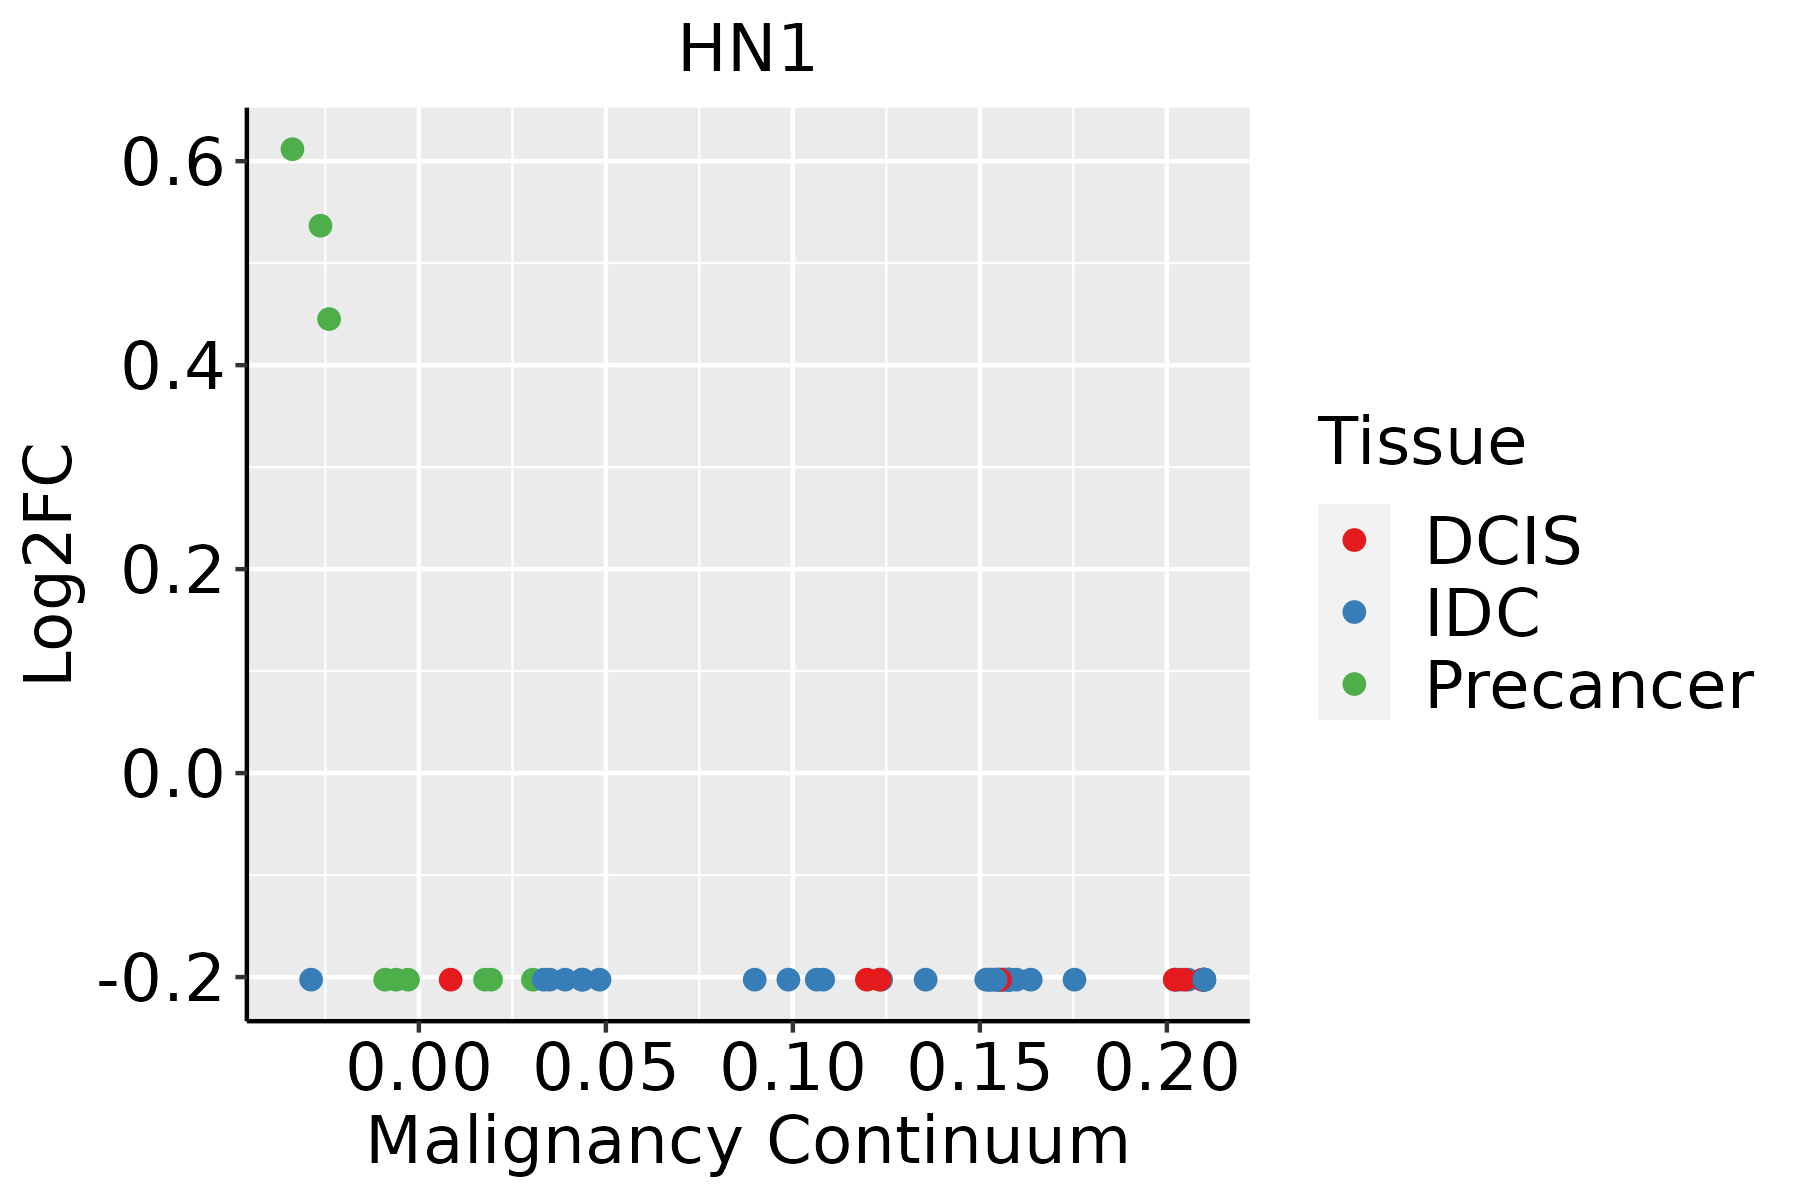
IDC: Invasive ductal carcinoma
DCIS: Ductal carcinoma in situ
Precancer(BRCA1-mut): Precancerous lesion from BRCA1 mutation carriers
Colorectum (GSE201348)The image shows the transcriptomic changes along malignancy continuum.log2FC in expression of this searched gene in stem-like cells from each diseased tissue sample relative to stem-like cells in normal samples in each tissue plotted against the malignancy continuum. Samples are colored based on if they are from different disease stage.FAP: Familial adenomatous polyposis
CRC: Colorectal cancer
Colorectum (HTA11)The image shows the transcriptomic changes along malignancy continuum.log2FC in expression of this searched gene in stem-like cells from each diseased tissue sample relative to stem-like cells in normal samples in each tissue plotted against the malignancy continuum. Samples are colored based on if they are from different disease stage.AD: Adenomas
SER: Sessile serrated lesions
MSI-H: Microsatellite-high colorectal cancer
MSS: Microsatellite stable colorectal cancer
EsophagusThe image shows the transcriptomic changes along malignancy continuum.log2FC in expression of this searched gene in stem-like cells from each diseased tissue sample relative to stem-like cells in normal samples in each tissue plotted against the malignancy continuum. Samples are colored based on if they are from different disease stage.
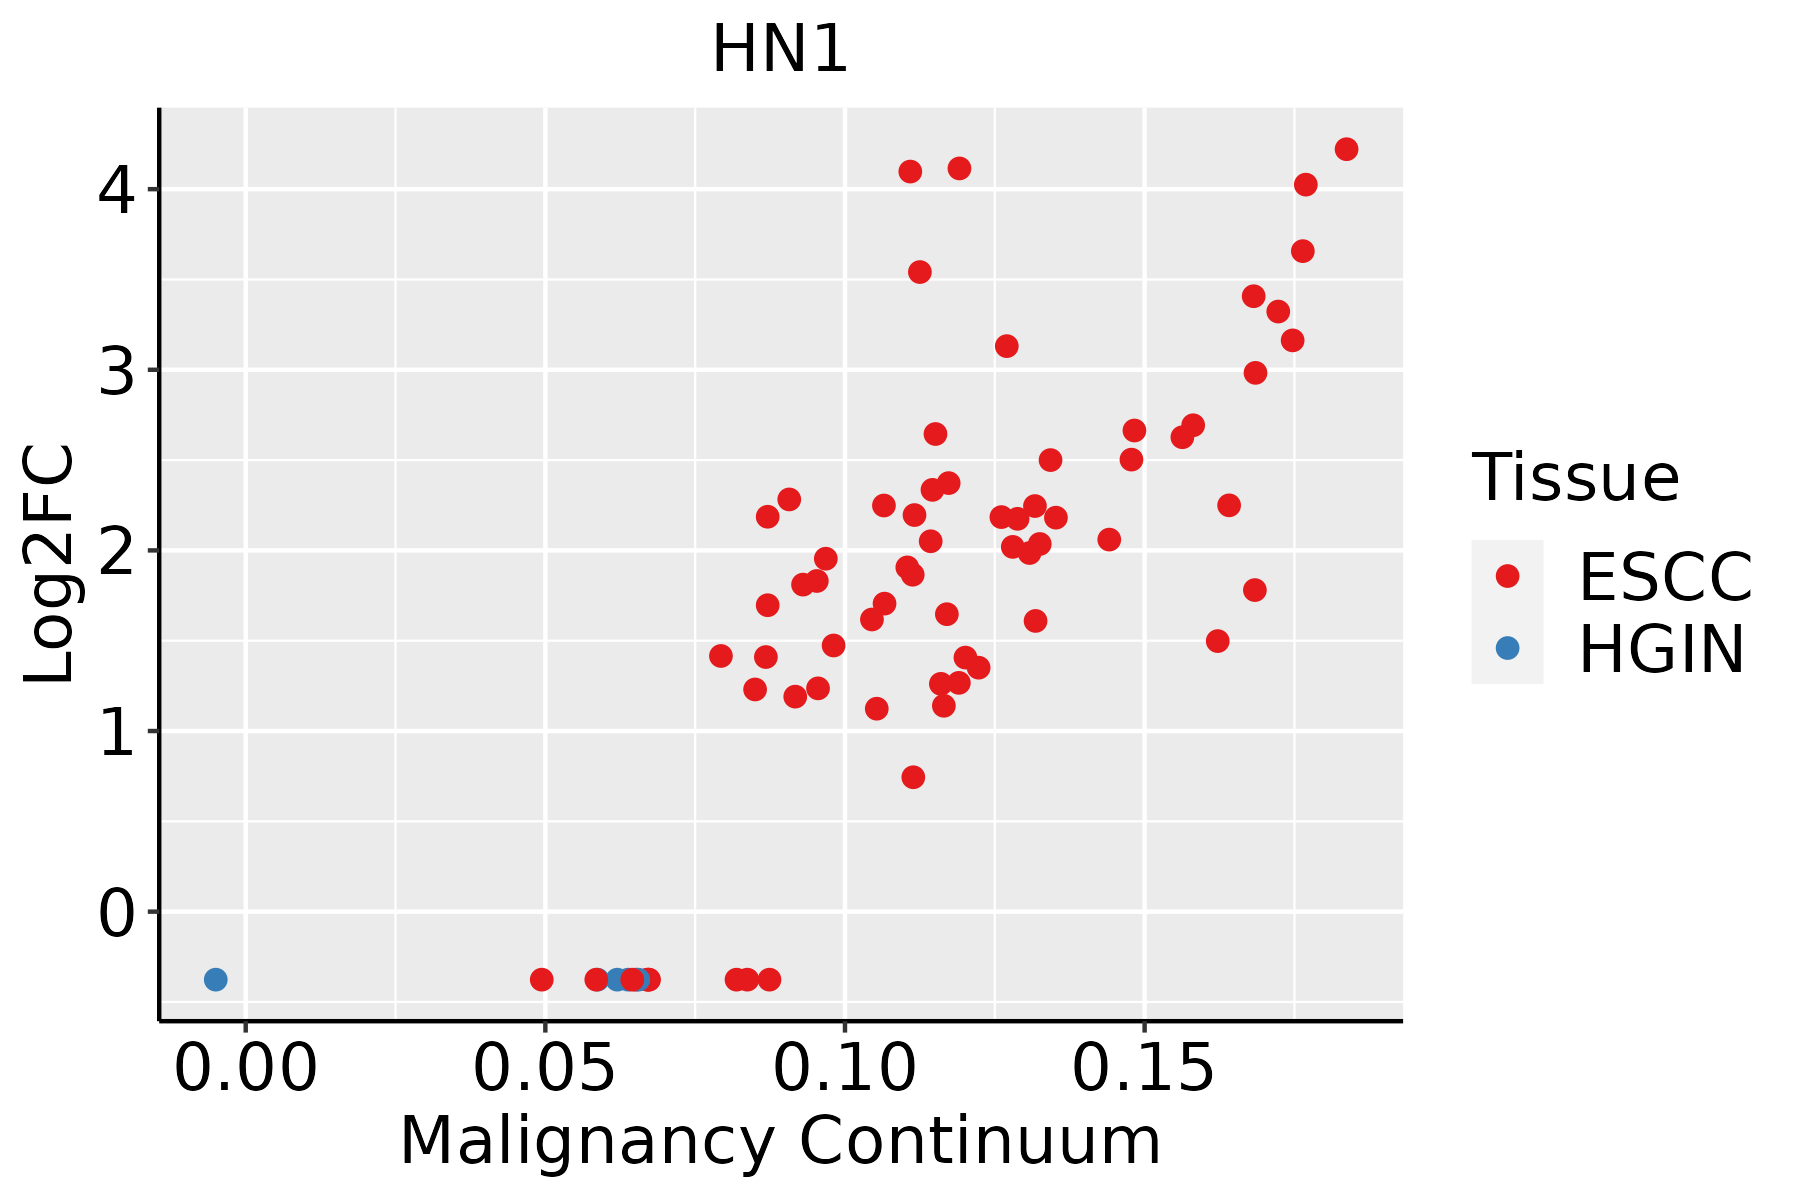
ESCC: Esophageal squamous cell carcinoma
HGIN: High-grade intraepithelial neoplasias
LGIN: Low-grade intraepithelial neoplasias
GCThe image shows the transcriptomic changes along malignancy continuum.log2FC in expression of this searched gene in stem-like cells from each diseased tissue sample relative to stem-like cells in normal samples in each tissue plotted against the malignancy continuum. Samples are colored based on if they are from different disease stage.CAG: Chronic atrophic gastritis
CAG with IM: Chronic atrophic gastritis with intestinal metaplasia
CSG: Chronic superficial gastritis
GC: Gastric cancer
SIM: Severe intestinal metaplasia
WIM: Wild intestinal metaplasia
LiverThe image shows the transcriptomic changes along malignancy continuum.log2FC in expression of this searched gene in stem-like cells from each diseased tissue sample relative to stem-like cells in normal samples in each tissue plotted against the malignancy continuum. Samples are colored based on if they are from different disease stage.
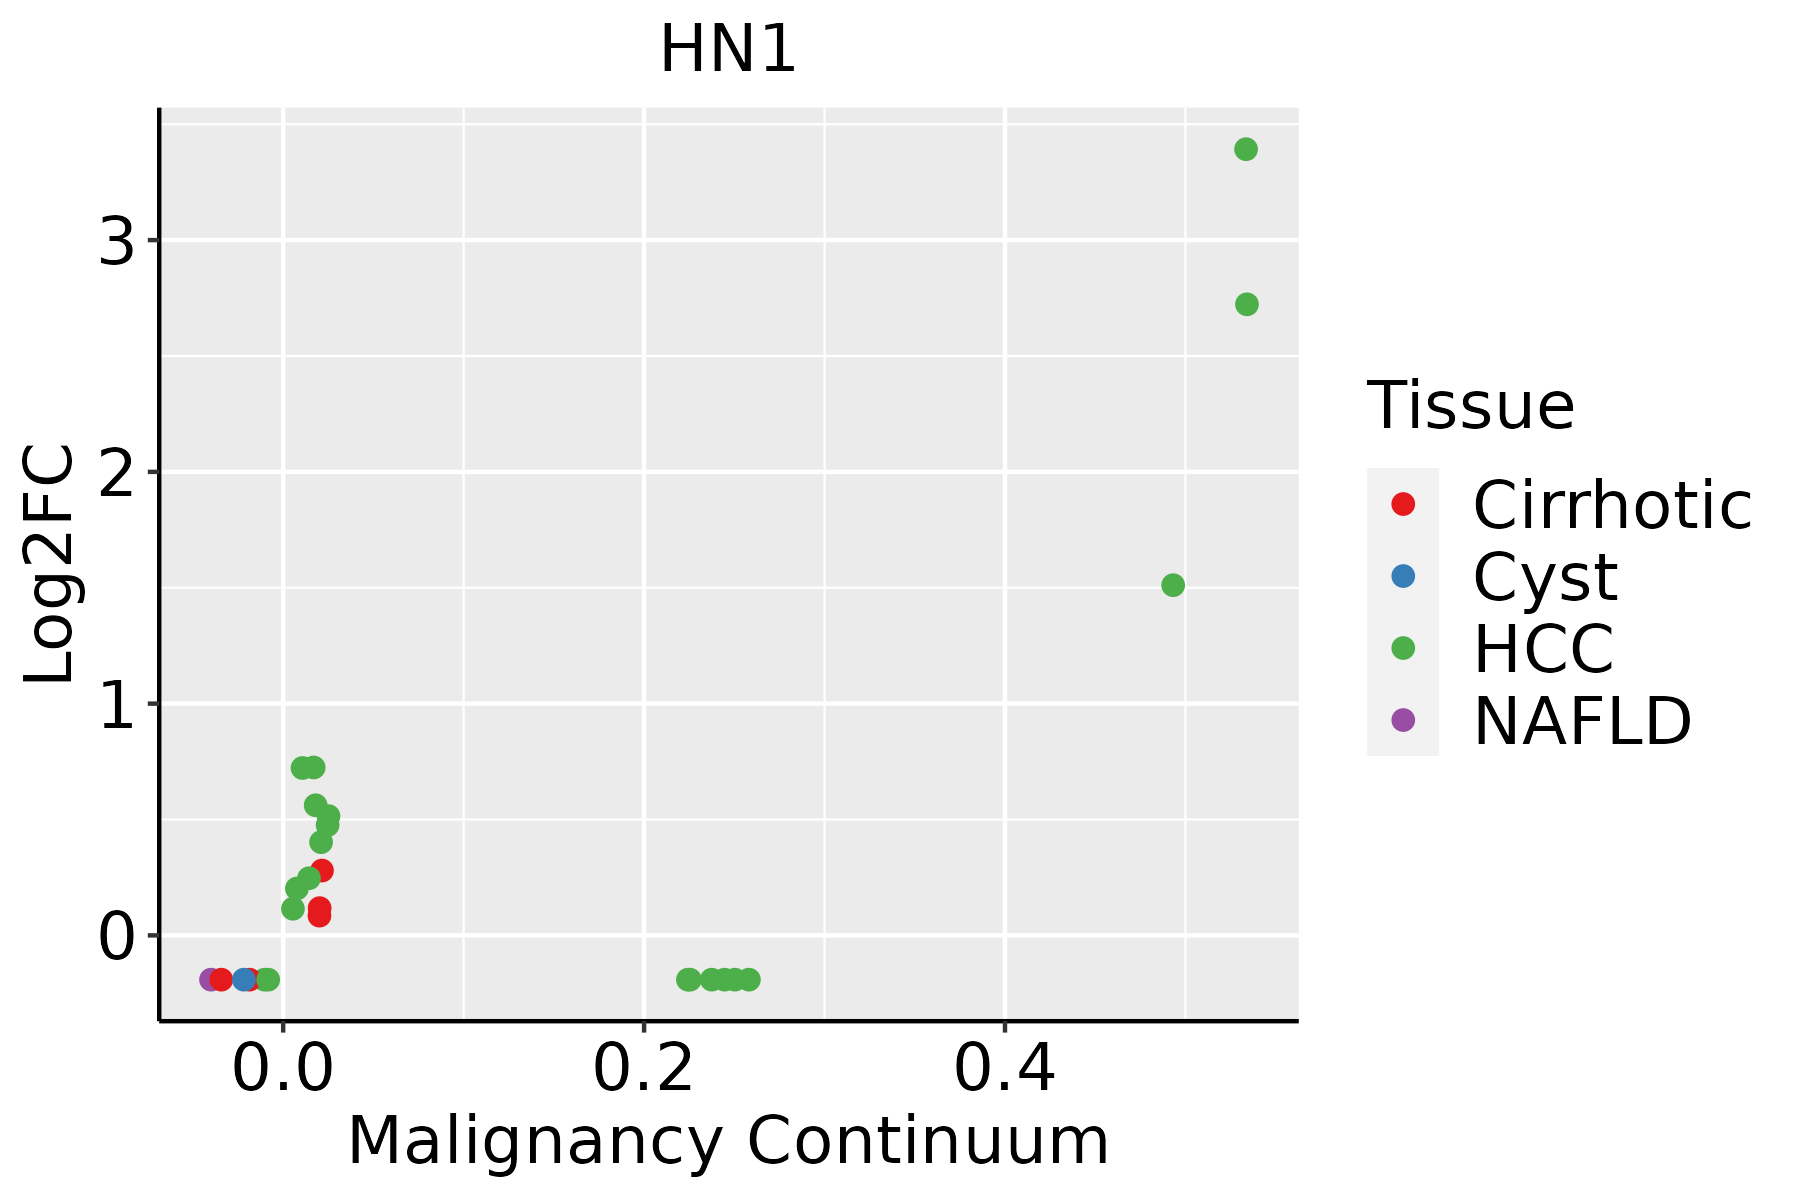
HCC: Hepatocellular carcinoma
NAFLD: Non-alcoholic fatty liver disease
Oral CavityThe image shows the transcriptomic changes along malignancy continuum.log2FC in expression of this searched gene in stem-like cells from each diseased tissue sample relative to stem-like cells in normal samples in each tissue plotted against the malignancy continuum. Samples are colored based on if they are from different disease stage.EOLP: Erosive Oral lichen planus
LP: leukoplakia
NEOLP: Non-erosive oral lichen planus
OSCC: Oral squamous cell carcinoma
ProstateThe image shows the transcriptomic changes along malignancy continuum.log2FC in expression of this searched gene in stem-like cells from each diseased tissue sample relative to stem-like cells in normal samples in each tissue plotted against the malignancy continuum. Samples are colored based on if they are from different disease stage.BPH: Benign Prostatic Hyperplasia
SkinThe image shows the transcriptomic changes along malignancy continuum.log2FC in expression of this searched gene in stem-like cells from each diseased tissue sample relative to stem-like cells in normal samples in each tissue plotted against the malignancy continuum. Samples are colored based on if they are from different disease stage.
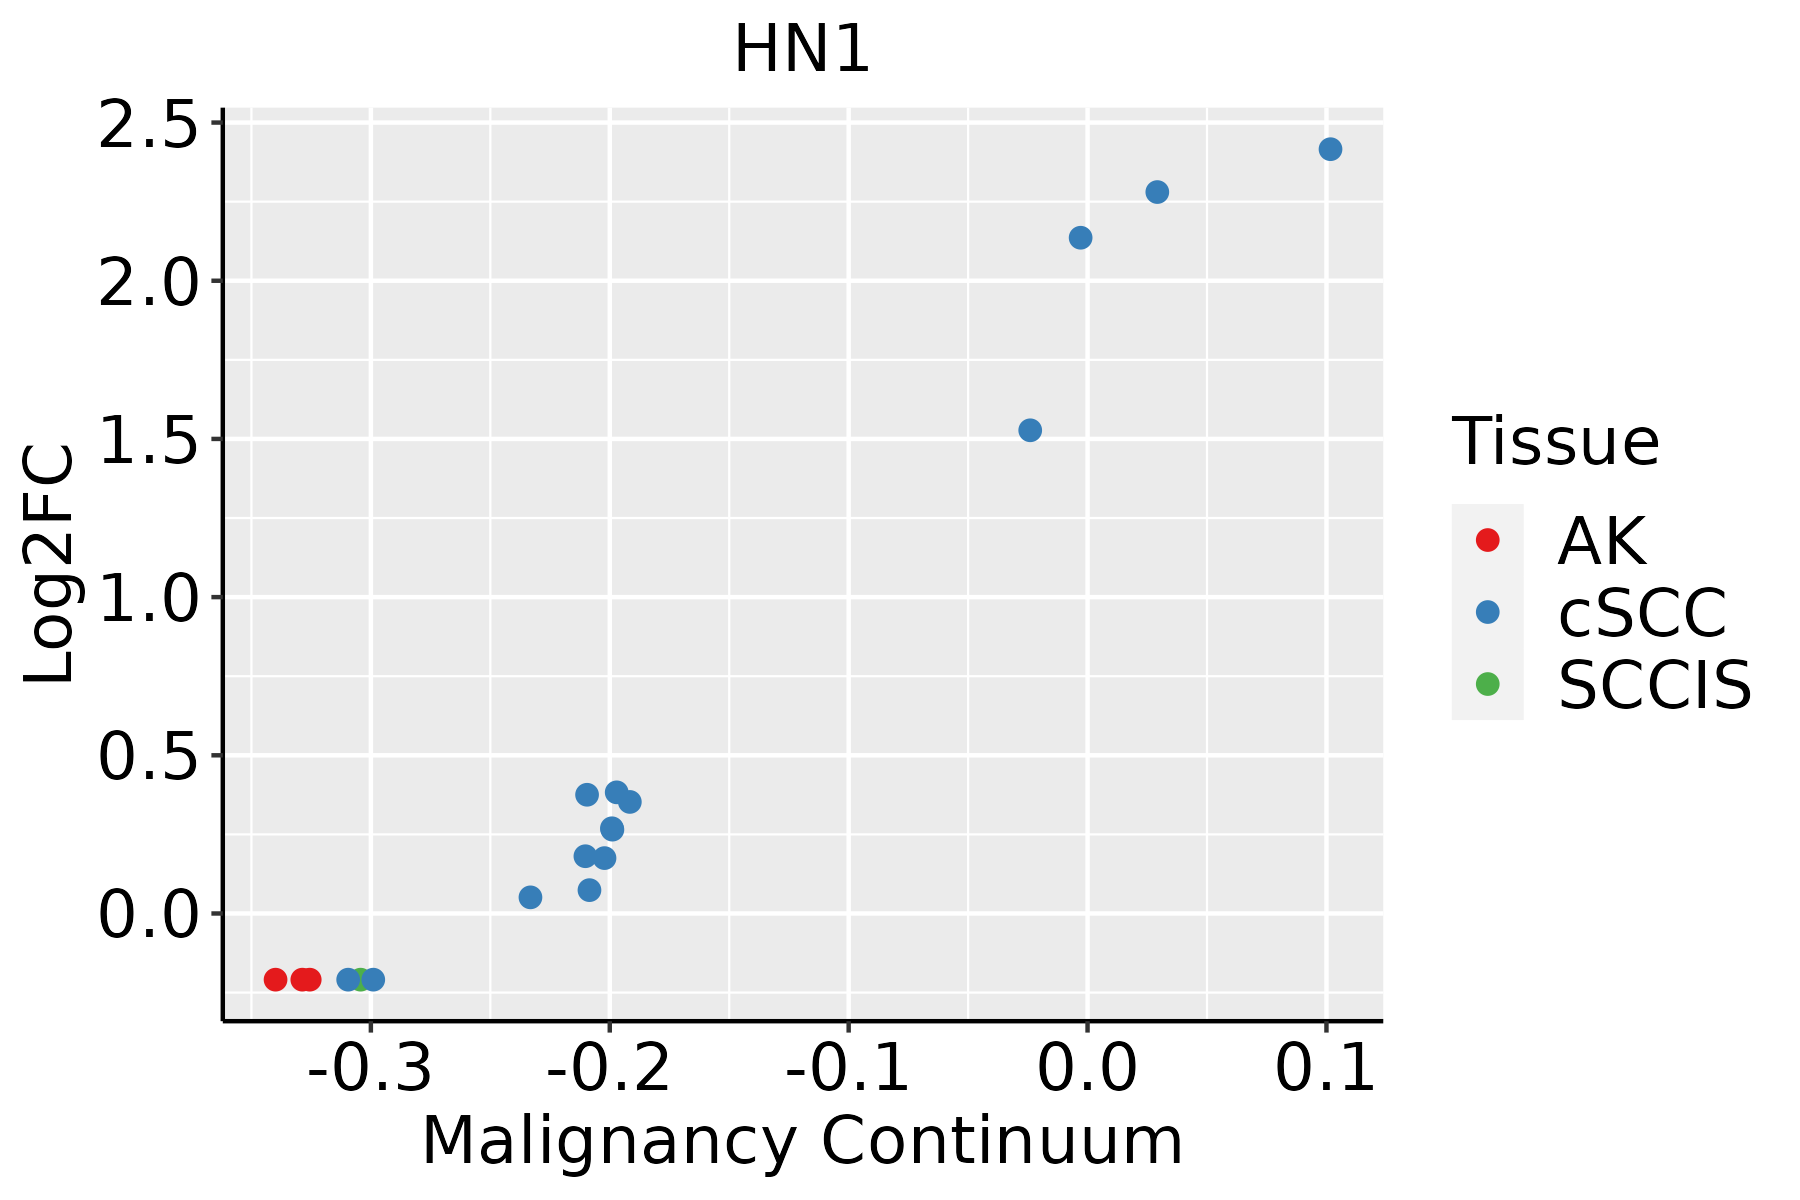
AK: Actinic keratosis
cSCC: Cutaneous squamous cell carcinoma
SCCIS:squamous cell carcinoma in situ
∗log2FC in expression of this searched gene in stem-like cells from each diseased tissue sample relative to stem-like cells in normal samples in each tissue plotted against the malignancy continuum. Samples are colored based on if they are from different disease stage.

Top

Malignant transformation related pathway analysis

check buttonFind out the enriched GO biological processes and KEGG pathways involved in transition from healthy to precancer to cancer
check button Figure of enriched GO biological processes.
TissueDisease StageEnriched GO biological Processes
ColorectumADGO analysis - Figure of enriched GO biological processes: Top 15 enriched GO BP terms are showed in the bar plot of each disease state in each tissue. Each row represents a significant GO biological process which is colored according to the -log10(p.adjust).
ColorectumSERGO analysis - Figure of enriched GO biological processes: Top 15 enriched GO BP terms are showed in the bar plot of each disease state in each tissue. Each row represents a significant GO biological process which is colored according to the -log10(p.adjust).
ColorectumMSSGO analysis - Figure of enriched GO biological processes: Top 15 enriched GO BP terms are showed in the bar plot of each disease state in each tissue. Each row represents a significant GO biological process which is colored according to the -log10(p.adjust).
ColorectumMSI-HGO analysis - Figure of enriched GO biological processes: Top 15 enriched GO BP terms are showed in the bar plot of each disease state in each tissue. Each row represents a significant GO biological process which is colored according to the -log10(p.adjust).
ColorectumFAPGO analysis - Figure of enriched GO biological processes: Top 15 enriched GO BP terms are showed in the bar plot of each disease state in each tissue. Each row represents a significant GO biological process which is colored according to the -log10(p.adjust).
∗Top 15 enriched GO BP terms are showed in the bar plot of each disease state in each tissue. Each row represents a significant GO biological process which is colored according to the -log10(p.adjust).
Page: 1 2 3 4 5 6 7 8 9 

check button Enriched GO biological processes.
GO IDTissueDisease StageDescriptionGene RatioBg Ratiopvaluep.adjustCount
GO:009950411LungAISsynaptic vesicle cycle36/1849181/187233.42e-051.05e-0336
GO:003010012LungAISregulation of endocytosis40/1849211/187234.10e-051.23e-0340
GO:004848811LungAISsynaptic vesicle endocytosis17/184962/187237.32e-051.91e-0317
GO:014023811LungAISpresynaptic endocytosis17/184962/187237.32e-051.91e-0317
GO:004217713LungAISnegative regulation of protein catabolic process26/1849121/187231.09e-042.57e-0326
GO:009016212LungAISestablishment of epithelial cell polarity11/184931/187231.10e-042.57e-0311
GO:000726612LungAISRho protein signal transduction28/1849137/187231.51e-043.22e-0328
GO:004825912LungAISregulation of receptor-mediated endocytosis24/1849110/187231.54e-043.26e-0324
GO:004311212LungAISreceptor metabolic process32/1849166/187231.68e-043.53e-0332
GO:00069291LungAISsubstrate-dependent cell migration9/184923/187231.98e-044.07e-039
GO:003150311LungAISprotein-containing complex localization39/1849220/187232.24e-044.51e-0339
GO:000740911LungAISaxonogenesis64/1849418/187232.62e-045.04e-0364
GO:003646511LungAISsynaptic vesicle recycling18/184975/187232.89e-045.40e-0318
GO:190336312LungAISnegative regulation of cellular protein catabolic process18/184975/187232.89e-045.40e-0318
GO:004586113LungAISnegative regulation of proteolysis55/1849351/187233.87e-046.72e-0355
GO:006156411LungAISaxon development69/1849467/187234.37e-047.41e-0369
GO:009917311LungAISpostsynapse organization31/1849168/187234.67e-047.79e-0331
GO:004395411LungAIScellular component maintenance15/184961/187236.88e-041.02e-0215
GO:003508811LungAISestablishment or maintenance of apical/basal cell polarity13/184949/187237.13e-041.04e-0213
GO:006124511LungAISestablishment or maintenance of bipolar cell polarity13/184949/187237.13e-041.04e-0213
Page: 1 2 3 4 5 6 7 8 9 10 11 12 13 14 

check button Enriched KEGG pathways.
Pathway IDTissueDisease StageDescriptionGene RatioBg Ratiopvaluep.adjustqvalueCount
Page: 1 

Top

Cell-cell communication analysis

check buttonIdentification of potential cell-cell interactions between two cell types and their ligand-receptor pairs for different disease states
LigandReceptorLRpairPathwayTissueDisease Stage
Page: 1 

Top

Single-cell gene regulatory network inference analysis

check buttonFind out the significant the regulons (TFs) and the target genes of each regulon across cell types for different disease states
TFCell TypeTissueDisease StageTarget GeneRSSRegulon Activity
∗The dot plots of a searched regulon are shown for all cell subpopulations in each disease state of each tissue based on the regulon specific score inferred using pySCENIC and by calculating the average expression.
Page: 1 

Top

Somatic mutation of malignant transformation related genes

check buttonAnnotation of somatic variants for genes involved in malignant transformation
Hugo SymbolVariant ClassVariant ClassificationdbSNP RSHGVScHGVSpHGVSp ShortSWISSPROTBIOTYPESIFTPolyPhenTumor Sample BarcodeTissueHistologySexAgeStageTherapy TypesDrugsOutcome
HN1SNVMissense_Mutationrs765086350c.194N>Tp.Ser65Leup.S65LQ9UK76protein_codingdeleterious(0.01)benign(0.08)TCGA-LP-A7HU-01Cervixcervical & endocervical cancerFemale<65I/IIUnknownUnknownSD
HN1SNVMissense_Mutationnovelc.70N>Ap.Pro24Thrp.P24TQ9UK76protein_codingdeleterious(0)probably_damaging(0.998)TCGA-LP-A7HU-01Cervixcervical & endocervical cancerFemale<65I/IIUnknownUnknownSD
HN1SNVMissense_Mutationc.464N>Ap.Arg155Hisp.R155HQ9UK76protein_codingtolerated_low_confidence(0.08)benign(0.258)TCGA-AA-A01D-01Colorectumcolon adenocarcinomaFemale<65III/IVChemotherapycapecitabinePD
HN1SNVMissense_Mutationc.122N>Ap.Pro41Hisp.P41HQ9UK76protein_codingdeleterious(0)probably_damaging(0.925)TCGA-AP-A051-01Endometriumuterine corpus endometrioid carcinomaFemale>=65I/IIUnknownUnknownSD
HN1SNVMissense_Mutationrs758089157c.361C>Tp.Arg121Cysp.R121CQ9UK76protein_codingdeleterious_low_confidence(0.01)benign(0.319)TCGA-AX-A2HC-01Endometriumuterine corpus endometrioid carcinomaFemale<65III/IVChemotherapypaclitaxelPD
HN1SNVMissense_Mutationc.275C>Tp.Ser92Phep.S92FQ9UK76protein_codingdeleterious_low_confidence(0)possibly_damaging(0.471)TCGA-D1-A103-01Endometriumuterine corpus endometrioid carcinomaFemale>=65I/IIUnknownUnknownSD
HN1SNVMissense_Mutationrs371693377c.419C>Tp.Ala140Valp.A140VQ9UK76protein_codingtolerated_low_confidence(0.32)benign(0.003)TCGA-D1-A175-01Endometriumuterine corpus endometrioid carcinomaFemale<65I/IIChemotherapypaclitaxelSD
HN1SNVMissense_Mutationnovelc.73N>Tp.Gly25Cysp.G25CQ9UK76protein_codingdeleterious(0)probably_damaging(1)TCGA-DF-A2KN-01Endometriumuterine corpus endometrioid carcinomaFemaleUnknownI/IIUnknownUnknownSD
HN1insertionFrame_Shift_Insnovelc.415_416insCp.Leu139ProfsTer11p.L139Pfs*11Q9UK76protein_codingTCGA-EO-A3AU-01Endometriumuterine corpus endometrioid carcinomaFemale>=65I/IIUnknownUnknownPD
HN1SNVMissense_Mutationrs868058942c.64N>Tp.Arg22Trpp.R22WQ9UK76protein_codingdeleterious_low_confidence(0)probably_damaging(0.958)TCGA-BR-4370-01Stomachstomach adenocarcinomaFemale>=65I/IIUnknownUnknownSD
Page: 1 2 

Top

Related drugs of malignant transformation related genes

check buttonIdentification of chemicals and drugs interact with genes involved in malignant transfromation
(DGIdb 4.0)
Entrez IDSymbolCategoryInteraction TypesDrug Claim NameDrug NamePMIDs
Page: 1