
|
|||||
|
 | |
| |
| |
| |
| |
| |
|
Gene: GDA |
Gene summary for GDA |
| Gene information | Species | Human | Gene symbol | GDA | Gene ID | 9615 |
| Gene name | guanine deaminase | |
| Gene Alias | CYPIN | |
| Cytomap | 9q21.13 | |
| Gene Type | protein-coding | GO ID | GO:0000255 | UniProtAcc | Q9Y2T3 |
Top |
Malignant transformation analysis |
| Identification of the aberrant gene expression in precancerous and cancerous lesions by comparing the gene expression of stem-like cells in diseased tissues with normal stem cells |
| Entrez ID | Symbol | Replicates | Species | Organ | Tissue | Adj P-value | Log2FC | Malignancy |
| 9615 | GDA | HTA11_2487_2000001011 | Human | Colorectum | SER | 6.29e-09 | 8.87e-01 | -0.1808 |
| 9615 | GDA | HTA11_1938_2000001011 | Human | Colorectum | AD | 1.58e-03 | 2.69e-01 | -0.0811 |
| 9615 | GDA | HTA11_78_2000001011 | Human | Colorectum | AD | 6.31e-04 | 3.51e-01 | -0.1088 |
| 9615 | GDA | HTA11_347_2000001011 | Human | Colorectum | AD | 6.06e-04 | 4.83e-01 | -0.1954 |
| 9615 | GDA | HTA11_2112_2000001011 | Human | Colorectum | SER | 2.70e-02 | 8.18e-01 | -0.2196 |
| 9615 | GDA | HTA11_1391_2000001011 | Human | Colorectum | AD | 2.34e-03 | 4.75e-01 | -0.059 |
| 9615 | GDA | HTA11_99999965062_69753 | Human | Colorectum | MSI-H | 6.59e-05 | 1.43e+00 | 0.3487 |
| 9615 | GDA | HTA11_99999965104_69814 | Human | Colorectum | MSS | 3.13e-02 | 2.27e-01 | 0.281 |
| 9615 | GDA | CRC-1-8810 | Human | Colorectum | CRC | 7.56e-05 | 3.50e-01 | 0.6257 |
| 9615 | GDA | AEH-subject1 | Human | Endometrium | AEH | 3.00e-11 | 5.37e-01 | -0.3059 |
| 9615 | GDA | AEH-subject2 | Human | Endometrium | AEH | 9.63e-22 | 7.05e-01 | -0.2525 |
| 9615 | GDA | AEH-subject3 | Human | Endometrium | AEH | 4.70e-02 | 2.50e-01 | -0.2576 |
| 9615 | GDA | AEH-subject4 | Human | Endometrium | AEH | 6.96e-08 | 4.00e-01 | -0.2657 |
| 9615 | GDA | AEH-subject5 | Human | Endometrium | AEH | 4.57e-11 | 6.02e-01 | -0.2953 |
| 9615 | GDA | EEC-subject2 | Human | Endometrium | EEC | 3.15e-25 | 7.45e-01 | -0.2607 |
| 9615 | GDA | EEC-subject5 | Human | Endometrium | EEC | 5.10e-13 | 5.55e-01 | -0.249 |
| 9615 | GDA | GSM6177621_NYU_UCEC2_lib1_lib1 | Human | Endometrium | EEC | 4.17e-02 | 1.92e-01 | -0.1934 |
| 9615 | GDA | GSM6177622_NYU_UCEC3_lib1_lib1 | Human | Endometrium | EEC | 5.00e-11 | 4.51e-01 | -0.1917 |
| 9615 | GDA | GSM6177622_NYU_UCEC3_lib2_lib2 | Human | Endometrium | EEC | 5.10e-10 | 4.95e-01 | -0.1916 |
| 9615 | GDA | GSM6177623_NYU_UCEC3_Vis | Human | Endometrium | EEC | 3.01e-13 | 4.31e-01 | -0.1269 |
| Page: 1 2 3 |
| Tissue | Expression Dynamics | Abbreviation |
| Colorectum (GSE201348) |  | FAP: Familial adenomatous polyposis |
| CRC: Colorectal cancer | ||
| Colorectum (HTA11) |  | AD: Adenomas |
| SER: Sessile serrated lesions | ||
| MSI-H: Microsatellite-high colorectal cancer | ||
| MSS: Microsatellite stable colorectal cancer | ||
| Endometrium | 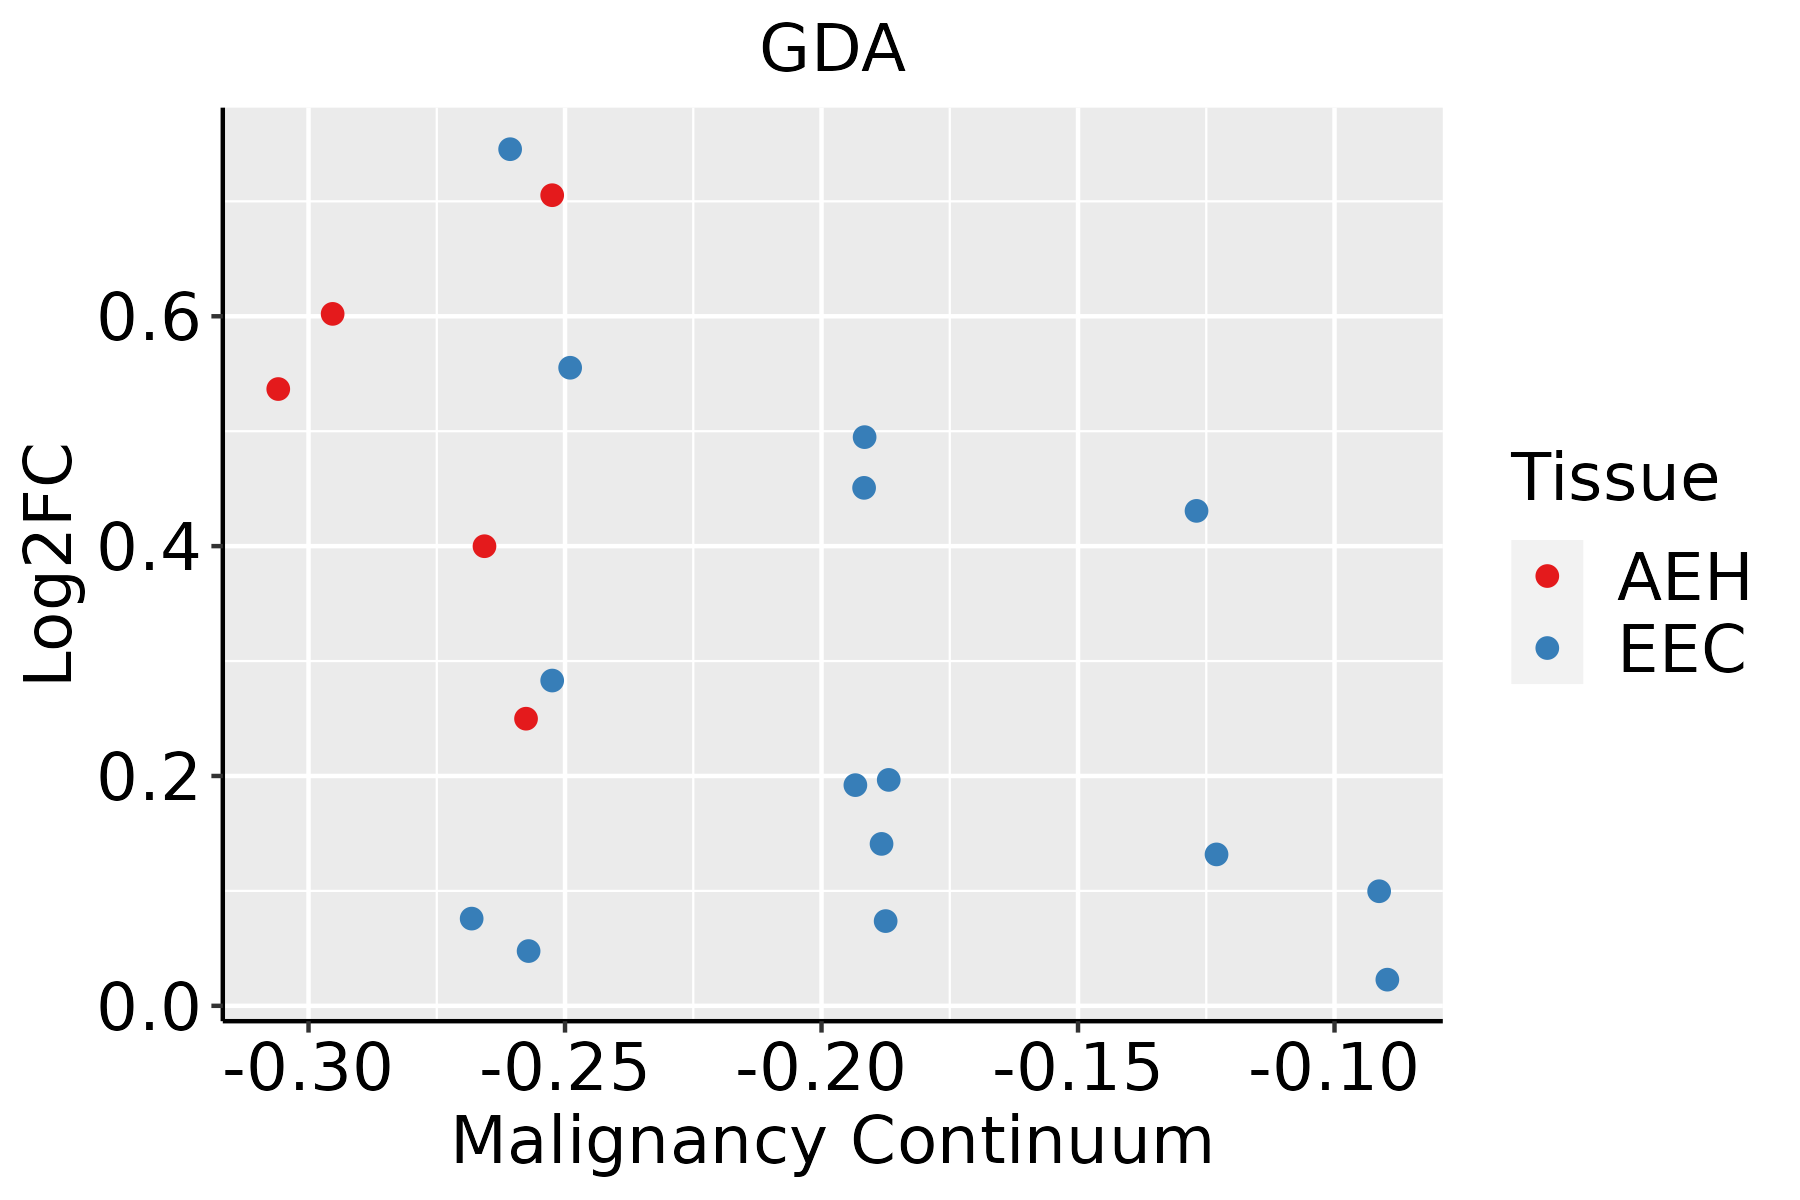 | AEH: Atypical endometrial hyperplasia |
| EEC: Endometrioid Cancer | ||
| GC | 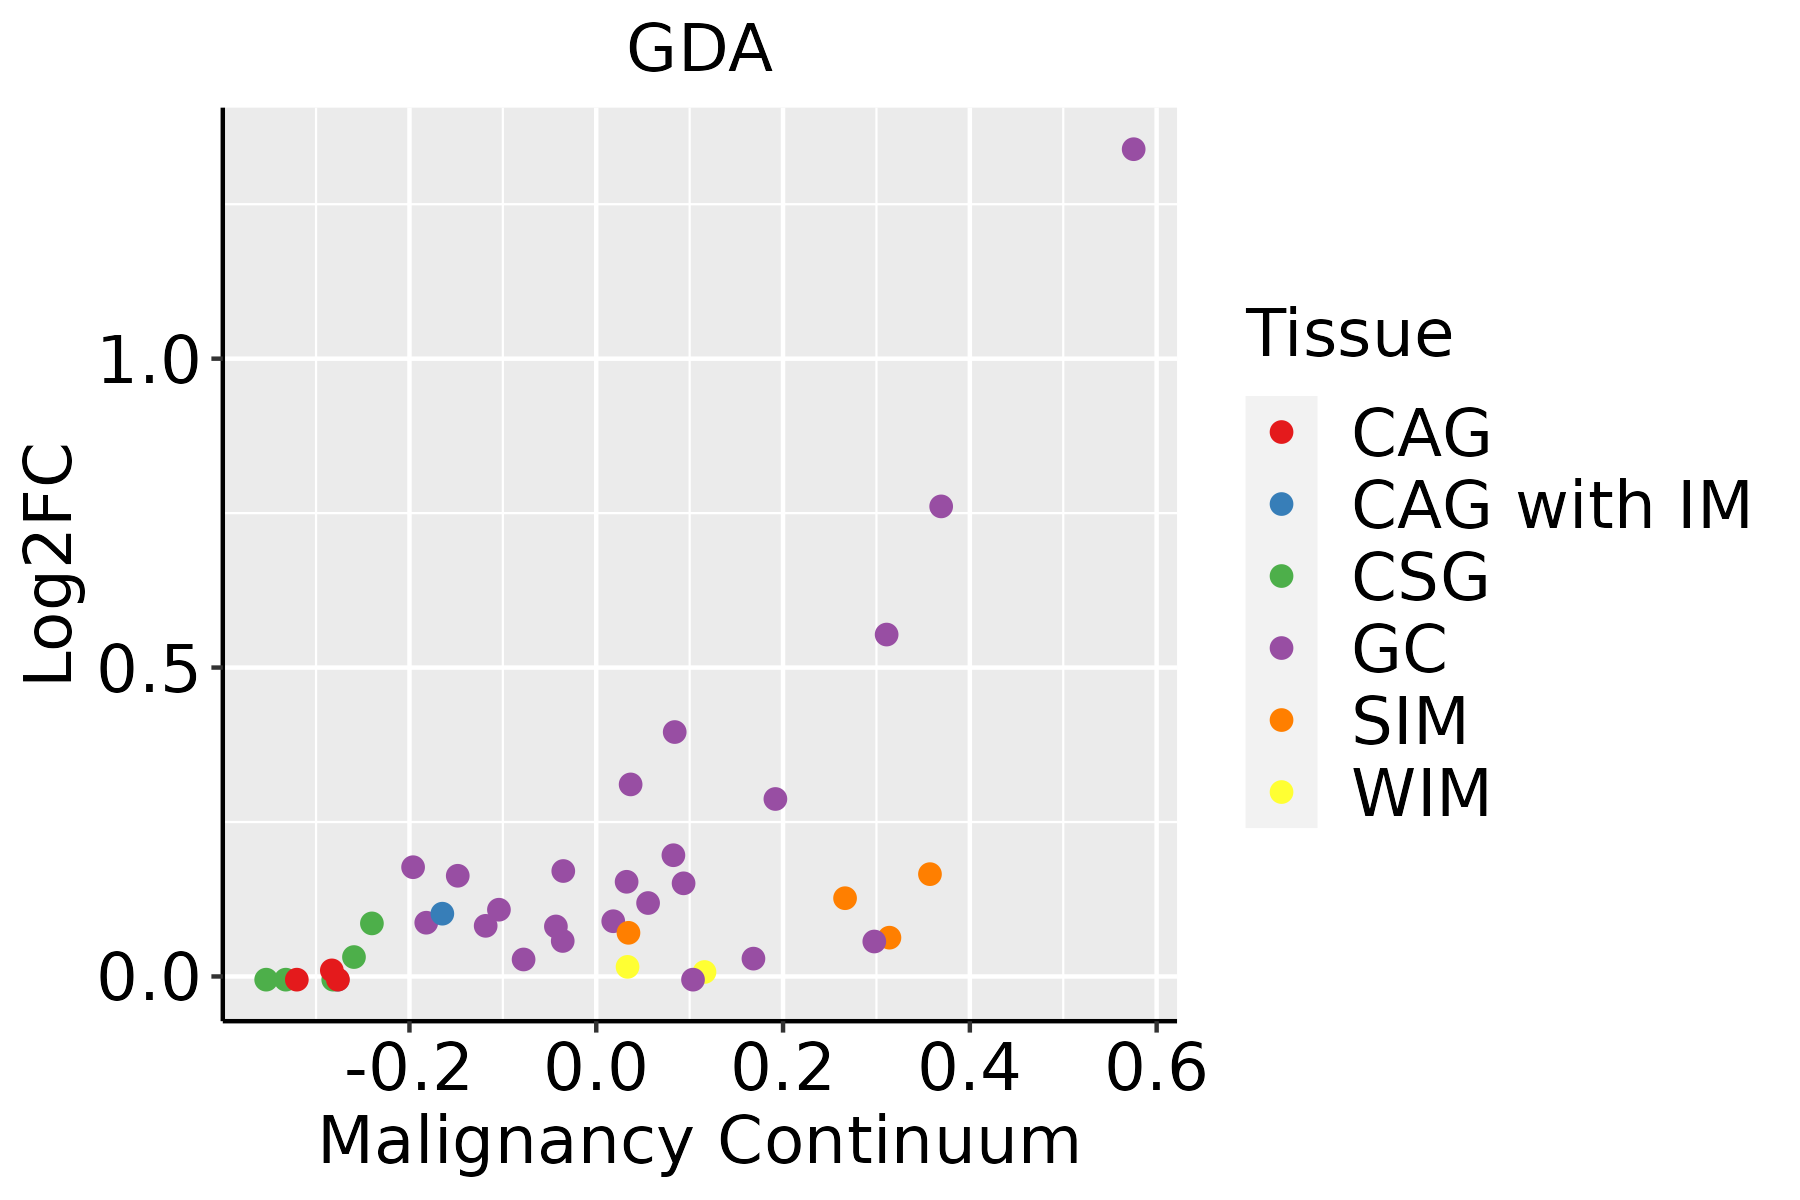 | CAG: Chronic atrophic gastritis |
| CAG with IM: Chronic atrophic gastritis with intestinal metaplasia | ||
| CSG: Chronic superficial gastritis | ||
| GC: Gastric cancer | ||
| SIM: Severe intestinal metaplasia | ||
| WIM: Wild intestinal metaplasia | ||
| Liver | 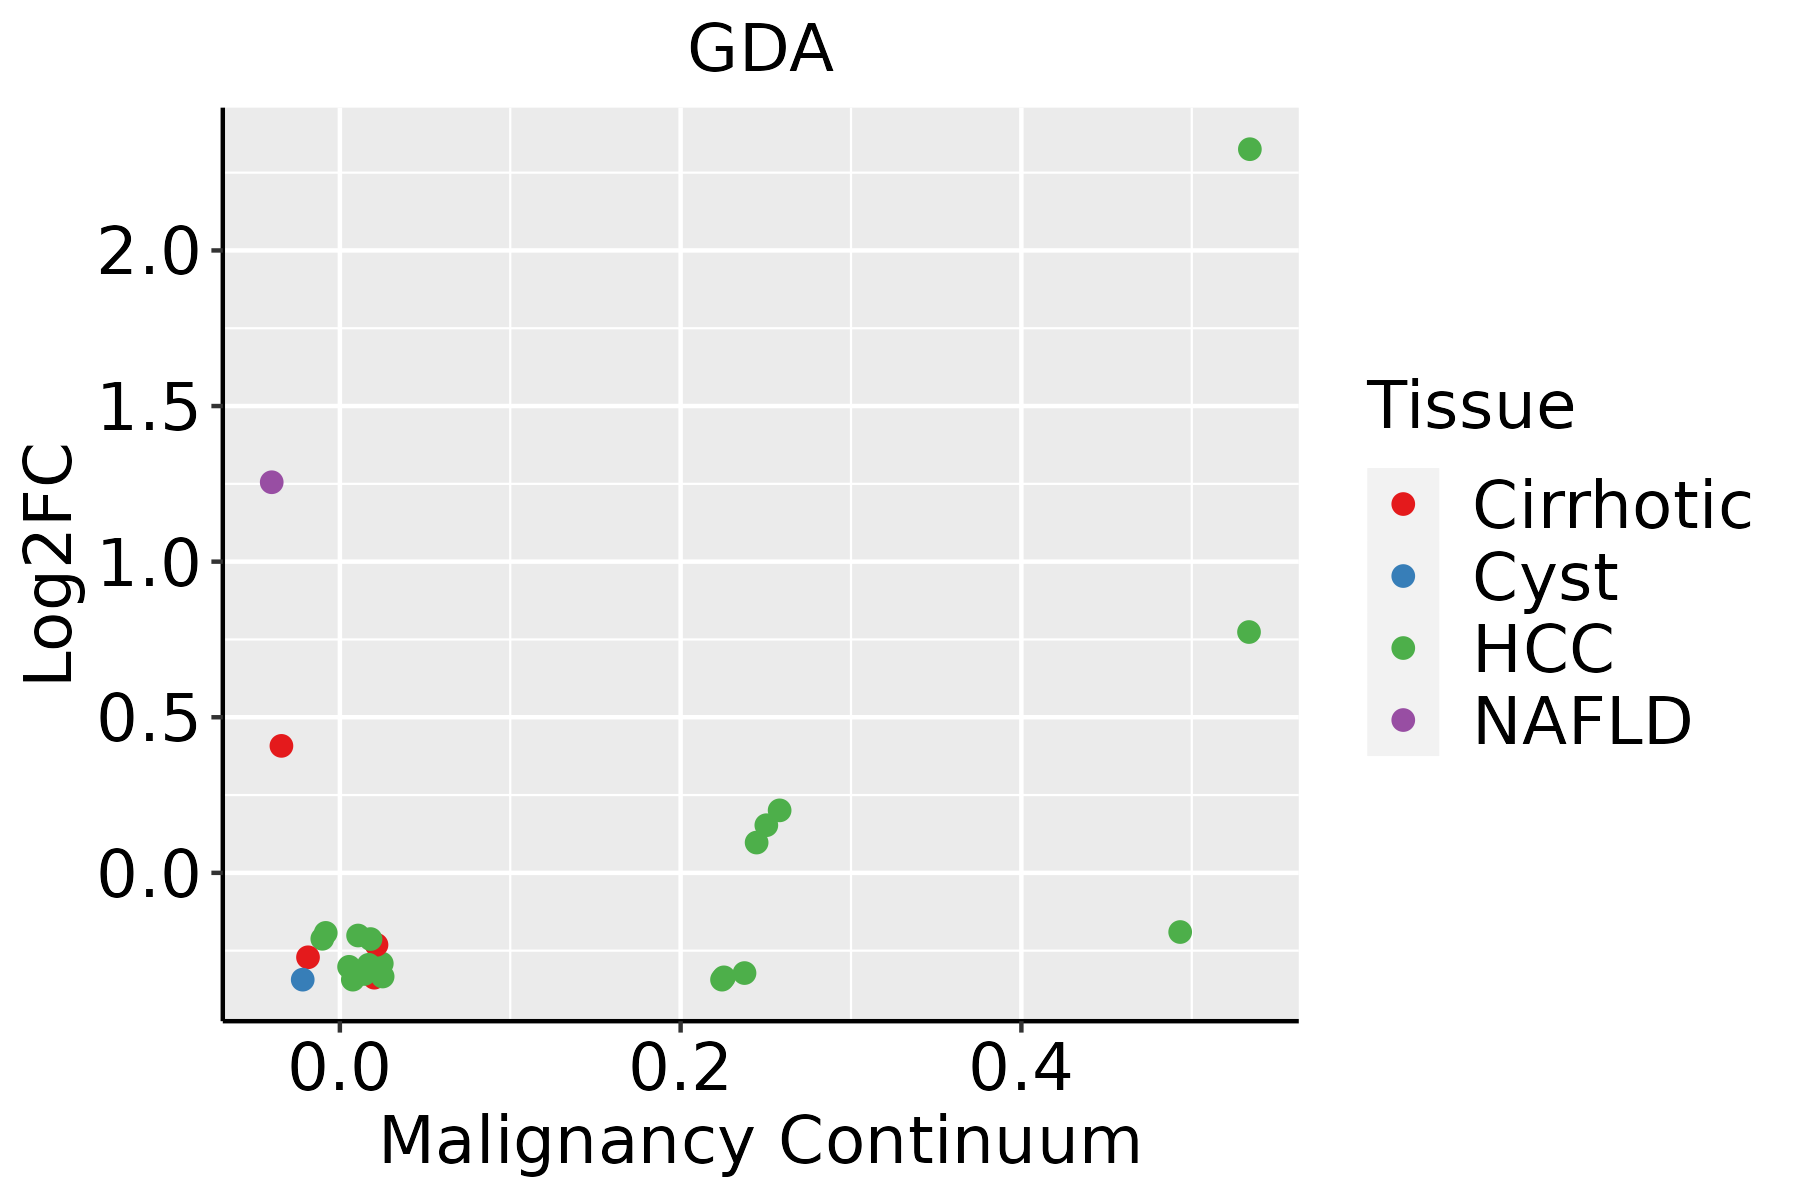 | HCC: Hepatocellular carcinoma |
| NAFLD: Non-alcoholic fatty liver disease |
| ∗log2FC in expression of this searched gene in stem-like cells from each diseased tissue sample relative to stem-like cells in normal samples in each tissue plotted against the malignancy continuum. Samples are colored based on if they are from different disease stage. |
Top |
Malignant transformation related pathway analysis |
| Find out the enriched GO biological processes and KEGG pathways involved in transition from healthy to precancer to cancer |
| Tissue | Disease Stage | Enriched GO biological Processes |
| Colorectum | AD |  |
| Colorectum | SER |  |
| Colorectum | MSS |  |
| Colorectum | MSI-H |  |
| Colorectum | FAP |  |
| ∗Top 15 enriched GO BP terms are showed in the bar plot of each disease state in each tissue. Each row represents a significant GO biological process which is colored according to the -log10(p.adjust). |
| Page: 1 2 3 4 5 6 7 8 9 |
| GO ID | Tissue | Disease Stage | Description | Gene Ratio | Bg Ratio | pvalue | p.adjust | Count |
| GO:00091251 | Liver | Cirrhotic | nucleoside monophosphate catabolic process | 11/4634 | 18/18723 | 1.13e-03 | 7.73e-03 | 11 |
| GO:00091581 | Liver | Cirrhotic | ribonucleoside monophosphate catabolic process | 9/4634 | 14/18723 | 1.99e-03 | 1.23e-02 | 9 |
| GO:0009159 | Liver | Cirrhotic | deoxyribonucleoside monophosphate catabolic process | 9/4634 | 14/18723 | 1.99e-03 | 1.23e-02 | 9 |
| GO:0042278 | Liver | Cirrhotic | purine nucleoside metabolic process | 13/4634 | 26/18723 | 4.72e-03 | 2.48e-02 | 13 |
| GO:0009116 | Liver | Cirrhotic | nucleoside metabolic process | 25/4634 | 62/18723 | 4.90e-03 | 2.56e-02 | 25 |
| GO:0009261 | Liver | Cirrhotic | ribonucleotide catabolic process | 20/4634 | 47/18723 | 5.57e-03 | 2.82e-02 | 20 |
| GO:00061442 | Liver | Cirrhotic | purine nucleobase metabolic process | 10/4634 | 19/18723 | 8.23e-03 | 3.83e-02 | 10 |
| GO:00464341 | Liver | Cirrhotic | organophosphate catabolic process | 52/4634 | 155/18723 | 8.42e-03 | 3.91e-02 | 52 |
| GO:007259422 | Liver | HCC | establishment of protein localization to organelle | 299/7958 | 422/18723 | 1.06e-32 | 6.10e-30 | 299 |
| GO:004427021 | Liver | HCC | cellular nitrogen compound catabolic process | 303/7958 | 451/18723 | 9.76e-27 | 3.64e-24 | 303 |
| GO:004670021 | Liver | HCC | heterocycle catabolic process | 299/7958 | 445/18723 | 2.07e-26 | 7.29e-24 | 299 |
| GO:190136121 | Liver | HCC | organic cyclic compound catabolic process | 325/7958 | 495/18723 | 6.52e-26 | 2.18e-23 | 325 |
| GO:001943921 | Liver | HCC | aromatic compound catabolic process | 309/7958 | 467/18723 | 1.56e-25 | 4.94e-23 | 309 |
| GO:003465521 | Liver | HCC | nucleobase-containing compound catabolic process | 273/7958 | 407/18723 | 4.84e-24 | 1.23e-21 | 273 |
| GO:000660512 | Liver | HCC | protein targeting | 219/7958 | 314/18723 | 7.74e-23 | 1.49e-20 | 219 |
| GO:000683912 | Liver | HCC | mitochondrial transport | 184/7958 | 254/18723 | 2.30e-22 | 3.83e-20 | 184 |
| GO:007265512 | Liver | HCC | establishment of protein localization to mitochondrion | 98/7958 | 120/18723 | 1.18e-18 | 1.46e-16 | 98 |
| GO:007058512 | Liver | HCC | protein localization to mitochondrion | 101/7958 | 125/18723 | 1.53e-18 | 1.86e-16 | 101 |
| GO:000911722 | Liver | HCC | nucleotide metabolic process | 300/7958 | 489/18723 | 1.61e-17 | 1.71e-15 | 300 |
| GO:000675322 | Liver | HCC | nucleoside phosphate metabolic process | 304/7958 | 497/18723 | 1.78e-17 | 1.85e-15 | 304 |
| Page: 1 2 3 4 5 6 7 8 9 10 11 12 13 |
| Pathway ID | Tissue | Disease Stage | Description | Gene Ratio | Bg Ratio | pvalue | p.adjust | qvalue | Count |
| hsa01232 | Liver | Cirrhotic | Nucleotide metabolism | 39/2530 | 85/8465 | 1.27e-03 | 6.73e-03 | 4.15e-03 | 39 |
| hsa012321 | Liver | Cirrhotic | Nucleotide metabolism | 39/2530 | 85/8465 | 1.27e-03 | 6.73e-03 | 4.15e-03 | 39 |
| hsa012322 | Liver | HCC | Nucleotide metabolism | 59/4020 | 85/8465 | 3.30e-05 | 1.88e-04 | 1.04e-04 | 59 |
| hsa012323 | Liver | HCC | Nucleotide metabolism | 59/4020 | 85/8465 | 3.30e-05 | 1.88e-04 | 1.04e-04 | 59 |
| Page: 1 |
Top |
Cell-cell communication analysis |
| Identification of potential cell-cell interactions between two cell types and their ligand-receptor pairs for different disease states |
| Ligand | Receptor | LRpair | Pathway | Tissue | Disease Stage |
| Page: 1 |
Top |
Single-cell gene regulatory network inference analysis |
| Find out the significant the regulons (TFs) and the target genes of each regulon across cell types for different disease states |
| TF | Cell Type | Tissue | Disease Stage | Target Gene | RSS | Regulon Activity |
| ∗The dot plots of a searched regulon are shown for all cell subpopulations in each disease state of each tissue based on the regulon specific score inferred using pySCENIC and by calculating the average expression. |
| Page: 1 |
Top |
Somatic mutation of malignant transformation related genes |
| Annotation of somatic variants for genes involved in malignant transformation |
| Hugo Symbol | Variant Class | Variant Classification | dbSNP RS | HGVSc | HGVSp | HGVSp Short | SWISSPROT | BIOTYPE | SIFT | PolyPhen | Tumor Sample Barcode | Tissue | Histology | Sex | Age | Stage | Therapy Types | Drugs | Outcome |
| GDA | SNV | Missense_Mutation | novel | c.311N>G | p.Thr104Ser | p.T104S | Q9Y2T3 | protein_coding | tolerated(0.24) | benign(0.001) | TCGA-A2-A0D0-01 | Breast | breast invasive carcinoma | Female | <65 | I/II | Chemotherapy | cytoxan | SD |
| GDA | SNV | Missense_Mutation | c.666N>C | p.Leu222Phe | p.L222F | Q9Y2T3 | protein_coding | deleterious(0) | possibly_damaging(0.907) | TCGA-AC-A23H-01 | Breast | breast invasive carcinoma | Female | >=65 | I/II | Unknown | Unknown | PD | |
| GDA | SNV | Missense_Mutation | novel | c.448N>C | p.Ser150Pro | p.S150P | Q9Y2T3 | protein_coding | deleterious(0.02) | possibly_damaging(0.749) | TCGA-AN-A046-01 | Breast | breast invasive carcinoma | Female | >=65 | I/II | Unknown | Unknown | SD |
| GDA | SNV | Missense_Mutation | c.352N>A | p.Asp118Asn | p.D118N | Q9Y2T3 | protein_coding | tolerated(0.11) | benign(0.006) | TCGA-EW-A1J5-01 | Breast | breast invasive carcinoma | Female | <65 | I/II | Chemotherapy | adriamycin | SD | |
| GDA | SNV | Missense_Mutation | rs748443792 | c.895N>A | p.Ala299Thr | p.A299T | Q9Y2T3 | protein_coding | tolerated(0.19) | possibly_damaging(0.446) | TCGA-2W-A8YY-01 | Cervix | cervical & endocervical cancer | Female | <65 | I/II | Chemotherapy | cisplatin | CR |
| GDA | SNV | Missense_Mutation | c.574G>A | p.Glu192Lys | p.E192K | Q9Y2T3 | protein_coding | tolerated(0.61) | benign(0.001) | TCGA-C5-A7UH-01 | Cervix | cervical & endocervical cancer | Female | <65 | III/IV | Chemotherapy | cisplatin | SD | |
| GDA | SNV | Missense_Mutation | c.361N>A | p.Glu121Lys | p.E121K | Q9Y2T3 | protein_coding | tolerated(0.39) | benign(0.023) | TCGA-EK-A2R8-01 | Cervix | cervical & endocervical cancer | Female | <65 | I/II | Unknown | Unknown | SD | |
| GDA | SNV | Missense_Mutation | c.148N>G | p.Gln50Glu | p.Q50E | Q9Y2T3 | protein_coding | tolerated(0.37) | benign(0) | TCGA-EK-A3GK-01 | Cervix | cervical & endocervical cancer | Female | <65 | I/II | Unknown | Unknown | SD | |
| GDA | SNV | Missense_Mutation | c.738N>G | p.Asp246Glu | p.D246E | Q9Y2T3 | protein_coding | tolerated(0.69) | benign(0) | TCGA-CM-6676-01 | Colorectum | colon adenocarcinoma | Male | >=65 | I/II | Unknown | Unknown | SD | |
| GDA | SNV | Missense_Mutation | c.74C>A | p.Pro25His | p.P25H | Q9Y2T3 | protein_coding | tolerated(0.22) | benign(0.029) | TCGA-G4-6309-01 | Colorectum | colon adenocarcinoma | Female | <65 | III/IV | Chemotherapy | xeloda | PD |
| Page: 1 2 3 4 5 6 7 |
Top |
Related drugs of malignant transformation related genes |
| Identification of chemicals and drugs interact with genes involved in malignant transfromation |
| (DGIdb 4.0) |
| Entrez ID | Symbol | Category | Interaction Types | Drug Claim Name | Drug Name | PMIDs |
| 9615 | GDA | ENZYME | NSC-7861 | 7-METHYLXANTHINE | 20716488 | |
| 9615 | GDA | ENZYME | 8-AZAGUANINE | 8-AZAGUANINE | 7384171 | |
| 9615 | GDA | ENZYME | THIOGUANINE | THIOGUANINE | 7384171 |
| Page: 1 |

Copyright 2023-Present -The University of Texas Health Science Center at Houston |