Schematic overview of the cellular and molecular mechanisms involved in the cancer progression, including the proposed cellular and molecular mechanisms in cancer cells trajectory. AT1: alveolar type 1 cells; AT2: alveolar type 2 cells; AAH: atypical adenomatous hyperplasia; AIS: adenocarcinoma in situ; MIA: minimally invasive adenocarcinoma; IA: invasive adenocarcinoma; EMT: epithelial-mesenchymal transition

Home

Download

Statistics

Help

Contact

Center for Computational Systems Medicine
leaf

Gene summary

leaf

Malignant transformation analysis

leaf

Malignant transformation related pathway analysis

leaf

Cell-cell communication analysis

leaf

Single-cell gene regulatory network inference analysis

leaf

Somatic mutation of malignant transformation related genes

leaf

Related drugs of malignant transformation related genes

Gene: FXR1

Gene summary for FXR1

check button Gene summary.

Gene informationSpeciesHuman
Gene symbol

FXR1

Gene ID

8087

Gene nameFMR1 autosomal homolog 1
Gene AliasFXR1P
Cytomap3q26.33
Gene Typeprotein-coding
GO ID

GO:0000375

UniProtAcc

P51114


Top

Malignant transformation analysis

check button Identification of the aberrant gene expression in precancerous and cancerous lesions by comparing the gene expression of stem-like cells in diseased tissues with normal stem cells
check button Malignant transformation involving gene list.
Entrez IDSymbolReplicatesSpeciesOrganTissueAdj P-valueLog2FCMalignancy
8087FXR1LZE2THumanEsophagusESCC1.92e-061.61e+000.082
8087FXR1LZE4THumanEsophagusESCC2.34e-361.39e+000.0811
8087FXR1LZE7THumanEsophagusESCC3.66e-088.70e-010.0667
8087FXR1LZE8THumanEsophagusESCC7.71e-114.14e-010.067
8087FXR1LZE20THumanEsophagusESCC1.69e-113.42e-010.0662
8087FXR1LZE22D1HumanEsophagusHGIN9.92e-069.40e-020.0595
8087FXR1LZE22THumanEsophagusESCC5.04e-036.67e-010.068
8087FXR1LZE24THumanEsophagusESCC9.08e-241.07e+000.0596
8087FXR1LZE21THumanEsophagusESCC2.03e-101.28e+000.0655
8087FXR1LZE6THumanEsophagusESCC7.85e-047.11e-010.0845
8087FXR1P1T-EHumanEsophagusESCC2.92e-069.35e-010.0875
8087FXR1P2T-EHumanEsophagusESCC2.82e-891.97e+000.1177
8087FXR1P4T-EHumanEsophagusESCC2.33e-581.52e+000.1323
8087FXR1P5T-EHumanEsophagusESCC4.16e-621.59e+000.1327
8087FXR1P8T-EHumanEsophagusESCC1.70e-349.88e-010.0889
8087FXR1P9T-EHumanEsophagusESCC2.54e-341.03e+000.1131
8087FXR1P10T-EHumanEsophagusESCC1.34e-581.23e+000.116
8087FXR1P11T-EHumanEsophagusESCC2.04e-241.35e+000.1426
8087FXR1P12T-EHumanEsophagusESCC3.37e-812.19e+000.1122
8087FXR1P15T-EHumanEsophagusESCC6.40e-682.00e+000.1149
Page: 1 2 3 4 5 6 7 8 

check button Transcriptomic changes along malignancy continuum.
TissueExpression DynamicsAbbreviation
EsophagusThe image shows the transcriptomic changes along malignancy continuum.log2FC in expression of this searched gene in stem-like cells from each diseased tissue sample relative to stem-like cells in normal samples in each tissue plotted against the malignancy continuum. Samples are colored based on if they are from different disease stage.
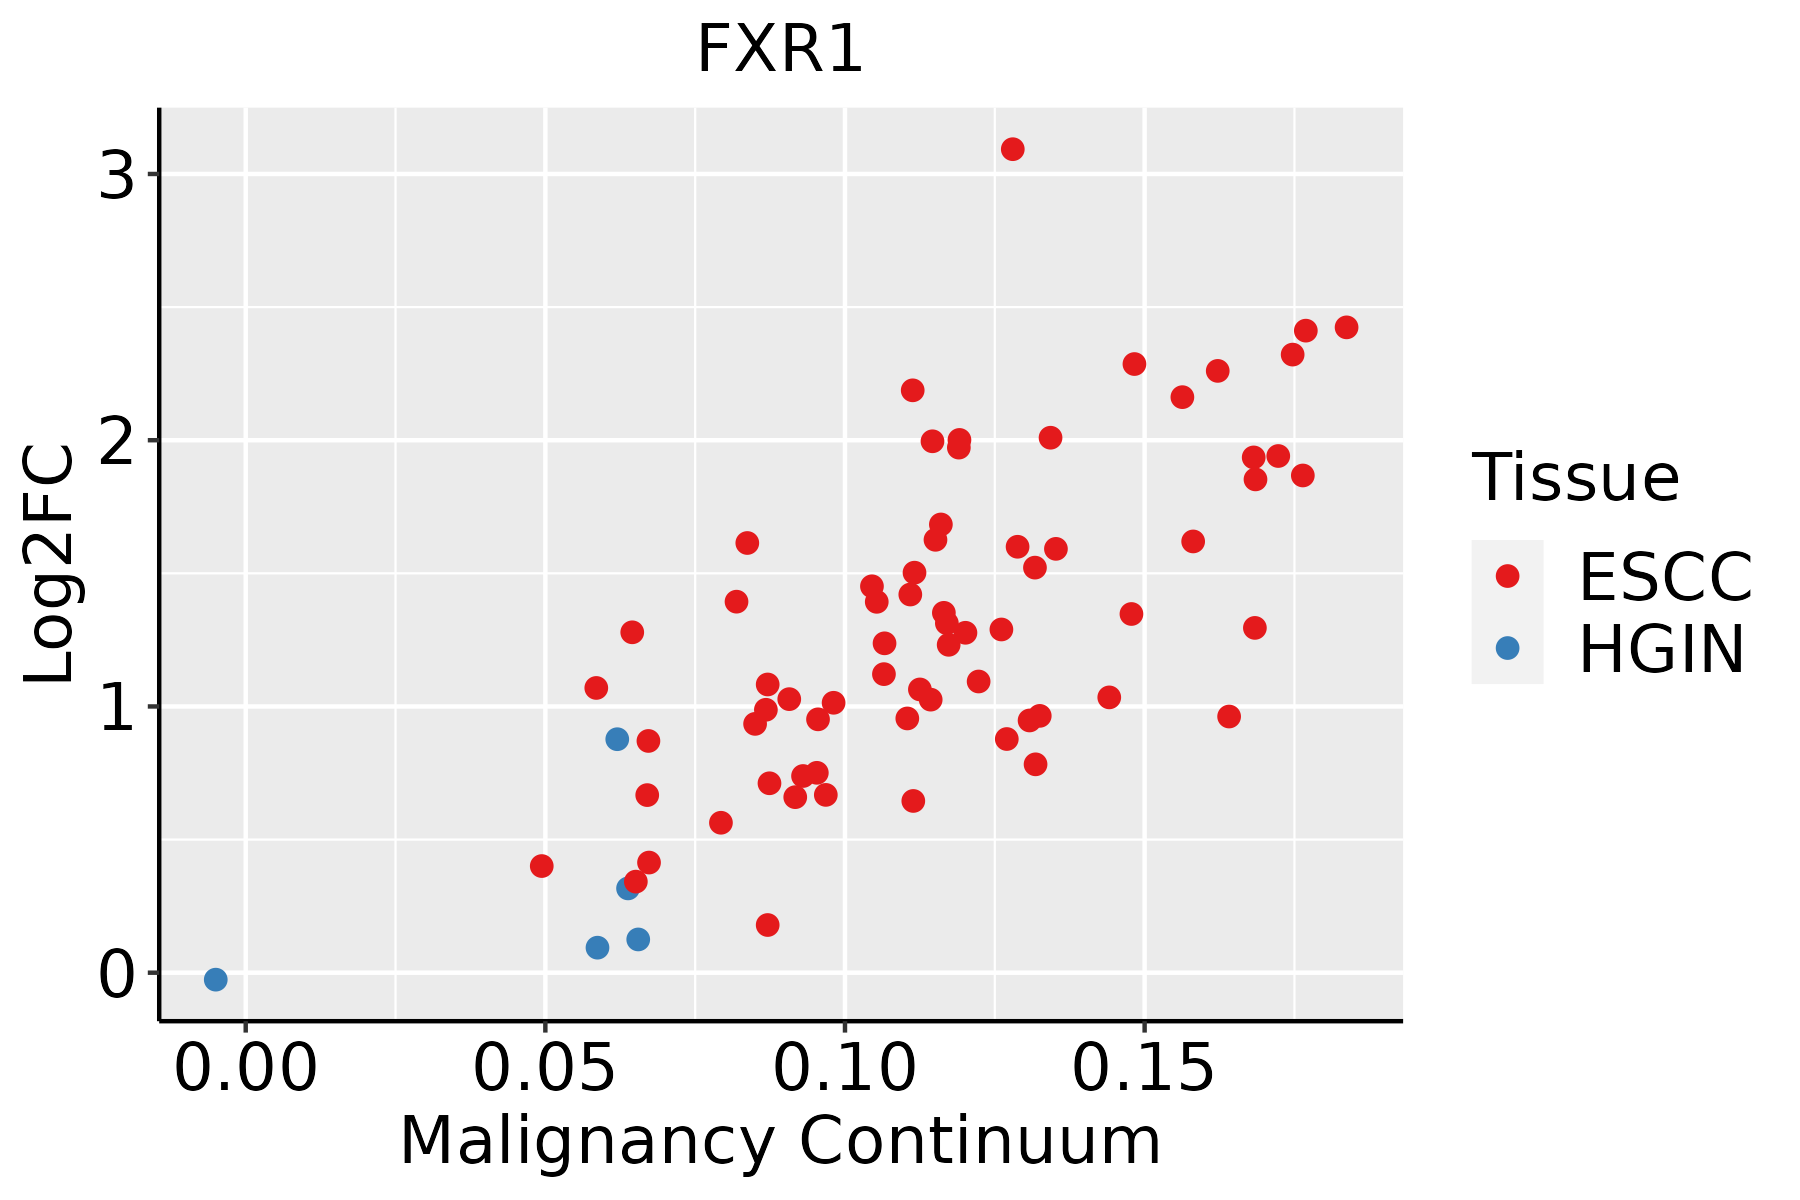
ESCC: Esophageal squamous cell carcinoma
HGIN: High-grade intraepithelial neoplasias
LGIN: Low-grade intraepithelial neoplasias
LiverThe image shows the transcriptomic changes along malignancy continuum.log2FC in expression of this searched gene in stem-like cells from each diseased tissue sample relative to stem-like cells in normal samples in each tissue plotted against the malignancy continuum. Samples are colored based on if they are from different disease stage.HCC: Hepatocellular carcinoma
NAFLD: Non-alcoholic fatty liver disease
Oral CavityThe image shows the transcriptomic changes along malignancy continuum.log2FC in expression of this searched gene in stem-like cells from each diseased tissue sample relative to stem-like cells in normal samples in each tissue plotted against the malignancy continuum. Samples are colored based on if they are from different disease stage.EOLP: Erosive Oral lichen planus
LP: leukoplakia
NEOLP: Non-erosive oral lichen planus
OSCC: Oral squamous cell carcinoma
ProstateThe image shows the transcriptomic changes along malignancy continuum.log2FC in expression of this searched gene in stem-like cells from each diseased tissue sample relative to stem-like cells in normal samples in each tissue plotted against the malignancy continuum. Samples are colored based on if they are from different disease stage.
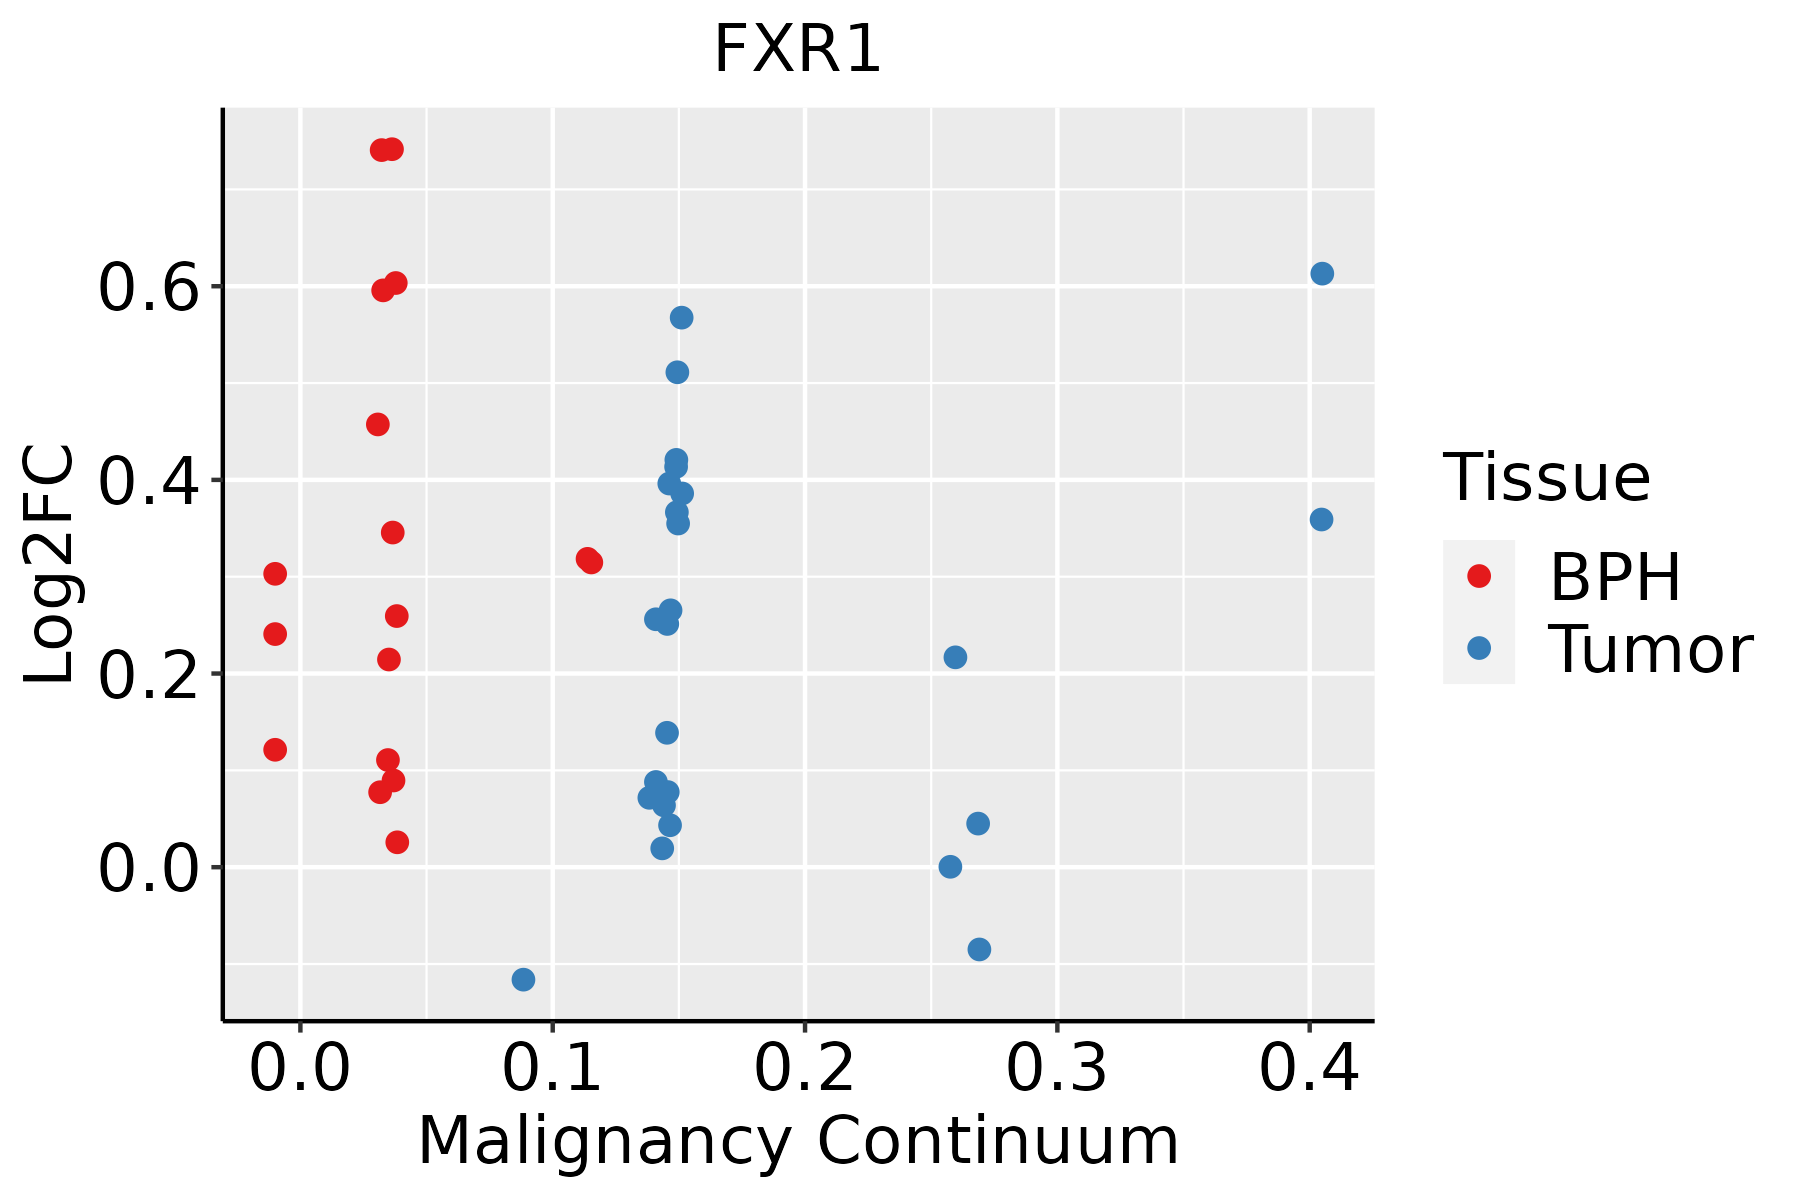
BPH: Benign Prostatic Hyperplasia
SkinThe image shows the transcriptomic changes along malignancy continuum.log2FC in expression of this searched gene in stem-like cells from each diseased tissue sample relative to stem-like cells in normal samples in each tissue plotted against the malignancy continuum. Samples are colored based on if they are from different disease stage.
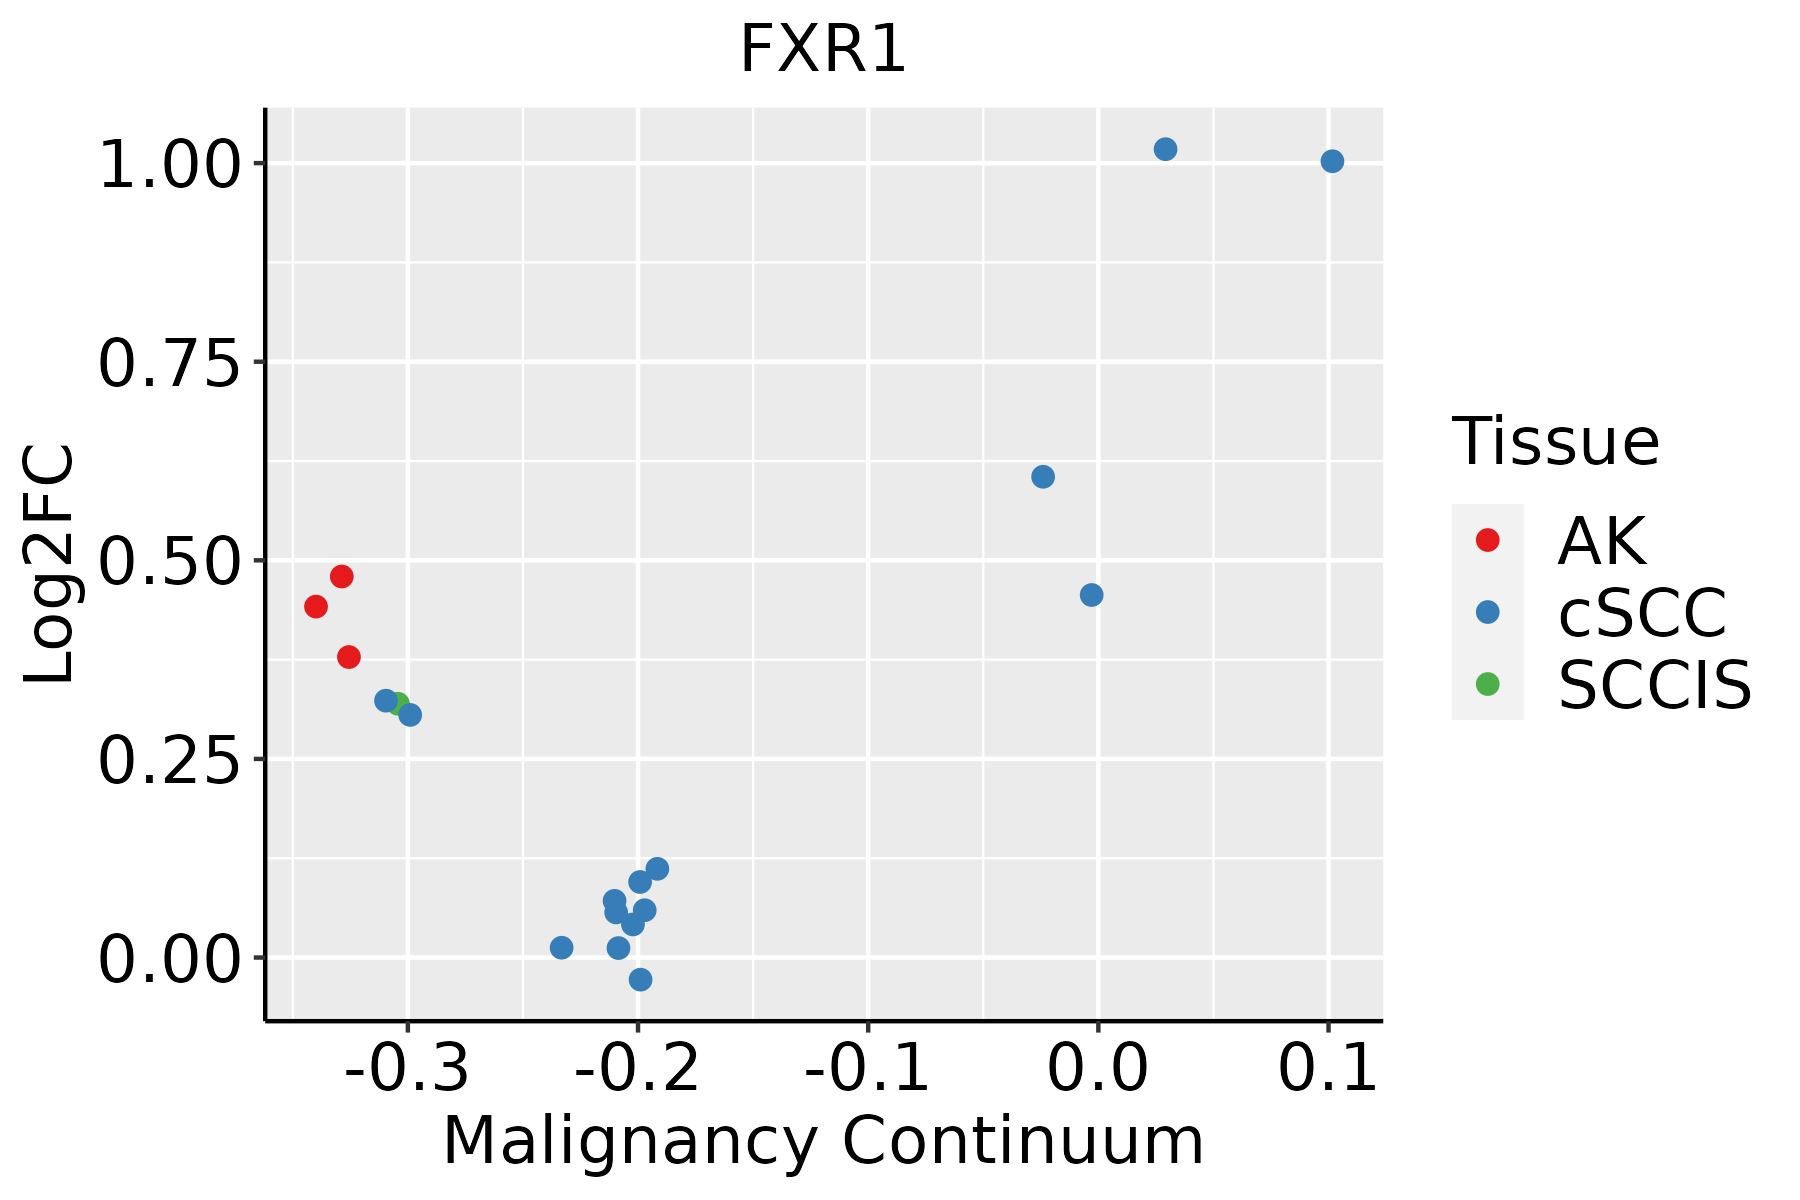
AK: Actinic keratosis
cSCC: Cutaneous squamous cell carcinoma
SCCIS:squamous cell carcinoma in situ
ThyroidThe image shows the transcriptomic changes along malignancy continuum.log2FC in expression of this searched gene in stem-like cells from each diseased tissue sample relative to stem-like cells in normal samples in each tissue plotted against the malignancy continuum. Samples are colored based on if they are from different disease stage.
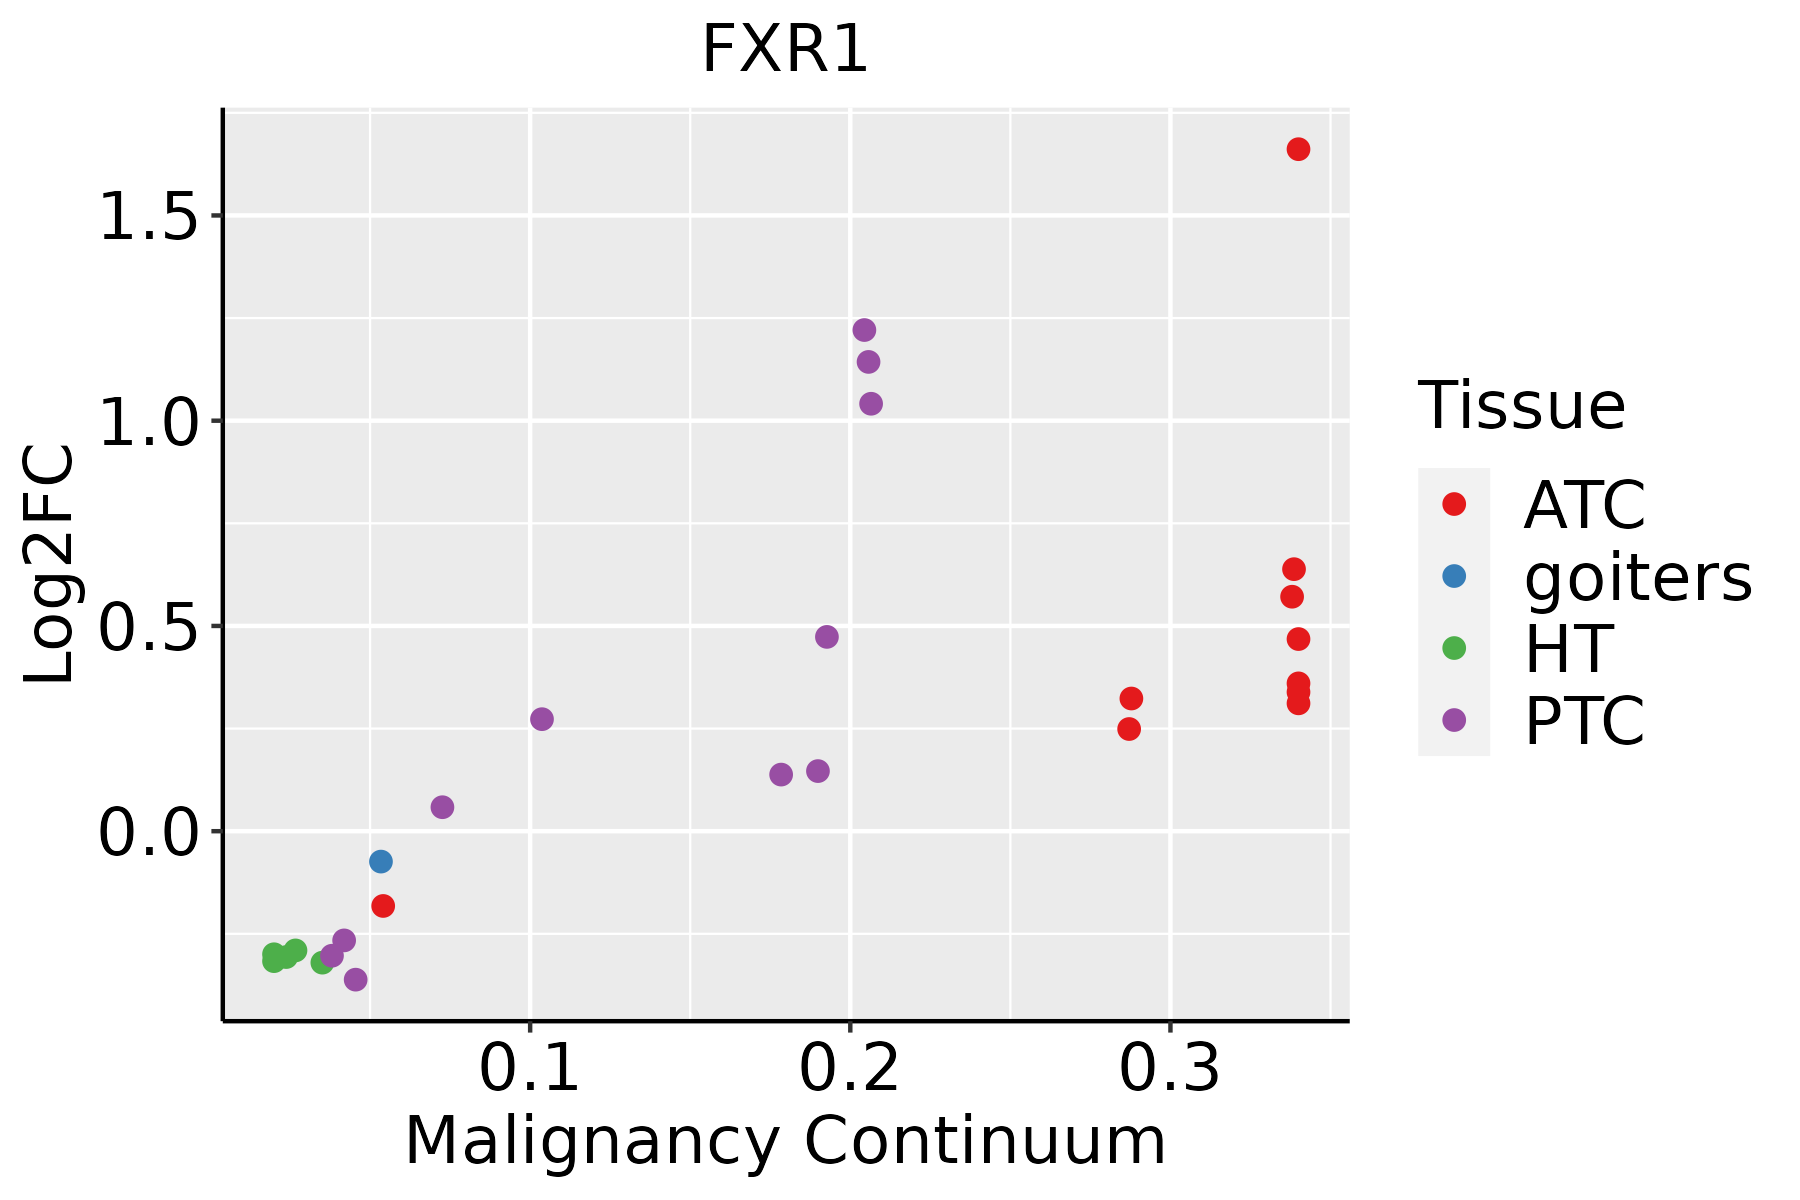
ATC: Anaplastic thyroid cancer
HT: Hashimoto's thyroiditis
PTC: Papillary thyroid cancer
∗log2FC in expression of this searched gene in stem-like cells from each diseased tissue sample relative to stem-like cells in normal samples in each tissue plotted against the malignancy continuum. Samples are colored based on if they are from different disease stage.

Top

Malignant transformation related pathway analysis

check buttonFind out the enriched GO biological processes and KEGG pathways involved in transition from healthy to precancer to cancer
check button Figure of enriched GO biological processes.
TissueDisease StageEnriched GO biological Processes
ColorectumADGO analysis - Figure of enriched GO biological processes: Top 15 enriched GO BP terms are showed in the bar plot of each disease state in each tissue. Each row represents a significant GO biological process which is colored according to the -log10(p.adjust).
ColorectumSERGO analysis - Figure of enriched GO biological processes: Top 15 enriched GO BP terms are showed in the bar plot of each disease state in each tissue. Each row represents a significant GO biological process which is colored according to the -log10(p.adjust).
ColorectumMSSGO analysis - Figure of enriched GO biological processes: Top 15 enriched GO BP terms are showed in the bar plot of each disease state in each tissue. Each row represents a significant GO biological process which is colored according to the -log10(p.adjust).
ColorectumMSI-HGO analysis - Figure of enriched GO biological processes: Top 15 enriched GO BP terms are showed in the bar plot of each disease state in each tissue. Each row represents a significant GO biological process which is colored according to the -log10(p.adjust).
ColorectumFAPGO analysis - Figure of enriched GO biological processes: Top 15 enriched GO BP terms are showed in the bar plot of each disease state in each tissue. Each row represents a significant GO biological process which is colored according to the -log10(p.adjust).
∗Top 15 enriched GO BP terms are showed in the bar plot of each disease state in each tissue. Each row represents a significant GO biological process which is colored according to the -log10(p.adjust).
Page: 1 2 3 4 5 6 7 8 9 

check button Enriched GO biological processes.
GO IDTissueDisease StageDescriptionGene RatioBg Ratiopvaluep.adjustCount
GO:004572725Oral cavityEOLPpositive regulation of translation41/2218136/187238.44e-094.18e-0741
GO:004670023Oral cavityEOLPheterocycle catabolic process93/2218445/187232.61e-081.08e-0693
GO:004427023Oral cavityEOLPcellular nitrogen compound catabolic process92/2218451/187231.01e-073.45e-0692
GO:000038124Oral cavityEOLPregulation of alternative mRNA splicing, via spliceosome23/221860/187231.28e-074.22e-0623
GO:001943923Oral cavityEOLParomatic compound catabolic process92/2218467/187235.23e-071.40e-0592
GO:190136123Oral cavityEOLPorganic cyclic compound catabolic process95/2218495/187231.15e-062.80e-0595
GO:001714813Oral cavityEOLPnegative regulation of translation54/2218245/187234.15e-068.72e-0554
GO:003424913Oral cavityEOLPnegative regulation of cellular amide metabolic process58/2218273/187236.23e-061.22e-0458
GO:200102024Oral cavityEOLPregulation of response to DNA damage stimulus47/2218219/187233.47e-054.85e-0447
GO:006096422Oral cavityEOLPregulation of gene silencing by miRNA15/221849/187233.73e-043.38e-0315
GO:200063723Oral cavityEOLPpositive regulation of gene silencing by miRNA11/221830/187233.99e-043.56e-0311
GO:00605384Oral cavityEOLPskeletal muscle organ development35/2218166/187234.65e-044.08e-0335
GO:006014822Oral cavityEOLPpositive regulation of posttranscriptional gene silencing11/221831/187235.53e-044.71e-0311
GO:006049122Oral cavityEOLPregulation of cell projection assembly38/2218188/187236.49e-045.42e-0338
GO:006014723Oral cavityEOLPregulation of posttranscriptional gene silencing15/221852/187237.52e-046.05e-0315
GO:006096623Oral cavityEOLPregulation of gene silencing by RNA15/221853/187239.35e-047.11e-0315
GO:006096813Oral cavityEOLPregulation of gene silencing20/221881/187239.93e-047.46e-0320
GO:012003222Oral cavityEOLPregulation of plasma membrane bounded cell projection assembly37/2218186/187231.03e-037.64e-0337
GO:00075176Oral cavityEOLPmuscle organ development57/2218327/187231.76e-031.15e-0257
GO:200102213Oral cavityEOLPpositive regulation of response to DNA damage stimulus23/2218105/187232.44e-031.49e-0223
Page: 1 2 3 4 5 6 7 8 9 10 11 12 13 14 15 16 17 18 19 20 21 22 23 24 25 

check button Enriched KEGG pathways.
Pathway IDTissueDisease StageDescriptionGene RatioBg Ratiopvaluep.adjustqvalueCount
Page: 1 

Top

Cell-cell communication analysis

check buttonIdentification of potential cell-cell interactions between two cell types and their ligand-receptor pairs for different disease states
LigandReceptorLRpairPathwayTissueDisease Stage
Page: 1 

Top

Single-cell gene regulatory network inference analysis

check buttonFind out the significant the regulons (TFs) and the target genes of each regulon across cell types for different disease states
TFCell TypeTissueDisease StageTarget GeneRSSRegulon Activity
∗The dot plots of a searched regulon are shown for all cell subpopulations in each disease state of each tissue based on the regulon specific score inferred using pySCENIC and by calculating the average expression.
Page: 1 

Top

Somatic mutation of malignant transformation related genes

check buttonAnnotation of somatic variants for genes involved in malignant transformation
Hugo SymbolVariant ClassVariant ClassificationdbSNP RSHGVScHGVSpHGVSp ShortSWISSPROTBIOTYPESIFTPolyPhenTumor Sample BarcodeTissueHistologySexAgeStageTherapy TypesDrugsOutcome
FXR1SNVMissense_Mutationc.1837N>Cp.Glu613Glnp.E613QP51114protein_codingtolerated_low_confidence(0.55)benign(0.043)TCGA-A2-A0CX-01Breastbreast invasive carcinomaFemale<65I/IIChemotherapyadriamycinSD
FXR1SNVMissense_Mutationc.1628N>Ap.Arg543Lysp.R543KP51114protein_codingdeleterious_low_confidence(0)possibly_damaging(0.899)TCGA-AC-A23H-01Breastbreast invasive carcinomaFemale>=65I/IIUnknownUnknownPD
FXR1SNVMissense_Mutationc.916N>Cp.Glu306Glnp.E306QP51114protein_codingdeleterious(0)probably_damaging(0.98)TCGA-AO-A0J6-01Breastbreast invasive carcinomaFemale<65I/IIChemotherapydoxorubicinSD
FXR1SNVMissense_Mutationrs755691527c.786N>Ap.Phe262Leup.F262LP51114protein_codingdeleterious(0.01)probably_damaging(0.966)TCGA-AR-A0U0-01Breastbreast invasive carcinomaFemale>=65I/IIUnknownUnknownSD
FXR1SNVMissense_Mutationc.1094N>Cp.Arg365Thrp.R365TP51114protein_codingtolerated(0.06)benign(0.432)TCGA-E9-A1N4-01Breastbreast invasive carcinomaFemale<65III/IVChemotherapydoxorubicinSD
FXR1SNVMissense_Mutationnovelc.754G>Ap.Ala252Thrp.A252TP51114protein_codingtolerated(0.12)benign(0.003)TCGA-2W-A8YY-01Cervixcervical & endocervical cancerFemale<65I/IIChemotherapycisplatinCR
FXR1SNVMissense_Mutationrs371485992c.1298G>Ap.Arg433Glnp.R433QP51114protein_codingtolerated(0.22)probably_damaging(0.968)TCGA-2W-A8YY-01Cervixcervical & endocervical cancerFemale<65I/IIChemotherapycisplatinCR
FXR1SNVMissense_Mutationrs751470533c.1765G>Ap.Asp589Asnp.D589NP51114protein_codingdeleterious_low_confidence(0.04)benign(0.001)TCGA-2W-A8YY-01Cervixcervical & endocervical cancerFemale<65I/IIChemotherapycisplatinCR
FXR1SNVMissense_Mutationc.298N>Cp.Asp100Hisp.D100HP51114protein_codingdeleterious(0)possibly_damaging(0.813)TCGA-C5-A1M5-01Cervixcervical & endocervical cancerFemale<65I/IIUnknownUnknownPD
FXR1SNVMissense_Mutationc.411N>Cp.Leu137Phep.L137FP51114protein_codingdeleterious(0)probably_damaging(0.991)TCGA-JW-A5VL-01Cervixcervical & endocervical cancerFemale<65I/IIUnknownUnknownSD
Page: 1 2 3 4 5 6 7 8 9 10 

Top

Related drugs of malignant transformation related genes

check buttonIdentification of chemicals and drugs interact with genes involved in malignant transfromation
(DGIdb 4.0)
Entrez IDSymbolCategoryInteraction TypesDrug Claim NameDrug NamePMIDs
Page: 1