
|
|||||
|
 | |
| |
| |
| |
| |
| |
|
Gene: FBXO3 |
Gene summary for FBXO3 |
| Gene information | Species | Human | Gene symbol | FBXO3 | Gene ID | 26273 |
| Gene name | F-box protein 3 | |
| Gene Alias | FBA | |
| Cytomap | 11p13 | |
| Gene Type | protein-coding | GO ID | GO:0006464 | UniProtAcc | Q49AF1 |
Top |
Malignant transformation analysis |
| Identification of the aberrant gene expression in precancerous and cancerous lesions by comparing the gene expression of stem-like cells in diseased tissues with normal stem cells |
| Entrez ID | Symbol | Replicates | Species | Organ | Tissue | Adj P-value | Log2FC | Malignancy |
| 26273 | FBXO3 | LZE3D | Human | Esophagus | HGIN | 3.90e-03 | 6.34e-01 | 0.0668 |
| 26273 | FBXO3 | LZE4T | Human | Esophagus | ESCC | 3.00e-09 | 3.26e-01 | 0.0811 |
| 26273 | FBXO3 | LZE7T | Human | Esophagus | ESCC | 4.84e-04 | 2.36e-01 | 0.0667 |
| 26273 | FBXO3 | LZE8T | Human | Esophagus | ESCC | 8.73e-07 | 1.86e-01 | 0.067 |
| 26273 | FBXO3 | LZE20T | Human | Esophagus | ESCC | 1.52e-04 | 3.31e-02 | 0.0662 |
| 26273 | FBXO3 | LZE24T | Human | Esophagus | ESCC | 3.13e-16 | 2.84e-01 | 0.0596 |
| 26273 | FBXO3 | P2T-E | Human | Esophagus | ESCC | 6.22e-16 | 2.98e-01 | 0.1177 |
| 26273 | FBXO3 | P4T-E | Human | Esophagus | ESCC | 6.01e-09 | 1.35e-01 | 0.1323 |
| 26273 | FBXO3 | P5T-E | Human | Esophagus | ESCC | 1.45e-05 | -4.58e-03 | 0.1327 |
| 26273 | FBXO3 | P8T-E | Human | Esophagus | ESCC | 1.35e-23 | 4.06e-01 | 0.0889 |
| 26273 | FBXO3 | P9T-E | Human | Esophagus | ESCC | 1.32e-05 | 1.47e-01 | 0.1131 |
| 26273 | FBXO3 | P10T-E | Human | Esophagus | ESCC | 3.40e-22 | 2.80e-01 | 0.116 |
| 26273 | FBXO3 | P11T-E | Human | Esophagus | ESCC | 4.16e-13 | 4.76e-01 | 0.1426 |
| 26273 | FBXO3 | P12T-E | Human | Esophagus | ESCC | 1.44e-23 | 4.33e-01 | 0.1122 |
| 26273 | FBXO3 | P15T-E | Human | Esophagus | ESCC | 3.03e-12 | 2.93e-01 | 0.1149 |
| 26273 | FBXO3 | P16T-E | Human | Esophagus | ESCC | 8.27e-16 | 2.58e-01 | 0.1153 |
| 26273 | FBXO3 | P17T-E | Human | Esophagus | ESCC | 3.82e-05 | 1.68e-01 | 0.1278 |
| 26273 | FBXO3 | P19T-E | Human | Esophagus | ESCC | 6.17e-03 | 2.14e-01 | 0.1662 |
| 26273 | FBXO3 | P20T-E | Human | Esophagus | ESCC | 1.61e-14 | 2.37e-01 | 0.1124 |
| 26273 | FBXO3 | P21T-E | Human | Esophagus | ESCC | 7.86e-16 | 3.36e-01 | 0.1617 |
| Page: 1 2 3 4 |
| Tissue | Expression Dynamics | Abbreviation |
| Esophagus | 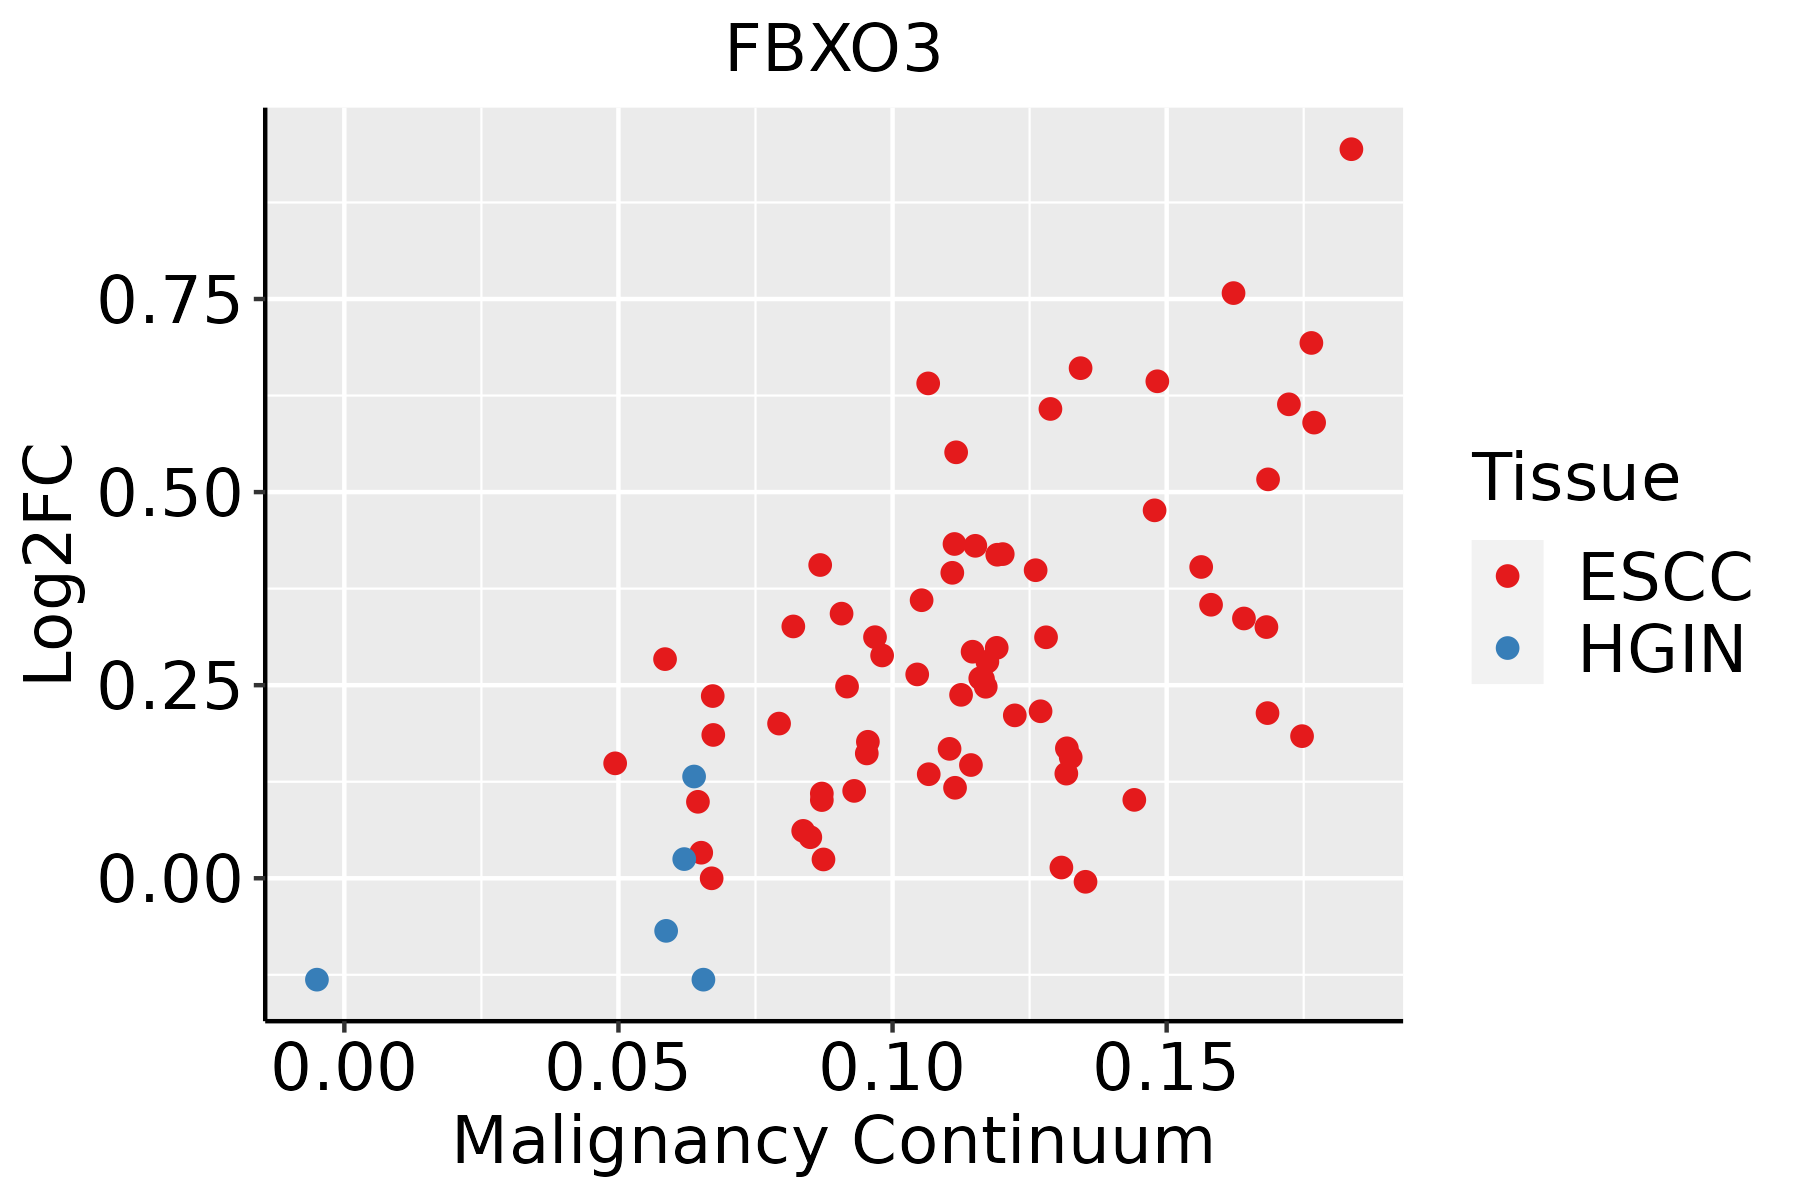 | ESCC: Esophageal squamous cell carcinoma |
| HGIN: High-grade intraepithelial neoplasias | ||
| LGIN: Low-grade intraepithelial neoplasias | ||
| Oral Cavity | 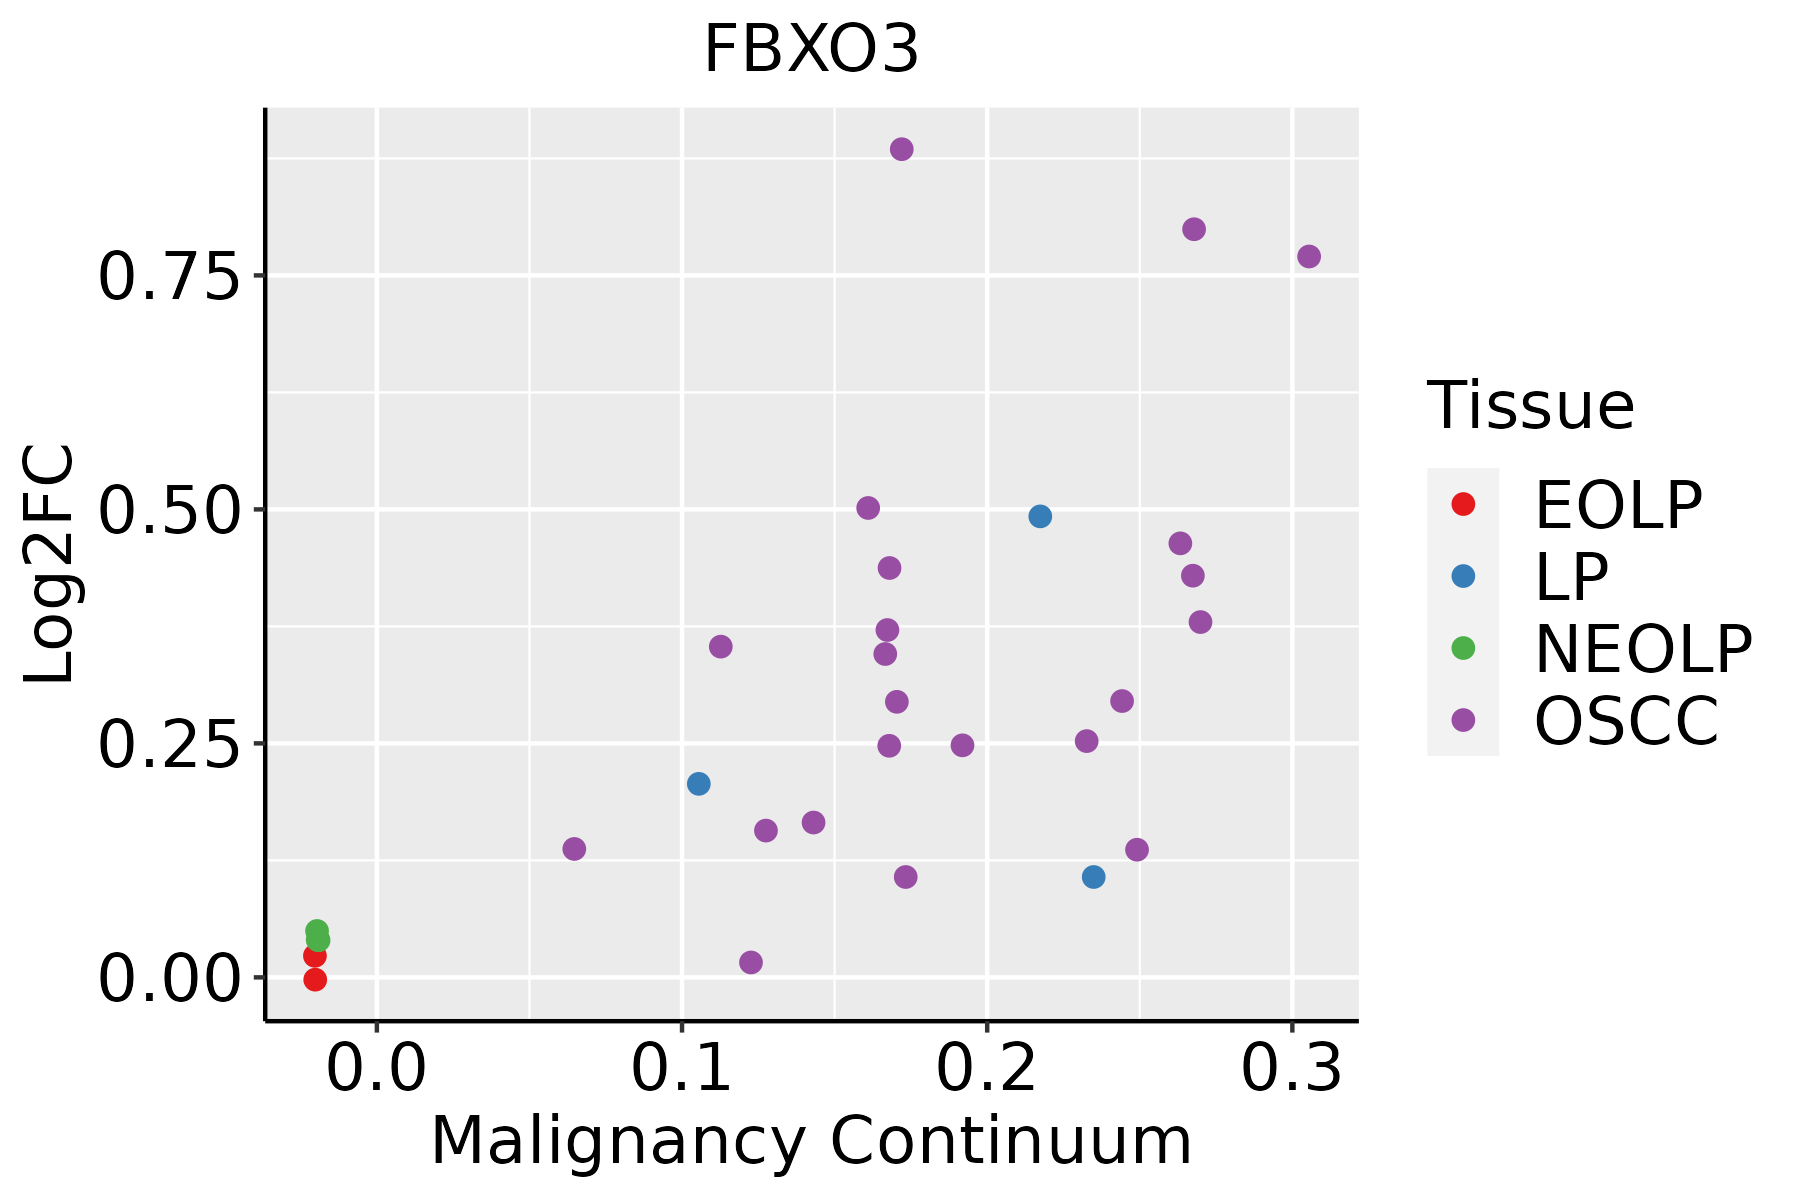 | EOLP: Erosive Oral lichen planus |
| LP: leukoplakia | ||
| NEOLP: Non-erosive oral lichen planus | ||
| OSCC: Oral squamous cell carcinoma | ||
| Skin | 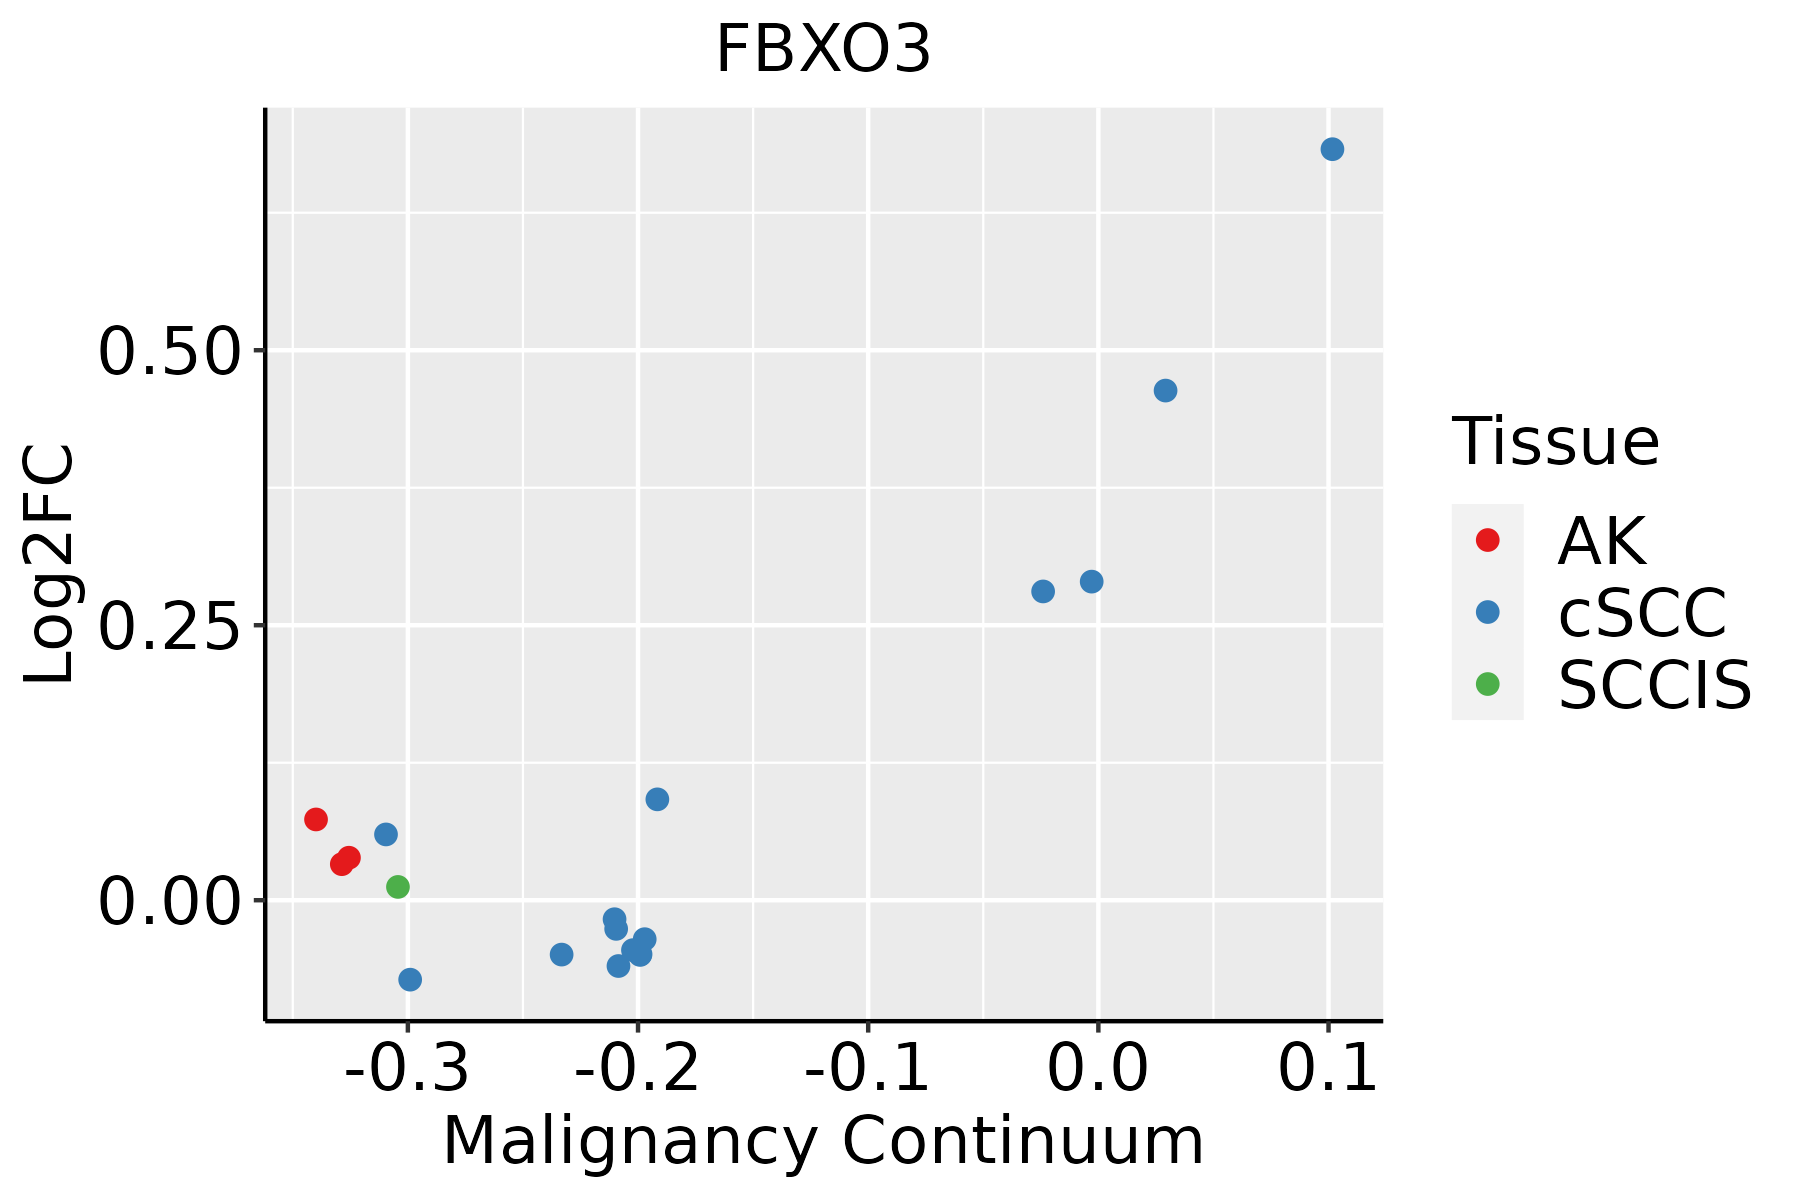 | AK: Actinic keratosis |
| cSCC: Cutaneous squamous cell carcinoma | ||
| SCCIS:squamous cell carcinoma in situ |
| ∗log2FC in expression of this searched gene in stem-like cells from each diseased tissue sample relative to stem-like cells in normal samples in each tissue plotted against the malignancy continuum. Samples are colored based on if they are from different disease stage. |
Top |
Malignant transformation related pathway analysis |
| Find out the enriched GO biological processes and KEGG pathways involved in transition from healthy to precancer to cancer |
| Tissue | Disease Stage | Enriched GO biological Processes |
| Colorectum | AD |  |
| Colorectum | SER |  |
| Colorectum | MSS |  |
| Colorectum | MSI-H |  |
| Colorectum | FAP |  |
| ∗Top 15 enriched GO BP terms are showed in the bar plot of each disease state in each tissue. Each row represents a significant GO biological process which is colored according to the -log10(p.adjust). |
| Page: 1 2 3 4 5 6 7 8 9 |
| GO ID | Tissue | Disease Stage | Description | Gene Ratio | Bg Ratio | pvalue | p.adjust | Count |
| GO:007138318 | Oral cavity | OSCC | cellular response to steroid hormone stimulus | 112/7305 | 204/18723 | 2.82e-06 | 3.47e-05 | 112 |
| GO:19016555 | Oral cavity | OSCC | cellular response to ketone | 56/7305 | 96/18723 | 9.61e-05 | 7.25e-04 | 56 |
| GO:003196018 | Oral cavity | OSCC | response to corticosteroid | 86/7305 | 167/18723 | 6.79e-04 | 3.79e-03 | 86 |
| GO:005138418 | Oral cavity | OSCC | response to glucocorticoid | 76/7305 | 148/18723 | 1.49e-03 | 7.15e-03 | 76 |
| GO:00715486 | Oral cavity | OSCC | response to dexamethasone | 23/7305 | 39/18723 | 9.09e-03 | 3.26e-02 | 23 |
| GO:00713848 | Oral cavity | OSCC | cellular response to corticosteroid stimulus | 33/7305 | 61/18723 | 1.19e-02 | 4.02e-02 | 33 |
| GO:004854518 | Prostate | BPH | response to steroid hormone | 109/3107 | 339/18723 | 9.35e-13 | 8.15e-11 | 109 |
| GO:007138316 | Prostate | BPH | cellular response to steroid hormone stimulus | 71/3107 | 204/18723 | 1.72e-10 | 9.79e-09 | 71 |
| GO:190165417 | Prostate | BPH | response to ketone | 67/3107 | 194/18723 | 8.10e-10 | 3.74e-08 | 67 |
| GO:005138416 | Prostate | BPH | response to glucocorticoid | 49/3107 | 148/18723 | 6.20e-07 | 1.21e-05 | 49 |
| GO:003196016 | Prostate | BPH | response to corticosteroid | 52/3107 | 167/18723 | 2.34e-06 | 3.81e-05 | 52 |
| GO:00713858 | Prostate | BPH | cellular response to glucocorticoid stimulus | 24/3107 | 56/18723 | 3.19e-06 | 5.02e-05 | 24 |
| GO:00713847 | Prostate | BPH | cellular response to corticosteroid stimulus | 24/3107 | 61/18723 | 1.86e-05 | 2.29e-04 | 24 |
| GO:19016554 | Prostate | BPH | cellular response to ketone | 32/3107 | 96/18723 | 4.48e-05 | 4.73e-04 | 32 |
| GO:00435025 | Prostate | BPH | regulation of muscle adaptation | 31/3107 | 98/18723 | 1.75e-04 | 1.50e-03 | 31 |
| GO:009025710 | Prostate | BPH | regulation of muscle system process | 64/3107 | 252/18723 | 2.26e-04 | 1.81e-03 | 64 |
| GO:00030127 | Prostate | BPH | muscle system process | 103/3107 | 452/18723 | 3.54e-04 | 2.62e-03 | 103 |
| GO:00435002 | Prostate | BPH | muscle adaptation | 33/3107 | 121/18723 | 2.04e-03 | 1.15e-02 | 33 |
| GO:00715485 | Prostate | BPH | response to dexamethasone | 14/3107 | 39/18723 | 2.81e-03 | 1.48e-02 | 14 |
| GO:00715495 | Prostate | BPH | cellular response to dexamethasone stimulus | 11/3107 | 29/18723 | 4.82e-03 | 2.29e-02 | 11 |
| Page: 1 2 3 4 5 6 7 8 9 10 11 12 |
| Pathway ID | Tissue | Disease Stage | Description | Gene Ratio | Bg Ratio | pvalue | p.adjust | qvalue | Count |
| Page: 1 |
Top |
Cell-cell communication analysis |
| Identification of potential cell-cell interactions between two cell types and their ligand-receptor pairs for different disease states |
| Ligand | Receptor | LRpair | Pathway | Tissue | Disease Stage |
| Page: 1 |
Top |
Single-cell gene regulatory network inference analysis |
| Find out the significant the regulons (TFs) and the target genes of each regulon across cell types for different disease states |
| TF | Cell Type | Tissue | Disease Stage | Target Gene | RSS | Regulon Activity |
| ∗The dot plots of a searched regulon are shown for all cell subpopulations in each disease state of each tissue based on the regulon specific score inferred using pySCENIC and by calculating the average expression. |
| Page: 1 |
Top |
Somatic mutation of malignant transformation related genes |
| Annotation of somatic variants for genes involved in malignant transformation |
| Hugo Symbol | Variant Class | Variant Classification | dbSNP RS | HGVSc | HGVSp | HGVSp Short | SWISSPROT | BIOTYPE | SIFT | PolyPhen | Tumor Sample Barcode | Tissue | Histology | Sex | Age | Stage | Therapy Types | Drugs | Outcome |
| FBXO3 | SNV | Missense_Mutation | c.85G>A | p.Asp29Asn | p.D29N | Q9UK99 | protein_coding | tolerated(0.29) | benign(0.137) | TCGA-A2-A0YG-01 | Breast | breast invasive carcinoma | Female | <65 | III/IV | Chemotherapy | cytoxan | SD | |
| FBXO3 | SNV | Missense_Mutation | rs757358495 | c.251C>G | p.Ser84Cys | p.S84C | Q9UK99 | protein_coding | tolerated(0.08) | benign(0.339) | TCGA-AN-A0XW-01 | Breast | breast invasive carcinoma | Female | <65 | III/IV | Unknown | Unknown | SD |
| FBXO3 | SNV | Missense_Mutation | c.55N>A | p.Asp19Asn | p.D19N | Q9UK99 | protein_coding | deleterious(0.01) | probably_damaging(0.96) | TCGA-D8-A1JA-01 | Breast | breast invasive carcinoma | Female | <65 | III/IV | Chemotherapy | adriamycin | PD | |
| FBXO3 | SNV | Missense_Mutation | c.1269G>T | p.Met423Ile | p.M423I | Q9UK99 | protein_coding | tolerated_low_confidence(0.45) | benign(0) | TCGA-C5-A1BM-01 | Cervix | cervical & endocervical cancer | Female | >=65 | I/II | Unknown | Unknown | SD | |
| FBXO3 | SNV | Missense_Mutation | novel | c.1062N>G | p.Ile354Met | p.I354M | Q9UK99 | protein_coding | deleterious(0.01) | possibly_damaging(0.837) | TCGA-DS-A1OA-01 | Cervix | cervical & endocervical cancer | Female | >=65 | I/II | Chemotherapy | carboplatin | PD |
| FBXO3 | insertion | Nonsense_Mutation | novel | c.1062_1063insTAA | p.Ile354_Ile355insTer | p.I354_I355ins* | Q9UK99 | protein_coding | TCGA-DS-A1OA-01 | Cervix | cervical & endocervical cancer | Female | >=65 | I/II | Chemotherapy | carboplatin | PD | ||
| FBXO3 | SNV | Missense_Mutation | rs138194845 | c.1406N>A | p.Arg469His | p.R469H | Q9UK99 | protein_coding | deleterious_low_confidence(0) | benign(0.001) | TCGA-AA-3672-01 | Colorectum | colon adenocarcinoma | Female | >=65 | III/IV | Unknown | Unknown | SD |
| FBXO3 | SNV | Missense_Mutation | c.312G>T | p.Lys104Asn | p.K104N | Q9UK99 | protein_coding | deleterious(0.03) | benign(0.15) | TCGA-AA-3977-01 | Colorectum | colon adenocarcinoma | Male | >=65 | I/II | Unknown | Unknown | SD | |
| FBXO3 | SNV | Missense_Mutation | novel | c.276N>G | p.His92Gln | p.H92Q | Q9UK99 | protein_coding | tolerated(0.29) | benign(0.129) | TCGA-CA-6717-01 | Colorectum | colon adenocarcinoma | Male | <65 | I/II | Chemotherapy | oxaliplatin | CR |
| FBXO3 | SNV | Missense_Mutation | c.509G>A | p.Arg170His | p.R170H | Q9UK99 | protein_coding | deleterious(0.01) | possibly_damaging(0.869) | TCGA-AG-A025-01 | Colorectum | rectum adenocarcinoma | Female | <65 | I/II | Unknown | Unknown | SD |
| Page: 1 2 3 4 5 6 |
Top |
Related drugs of malignant transformation related genes |
| Identification of chemicals and drugs interact with genes involved in malignant transfromation |
| (DGIdb 4.0) |
| Entrez ID | Symbol | Category | Interaction Types | Drug Claim Name | Drug Name | PMIDs |
| Page: 1 |

Copyright 2023-Present -The University of Texas Health Science Center at Houston |