
|
|||||
|
 | |
| |
| |
| |
| |
| |
|
Gene: ERG |
Gene summary for ERG |
| Gene information | Species | Human | Gene symbol | ERG | Gene ID | 2078 |
| Gene name | ETS transcription factor ERG | |
| Gene Alias | erg-3 | |
| Cytomap | 21q22.2 | |
| Gene Type | protein-coding | GO ID | GO:0006139 | UniProtAcc | B4DN83 |
Top |
Malignant transformation analysis |
| Identification of the aberrant gene expression in precancerous and cancerous lesions by comparing the gene expression of stem-like cells in diseased tissues with normal stem cells |
| Entrez ID | Symbol | Replicates | Species | Organ | Tissue | Adj P-value | Log2FC | Malignancy |
| 2078 | ERG | CCI_1 | Human | Cervix | CC | 3.26e-19 | 1.43e+00 | 0.528 |
| 2078 | ERG | CCI_3 | Human | Cervix | CC | 2.05e-05 | 5.74e-01 | 0.516 |
| 2078 | ERG | AEH-subject3 | Human | Endometrium | AEH | 6.69e-03 | 2.01e-01 | -0.2576 |
| 2078 | ERG | AEH-subject5 | Human | Endometrium | AEH | 3.86e-07 | 2.38e-01 | -0.2953 |
| 2078 | ERG | EEC-subject1 | Human | Endometrium | EEC | 4.91e-06 | 3.11e-01 | -0.2682 |
| 2078 | ERG | EEC-subject4 | Human | Endometrium | EEC | 1.12e-05 | 2.20e-01 | -0.2571 |
| 2078 | ERG | EEC-subject5 | Human | Endometrium | EEC | 2.11e-07 | 3.41e-01 | -0.249 |
| 2078 | ERG | GSM5276935 | Human | Endometrium | EEC | 3.40e-05 | 1.52e-01 | -0.123 |
| 2078 | ERG | P5T-E | Human | Esophagus | ESCC | 1.30e-15 | 2.58e-01 | 0.1327 |
| 2078 | ERG | P9T-E | Human | Esophagus | ESCC | 2.05e-02 | 1.60e-01 | 0.1131 |
| 2078 | ERG | P10T-E | Human | Esophagus | ESCC | 3.75e-03 | 6.36e-02 | 0.116 |
| 2078 | ERG | P11T-E | Human | Esophagus | ESCC | 3.15e-03 | 1.84e-01 | 0.1426 |
| 2078 | ERG | P12T-E | Human | Esophagus | ESCC | 9.35e-10 | 2.12e-01 | 0.1122 |
| 2078 | ERG | P20T-E | Human | Esophagus | ESCC | 2.28e-02 | 1.25e-01 | 0.1124 |
| 2078 | ERG | P26T-E | Human | Esophagus | ESCC | 5.03e-37 | 6.08e-01 | 0.1276 |
| 2078 | ERG | P27T-E | Human | Esophagus | ESCC | 3.60e-13 | 3.02e-01 | 0.1055 |
| 2078 | ERG | P28T-E | Human | Esophagus | ESCC | 8.40e-04 | 1.15e-01 | 0.1149 |
| 2078 | ERG | P30T-E | Human | Esophagus | ESCC | 1.53e-02 | 1.24e-01 | 0.137 |
| 2078 | ERG | P32T-E | Human | Esophagus | ESCC | 3.75e-03 | 9.42e-02 | 0.1666 |
| 2078 | ERG | P37T-E | Human | Esophagus | ESCC | 3.41e-03 | 1.20e-01 | 0.1371 |
| Page: 1 2 |
| Tissue | Expression Dynamics | Abbreviation |
| Cervix |  | CC: Cervix cancer |
| HSIL_HPV: HPV-infected high-grade squamous intraepithelial lesions | ||
| N_HPV: HPV-infected normal cervix | ||
| Endometrium | 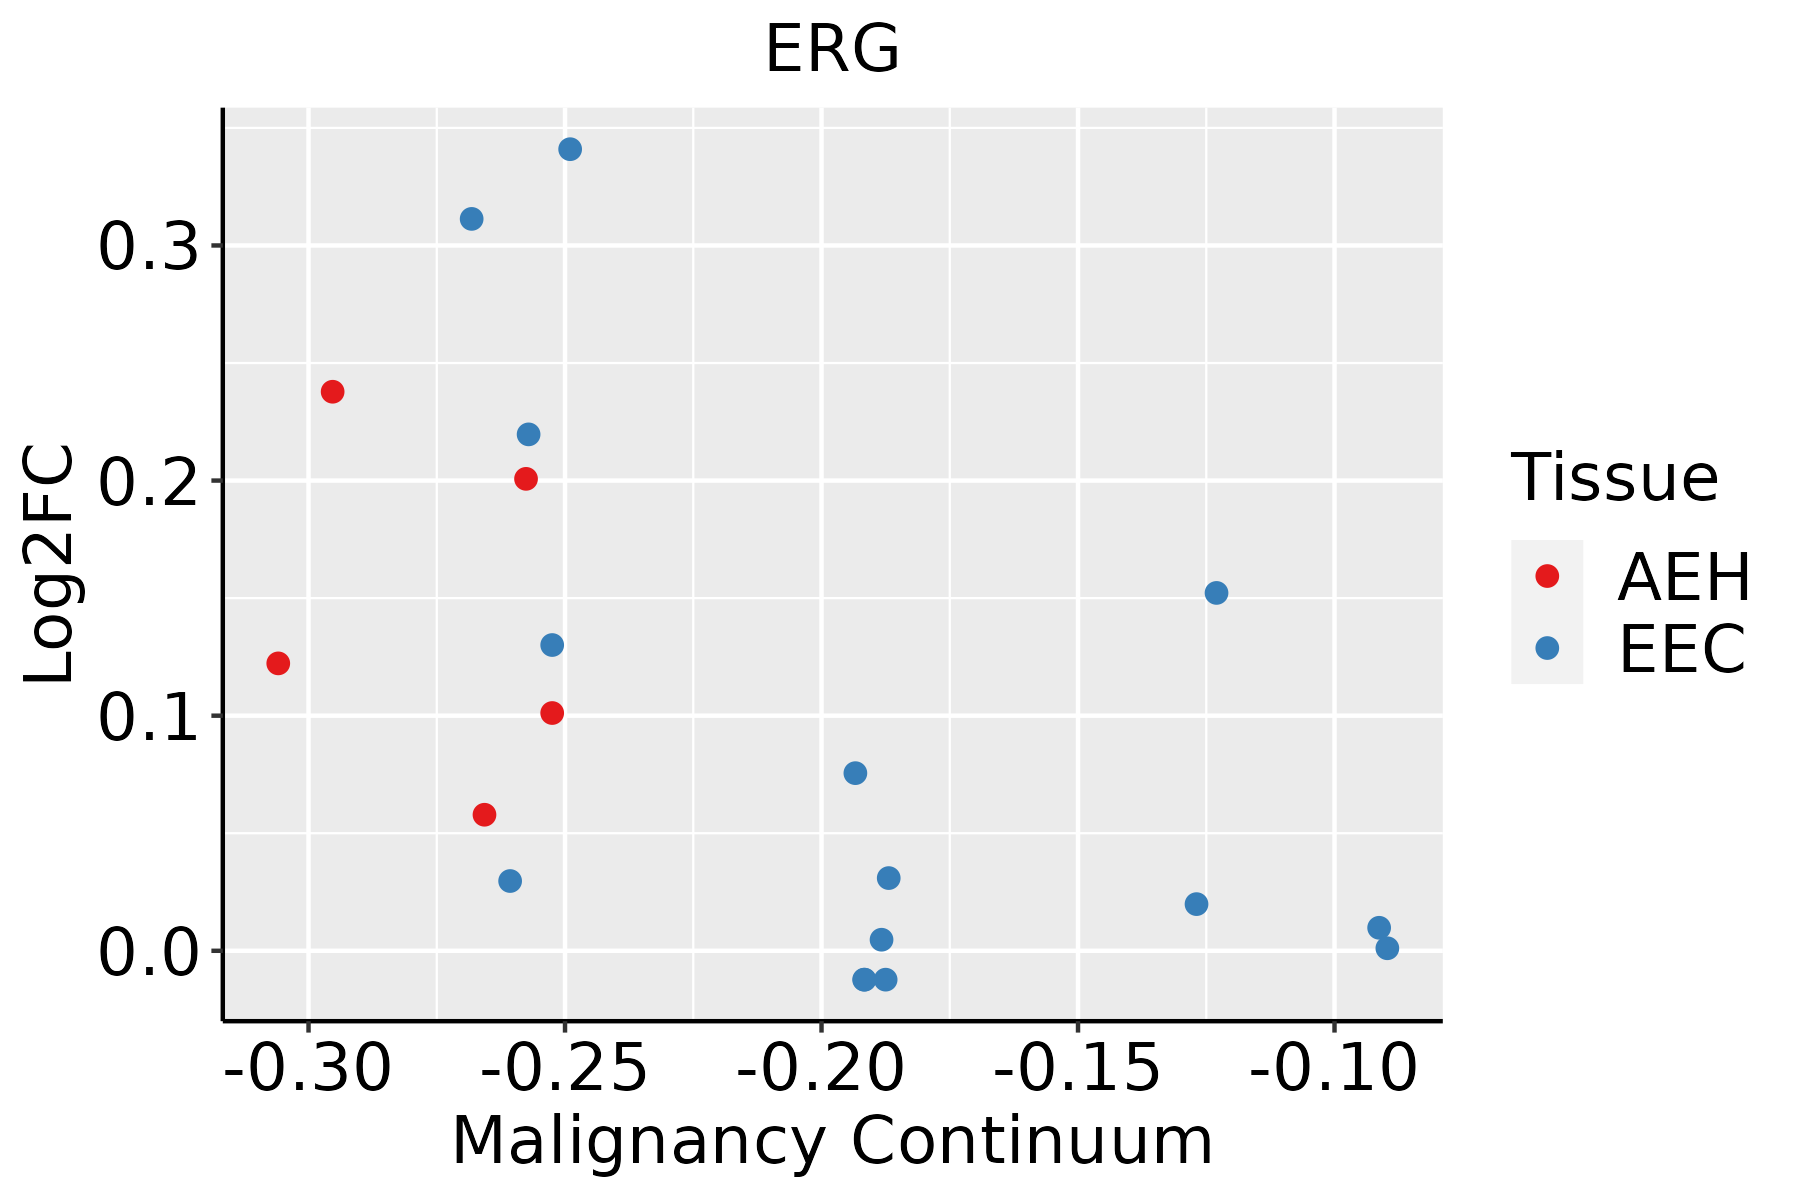 | AEH: Atypical endometrial hyperplasia |
| EEC: Endometrioid Cancer | ||
| Esophagus | 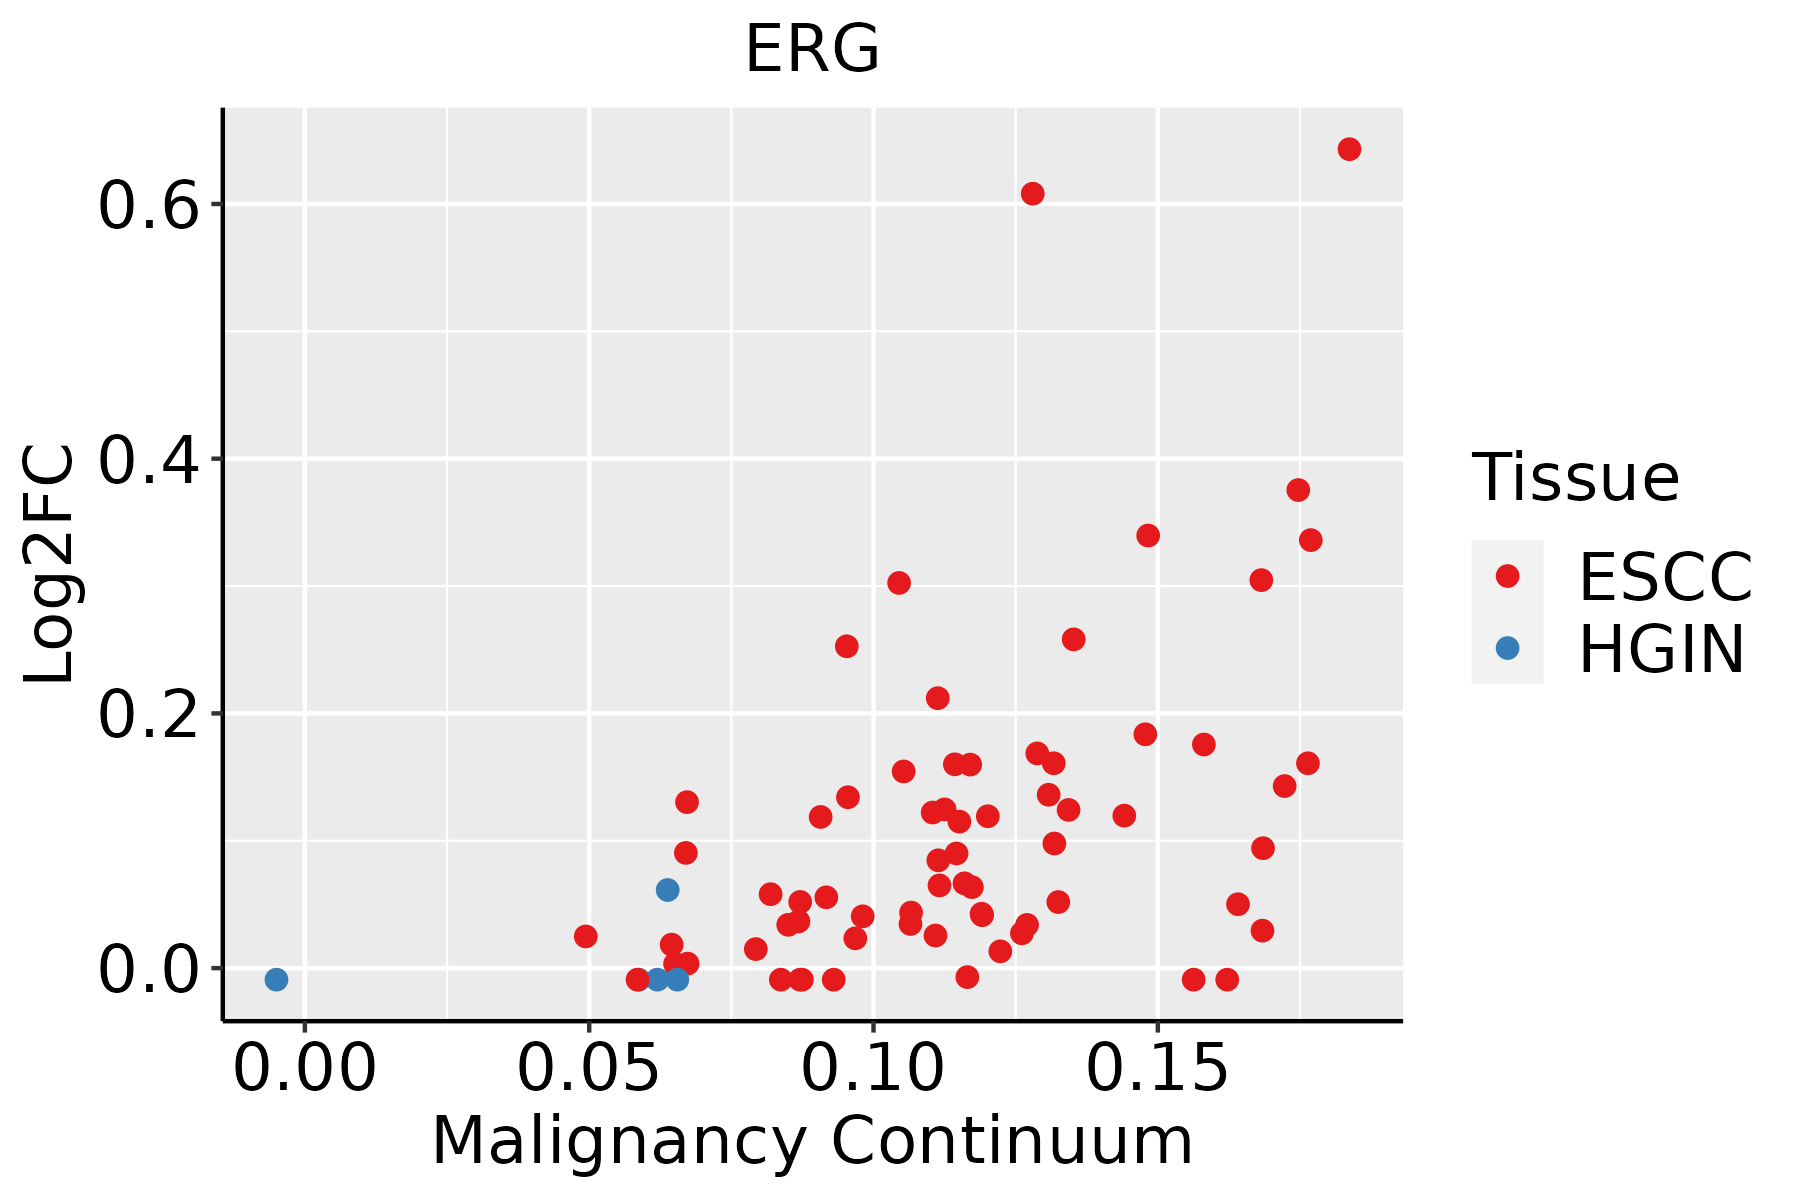 | ESCC: Esophageal squamous cell carcinoma |
| HGIN: High-grade intraepithelial neoplasias | ||
| LGIN: Low-grade intraepithelial neoplasias |
| ∗log2FC in expression of this searched gene in stem-like cells from each diseased tissue sample relative to stem-like cells in normal samples in each tissue plotted against the malignancy continuum. Samples are colored based on if they are from different disease stage. |
Top |
Malignant transformation related pathway analysis |
| Find out the enriched GO biological processes and KEGG pathways involved in transition from healthy to precancer to cancer |
| Tissue | Disease Stage | Enriched GO biological Processes |
| Colorectum | AD |  |
| Colorectum | SER |  |
| Colorectum | MSS |  |
| Colorectum | MSI-H |  |
| Colorectum | FAP |  |
| ∗Top 15 enriched GO BP terms are showed in the bar plot of each disease state in each tissue. Each row represents a significant GO biological process which is colored according to the -log10(p.adjust). |
| Page: 1 2 3 4 5 6 7 8 9 |
| GO ID | Tissue | Disease Stage | Description | Gene Ratio | Bg Ratio | pvalue | p.adjust | Count |
| GO:001604927 | Thyroid | ATC | cell growth | 241/6293 | 482/18723 | 4.27e-14 | 2.35e-12 | 241 |
| GO:000688823 | Thyroid | ATC | endoplasmic reticulum to Golgi vesicle-mediated transport | 84/6293 | 130/18723 | 4.40e-13 | 1.97e-11 | 84 |
| GO:000635421 | Thyroid | ATC | DNA-templated transcription, elongation | 63/6293 | 91/18723 | 3.89e-12 | 1.55e-10 | 63 |
| GO:000726524 | Thyroid | ATC | Ras protein signal transduction | 172/6293 | 337/18723 | 2.25e-11 | 7.96e-10 | 172 |
| GO:000155826 | Thyroid | ATC | regulation of cell growth | 201/6293 | 414/18723 | 1.57e-10 | 4.76e-09 | 201 |
| GO:000636822 | Thyroid | ATC | transcription elongation from RNA polymerase II promoter | 49/6293 | 69/18723 | 2.32e-10 | 6.72e-09 | 49 |
| GO:003278414 | Thyroid | ATC | regulation of DNA-templated transcription, elongation | 39/6293 | 53/18723 | 3.04e-09 | 7.10e-08 | 39 |
| GO:0006890110 | Thyroid | ATC | retrograde vesicle-mediated transport, Golgi to endoplasmic reticulum | 37/6293 | 52/18723 | 3.45e-08 | 6.43e-07 | 37 |
| GO:003424314 | Thyroid | ATC | regulation of transcription elongation from RNA polymerase II promoter | 25/6293 | 32/18723 | 3.13e-07 | 4.68e-06 | 25 |
| GO:003278615 | Thyroid | ATC | positive regulation of DNA-templated transcription, elongation | 21/6293 | 27/18723 | 3.28e-06 | 3.69e-05 | 21 |
| GO:003424412 | Thyroid | ATC | negative regulation of transcription elongation from RNA polymerase II promoter | 14/6293 | 16/18723 | 1.32e-05 | 1.26e-04 | 14 |
| GO:003278512 | Thyroid | ATC | negative regulation of DNA-templated transcription, elongation | 15/6293 | 18/18723 | 2.06e-05 | 1.85e-04 | 15 |
| GO:004592622 | Thyroid | ATC | negative regulation of growth | 115/6293 | 249/18723 | 2.34e-05 | 2.06e-04 | 115 |
| GO:003030813 | Thyroid | ATC | negative regulation of cell growth | 90/6293 | 188/18723 | 3.35e-05 | 2.78e-04 | 90 |
| GO:003296814 | Thyroid | ATC | positive regulation of transcription elongation from RNA polymerase II promoter | 11/6293 | 13/18723 | 2.30e-04 | 1.49e-03 | 11 |
| GO:190495013 | Thyroid | ATC | negative regulation of establishment of protein localization | 61/6293 | 131/18723 | 1.38e-03 | 7.16e-03 | 61 |
| GO:005122413 | Thyroid | ATC | negative regulation of protein transport | 59/6293 | 127/18723 | 1.75e-03 | 8.71e-03 | 59 |
| GO:007169223 | Thyroid | ATC | protein localization to extracellular region | 150/6293 | 368/18723 | 2.25e-03 | 1.05e-02 | 150 |
| GO:000930623 | Thyroid | ATC | protein secretion | 146/6293 | 359/18723 | 2.83e-03 | 1.29e-02 | 146 |
| GO:003559223 | Thyroid | ATC | establishment of protein localization to extracellular region | 146/6293 | 360/18723 | 3.20e-03 | 1.44e-02 | 146 |
| Page: 1 2 3 4 5 6 7 8 9 10 11 |
| Pathway ID | Tissue | Disease Stage | Description | Gene Ratio | Bg Ratio | pvalue | p.adjust | qvalue | Count |
| hsa052157 | Cervix | CC | Prostate cancer | 27/1267 | 97/8465 | 7.54e-04 | 3.39e-03 | 2.01e-03 | 27 |
| hsa0521512 | Cervix | CC | Prostate cancer | 27/1267 | 97/8465 | 7.54e-04 | 3.39e-03 | 2.01e-03 | 27 |
| hsa052158 | Endometrium | AEH | Prostate cancer | 25/1197 | 97/8465 | 1.68e-03 | 1.01e-02 | 7.39e-03 | 25 |
| hsa0521513 | Endometrium | AEH | Prostate cancer | 25/1197 | 97/8465 | 1.68e-03 | 1.01e-02 | 7.39e-03 | 25 |
| hsa0521522 | Endometrium | EEC | Prostate cancer | 25/1237 | 97/8465 | 2.66e-03 | 1.56e-02 | 1.16e-02 | 25 |
| hsa0521532 | Endometrium | EEC | Prostate cancer | 25/1237 | 97/8465 | 2.66e-03 | 1.56e-02 | 1.16e-02 | 25 |
| hsa0521516 | Esophagus | ESCC | Prostate cancer | 72/4205 | 97/8465 | 6.12e-07 | 4.10e-06 | 2.10e-06 | 72 |
| hsa052028 | Esophagus | ESCC | Transcriptional misregulation in cancer | 116/4205 | 193/8465 | 2.08e-03 | 5.95e-03 | 3.05e-03 | 116 |
| hsa0521517 | Esophagus | ESCC | Prostate cancer | 72/4205 | 97/8465 | 6.12e-07 | 4.10e-06 | 2.10e-06 | 72 |
| hsa0520213 | Esophagus | ESCC | Transcriptional misregulation in cancer | 116/4205 | 193/8465 | 2.08e-03 | 5.95e-03 | 3.05e-03 | 116 |
| Page: 1 |
Top |
Cell-cell communication analysis |
| Identification of potential cell-cell interactions between two cell types and their ligand-receptor pairs for different disease states |
| Ligand | Receptor | LRpair | Pathway | Tissue | Disease Stage |
| Page: 1 |
Top |
Single-cell gene regulatory network inference analysis |
| Find out the significant the regulons (TFs) and the target genes of each regulon across cell types for different disease states |
| TF | Cell Type | Tissue | Disease Stage | Target Gene | RSS | Regulon Activity |
| ERG | MYOEPI | Breast | ADJ | AL590617.2,ITGA2,DST, etc. | 6.58e-01 |  |
| ERG | MYOEPI | Breast | Healthy | ITGB1,LIMA1,NRP2, etc. | 4.72e-01 |  |
| ERG | MYOEPI | Breast | Precancer | AL590617.2,ITGA2,DST, etc. | 6.16e-01 |  |
| ERG | STM | Cervix | Healthy | CYSLTR1,TPST2,DOP1B, etc. | 3.44e-01 |  |
| ERG | SPI | Oral cavity | NEOLP | PROX1,ST6GALNAC3,STOX2, etc. | 1.83e-01 |  |
| ERG | MAST | Pancreas | ADJ | KCNG2,EPB41L1,KIT, etc. | 1.87e-01 |  |
| ERG | MAST | Pancreas | Healthy | KCNG2,EPB41L1,KIT, etc. | 2.65e-01 |  |
| ERG | MAST | Pancreas | PanIN | KCNG2,EPB41L1,KIT, etc. | 4.60e-01 |  |
| ERG | MAST | Pancreas | PDAC | KCNG2,EPB41L1,KIT, etc. | 3.19e-01 |  |
| ERG | NKT | Pancreas | PDAC | KCNG2,EPB41L1,KIT, etc. | 9.03e-02 | |
| ∗The dot plots of a searched regulon are shown for all cell subpopulations in each disease state of each tissue based on the regulon specific score inferred using pySCENIC and by calculating the average expression. |
| Page: 1 2 |
Top |
Somatic mutation of malignant transformation related genes |
| Annotation of somatic variants for genes involved in malignant transformation |
| Hugo Symbol | Variant Class | Variant Classification | dbSNP RS | HGVSc | HGVSp | HGVSp Short | SWISSPROT | BIOTYPE | SIFT | PolyPhen | Tumor Sample Barcode | Tissue | Histology | Sex | Age | Stage | Therapy Types | Drugs | Outcome |
| ERG | SNV | Missense_Mutation | c.465N>T | p.Lys155Asn | p.K155N | P11308 | protein_coding | deleterious(0.04) | probably_damaging(0.966) | TCGA-A1-A0SO-01 | Breast | breast invasive carcinoma | Female | >=65 | I/II | Chemotherapy | SD | ||
| ERG | SNV | Missense_Mutation | novel | c.976N>A | p.Glu326Lys | p.E326K | P11308 | protein_coding | deleterious(0) | probably_damaging(0.999) | TCGA-A2-A04Q-01 | Breast | breast invasive carcinoma | Female | <65 | I/II | Chemotherapy | adriamycin | SD |
| ERG | SNV | Missense_Mutation | c.1267C>A | p.Pro423Thr | p.P423T | P11308 | protein_coding | tolerated(0.32) | benign(0.003) | TCGA-A2-A1FX-01 | Breast | breast invasive carcinoma | Female | <65 | III/IV | Chemotherapy | taxotere | SD | |
| ERG | SNV | Missense_Mutation | novel | c.29N>T | p.Ala10Val | p.A10V | P11308 | protein_coding | tolerated_low_confidence(0.4) | benign(0) | TCGA-AN-A046-01 | Breast | breast invasive carcinoma | Female | >=65 | I/II | Unknown | Unknown | SD |
| ERG | SNV | Missense_Mutation | c.120N>A | p.Met40Ile | p.M40I | P11308 | protein_coding | deleterious(0.05) | benign(0.358) | TCGA-E2-A159-01 | Breast | breast invasive carcinoma | Female | <65 | I/II | Chemotherapy | cyclophosphamide | SD | |
| ERG | SNV | Missense_Mutation | c.401T>A | p.Val134Glu | p.V134E | P11308 | protein_coding | deleterious(0) | probably_damaging(0.987) | TCGA-GM-A2DF-01 | Breast | breast invasive carcinoma | Female | <65 | I/II | Chemotherapy | taxol | CR | |
| ERG | insertion | Frame_Shift_Ins | novel | c.1309_1310insCA | p.Phe437SerfsTer12 | p.F437Sfs*12 | P11308 | protein_coding | TCGA-AN-A046-01 | Breast | breast invasive carcinoma | Female | >=65 | I/II | Unknown | Unknown | SD | ||
| ERG | insertion | Nonsense_Mutation | novel | c.1307_1308insACAATCTGGAGATGTTACAAGTTTATGACTCATGA | p.Asn436LysfsTer10 | p.N436Kfs*10 | P11308 | protein_coding | TCGA-AN-A046-01 | Breast | breast invasive carcinoma | Female | >=65 | I/II | Unknown | Unknown | SD | ||
| ERG | SNV | Missense_Mutation | c.1123N>A | p.Ala375Thr | p.A375T | P11308 | protein_coding | deleterious(0) | probably_damaging(1) | TCGA-EA-A410-01 | Cervix | cervical & endocervical cancer | Female | <65 | I/II | Unknown | Unknown | SD | |
| ERG | SNV | Missense_Mutation | c.749G>T | p.Arg250Ile | p.R250I | P11308 | protein_coding | deleterious(0.02) | possibly_damaging(0.866) | TCGA-FU-A3HZ-01 | Cervix | cervical & endocervical cancer | Female | <65 | I/II | Chemotherapy | cisplatin | CR |
| Page: 1 2 3 4 5 6 7 8 |
Top |
Related drugs of malignant transformation related genes |
| Identification of chemicals and drugs interact with genes involved in malignant transfromation |
| (DGIdb 4.0) |
| Entrez ID | Symbol | Category | Interaction Types | Drug Claim Name | Drug Name | PMIDs |
| 2078 | ERG | DRUGGABLE GENOME, CLINICALLY ACTIONABLE | MMV009085 | CHEMBL581225 | ||
| 2078 | ERG | DRUGGABLE GENOME, CLINICALLY ACTIONABLE | MEDROXYPROGESTERONE ACETATE | MEDROXYPROGESTERONE ACETATE | ||
| 2078 | ERG | DRUGGABLE GENOME, CLINICALLY ACTIONABLE | blocker | CHEMBL473 | DOFETILIDE | |
| 2078 | ERG | DRUGGABLE GENOME, CLINICALLY ACTIONABLE | HOMIDIUM BROMIDE | HOMIDIUM BROMIDE | ||
| 2078 | ERG | DRUGGABLE GENOME, CLINICALLY ACTIONABLE | blocker | CHEMBL1700 | SOTALOL HYDROCHLORIDE | |
| 2078 | ERG | DRUGGABLE GENOME, CLINICALLY ACTIONABLE | blocker | CHEMBL3545169 | AZD1305 | |
| 2078 | ERG | DRUGGABLE GENOME, CLINICALLY ACTIONABLE | GNF-PF-1947 | CHEMBL585591 | ||
| 2078 | ERG | DRUGGABLE GENOME, CLINICALLY ACTIONABLE | blocker | CHEMBL2107762 | NERISPIRDINE | |
| 2078 | ERG | DRUGGABLE GENOME, CLINICALLY ACTIONABLE | ACRIDIN-1-YLAMINE | CHEMBL146525 | ||
| 2078 | ERG | DRUGGABLE GENOME, CLINICALLY ACTIONABLE | IDARUBICIN HYDROCHLORIDE | IDARUBICIN HYDROCHLORIDE |
| Page: 1 2 3 |

Copyright 2023-Present -The University of Texas Health Science Center at Houston |