
|
|||||
|
 | |
| |
| |
| |
| |
| |
|
Gene: ERCC1 |
Gene summary for ERCC1 |
| Gene information | Species | Human | Gene symbol | ERCC1 | Gene ID | 2067 |
| Gene name | ERCC excision repair 1, endonuclease non-catalytic subunit | |
| Gene Alias | COFS4 | |
| Cytomap | 19q13.32 | |
| Gene Type | protein-coding | GO ID | GO:0000003 | UniProtAcc | P07992 |
Top |
Malignant transformation analysis |
| Identification of the aberrant gene expression in precancerous and cancerous lesions by comparing the gene expression of stem-like cells in diseased tissues with normal stem cells |
| Entrez ID | Symbol | Replicates | Species | Organ | Tissue | Adj P-value | Log2FC | Malignancy |
| 2067 | ERCC1 | LZE4T | Human | Esophagus | ESCC | 5.95e-14 | 5.18e-01 | 0.0811 |
| 2067 | ERCC1 | LZE8T | Human | Esophagus | ESCC | 1.67e-03 | 2.19e-01 | 0.067 |
| 2067 | ERCC1 | LZE20T | Human | Esophagus | ESCC | 5.07e-03 | 2.42e-02 | 0.0662 |
| 2067 | ERCC1 | LZE22T | Human | Esophagus | ESCC | 4.14e-04 | 5.52e-01 | 0.068 |
| 2067 | ERCC1 | LZE24T | Human | Esophagus | ESCC | 3.36e-21 | 7.87e-01 | 0.0596 |
| 2067 | ERCC1 | LZE22D3 | Human | Esophagus | HGIN | 1.64e-02 | 3.09e-01 | 0.0653 |
| 2067 | ERCC1 | LZE21T | Human | Esophagus | ESCC | 4.93e-06 | 3.23e-01 | 0.0655 |
| 2067 | ERCC1 | LZE6T | Human | Esophagus | ESCC | 1.16e-12 | 6.20e-01 | 0.0845 |
| 2067 | ERCC1 | P1T-E | Human | Esophagus | ESCC | 4.09e-07 | 5.19e-01 | 0.0875 |
| 2067 | ERCC1 | P2T-E | Human | Esophagus | ESCC | 9.73e-36 | 8.61e-01 | 0.1177 |
| 2067 | ERCC1 | P4T-E | Human | Esophagus | ESCC | 8.64e-33 | 8.50e-01 | 0.1323 |
| 2067 | ERCC1 | P5T-E | Human | Esophagus | ESCC | 2.64e-38 | 6.83e-01 | 0.1327 |
| 2067 | ERCC1 | P8T-E | Human | Esophagus | ESCC | 9.72e-40 | 8.30e-01 | 0.0889 |
| 2067 | ERCC1 | P9T-E | Human | Esophagus | ESCC | 1.10e-29 | 6.66e-01 | 0.1131 |
| 2067 | ERCC1 | P10T-E | Human | Esophagus | ESCC | 6.71e-88 | 1.60e+00 | 0.116 |
| 2067 | ERCC1 | P11T-E | Human | Esophagus | ESCC | 4.60e-15 | 7.51e-01 | 0.1426 |
| 2067 | ERCC1 | P12T-E | Human | Esophagus | ESCC | 1.04e-34 | 6.80e-01 | 0.1122 |
| 2067 | ERCC1 | P15T-E | Human | Esophagus | ESCC | 1.74e-49 | 1.10e+00 | 0.1149 |
| 2067 | ERCC1 | P16T-E | Human | Esophagus | ESCC | 5.10e-39 | 6.69e-01 | 0.1153 |
| 2067 | ERCC1 | P17T-E | Human | Esophagus | ESCC | 2.06e-09 | 7.38e-01 | 0.1278 |
| Page: 1 2 3 4 5 6 7 |
| Tissue | Expression Dynamics | Abbreviation |
| Esophagus | 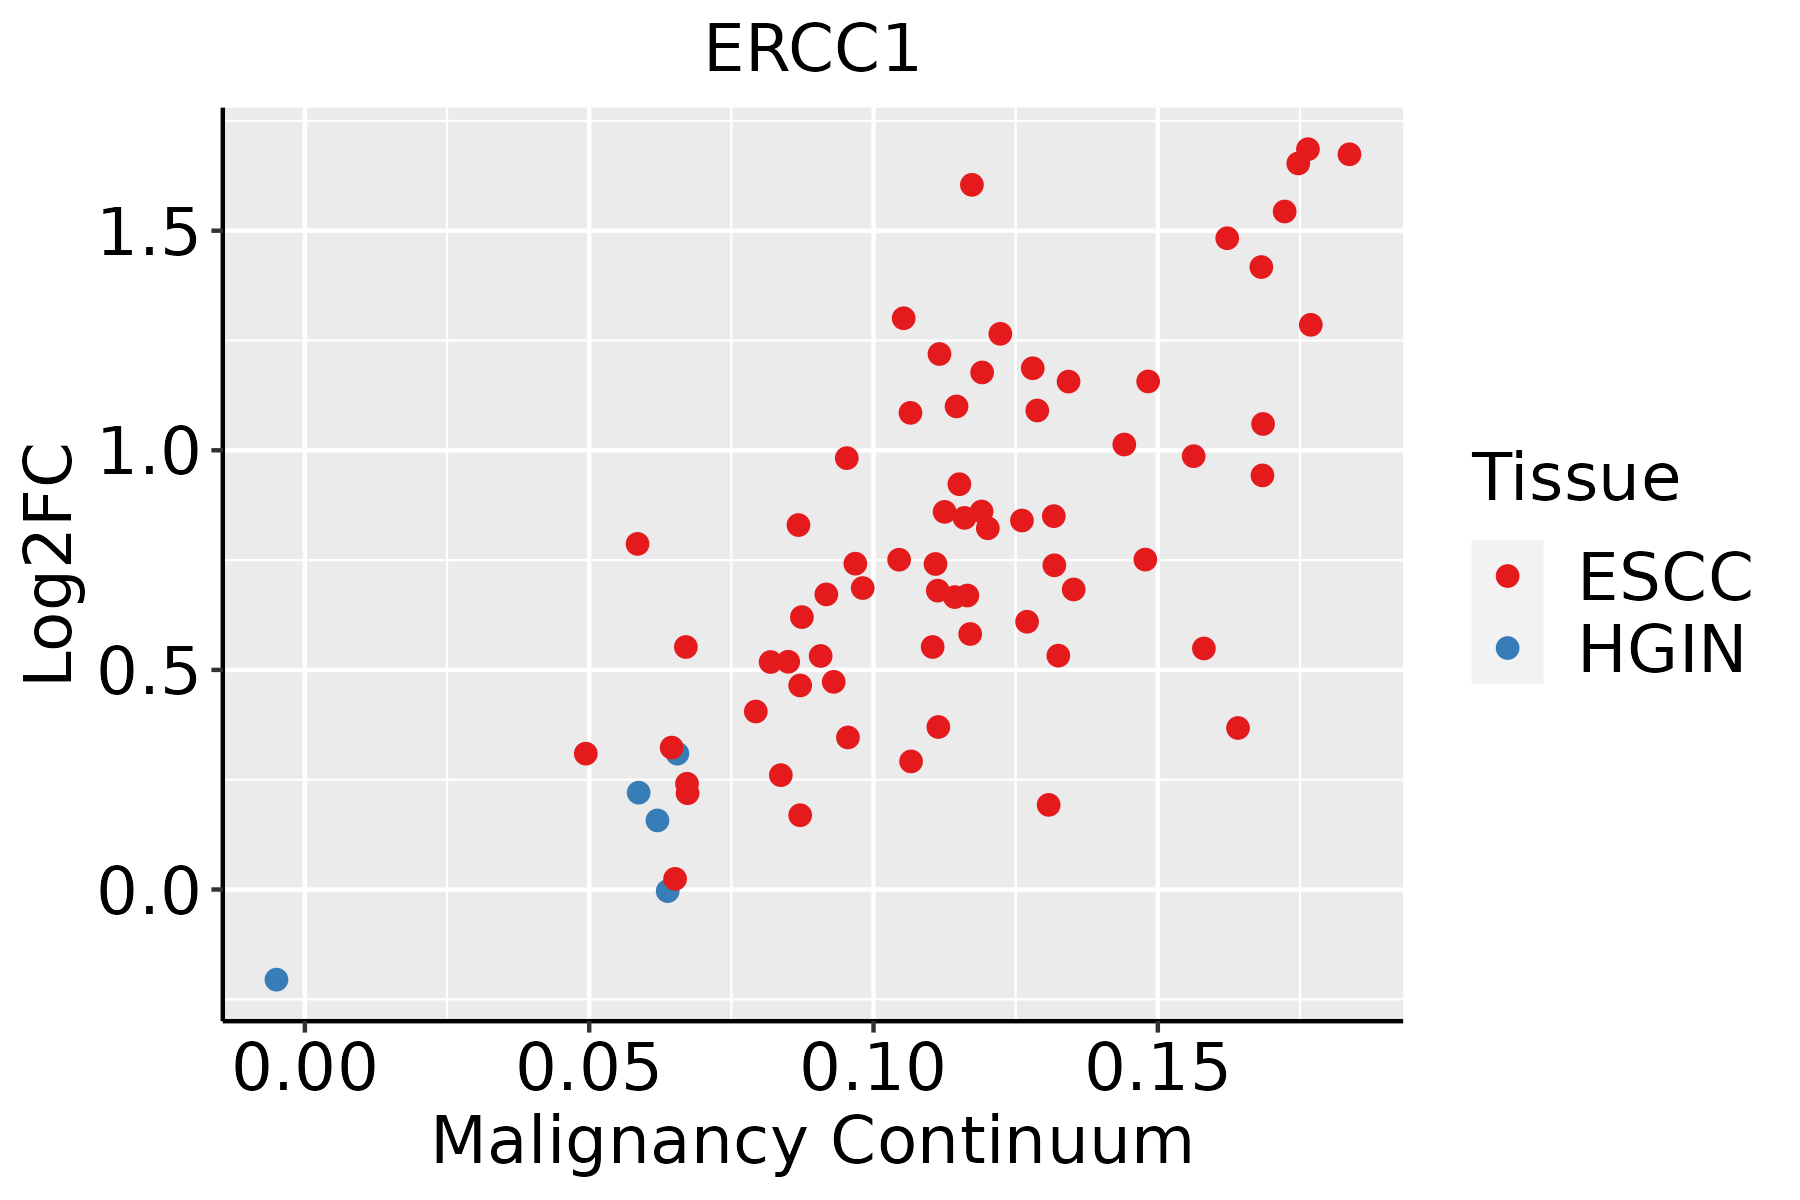 | ESCC: Esophageal squamous cell carcinoma |
| HGIN: High-grade intraepithelial neoplasias | ||
| LGIN: Low-grade intraepithelial neoplasias | ||
| Liver | 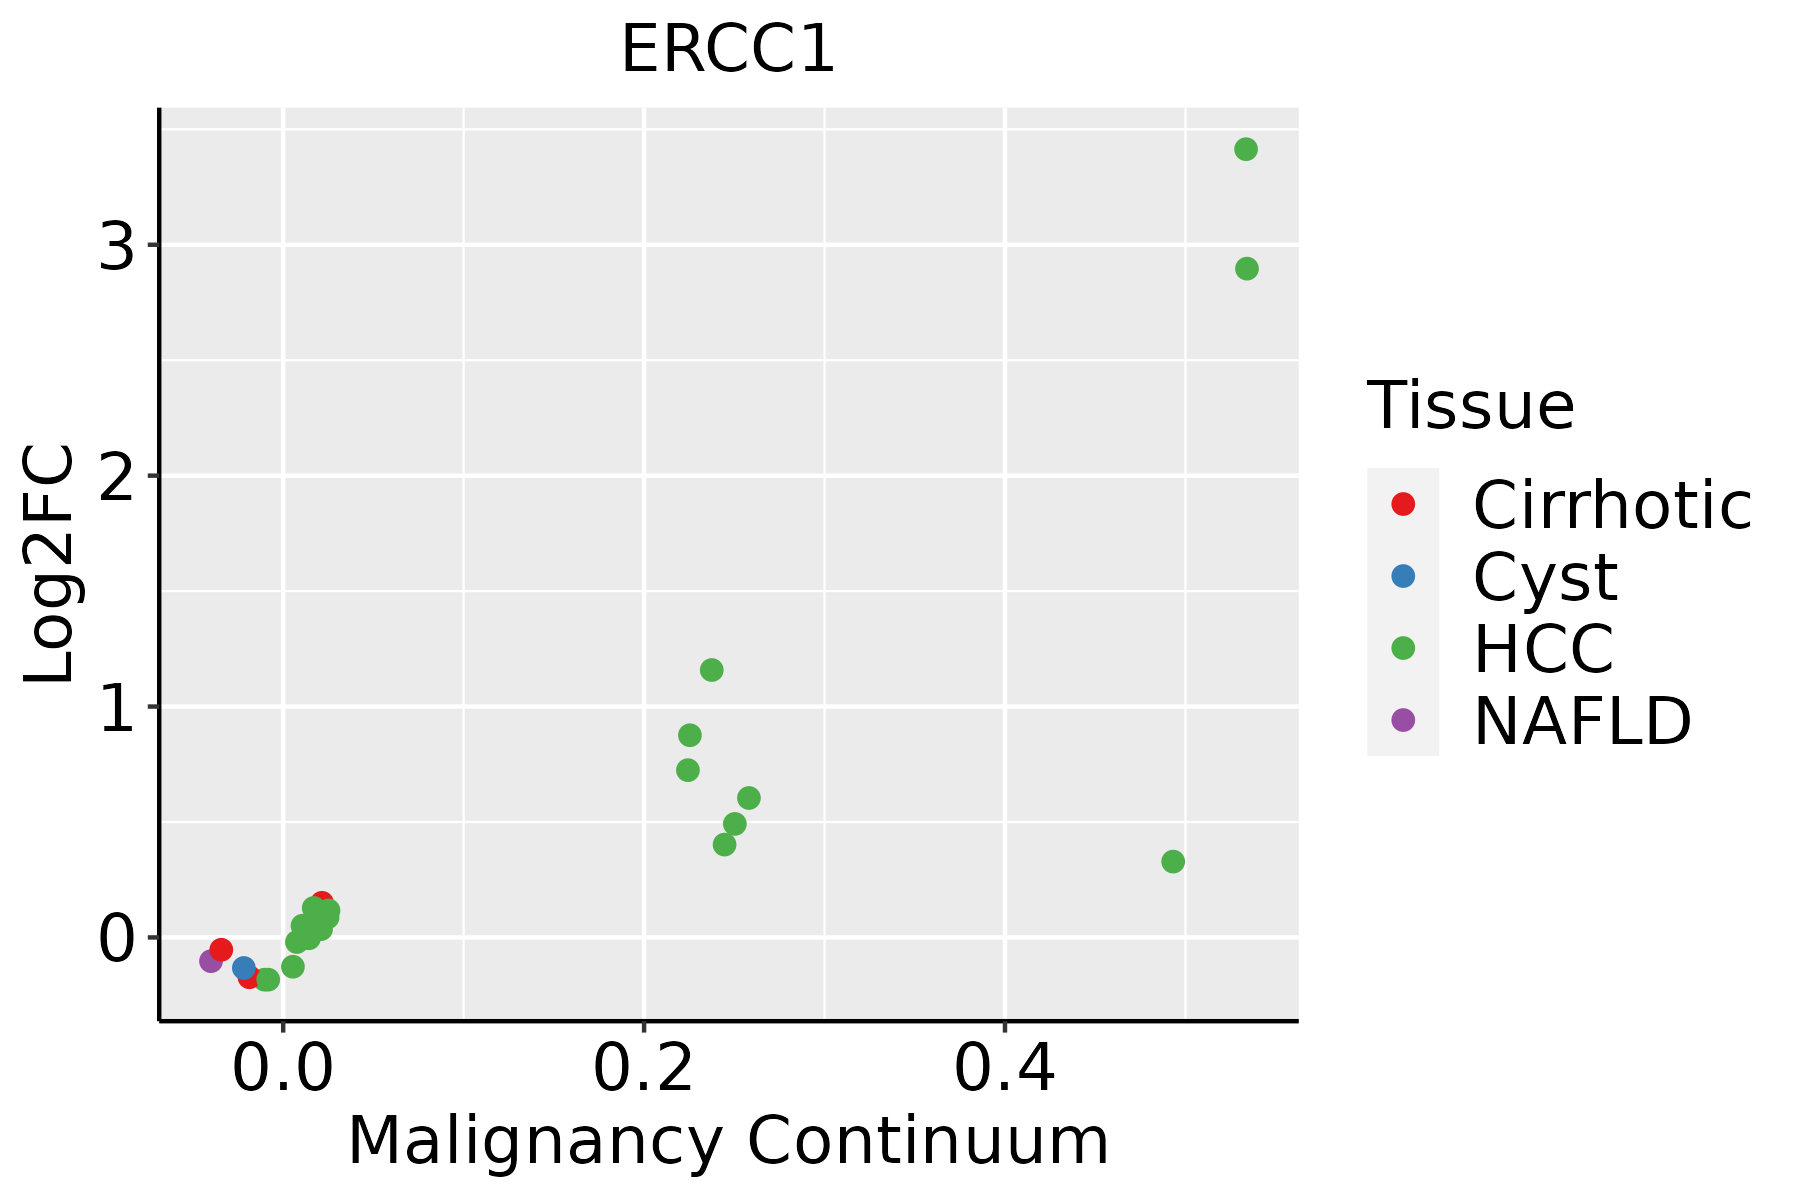 | HCC: Hepatocellular carcinoma |
| NAFLD: Non-alcoholic fatty liver disease | ||
| Lung |  | AAH: Atypical adenomatous hyperplasia |
| AIS: Adenocarcinoma in situ | ||
| IAC: Invasive lung adenocarcinoma | ||
| MIA: Minimally invasive adenocarcinoma | ||
| Oral Cavity | 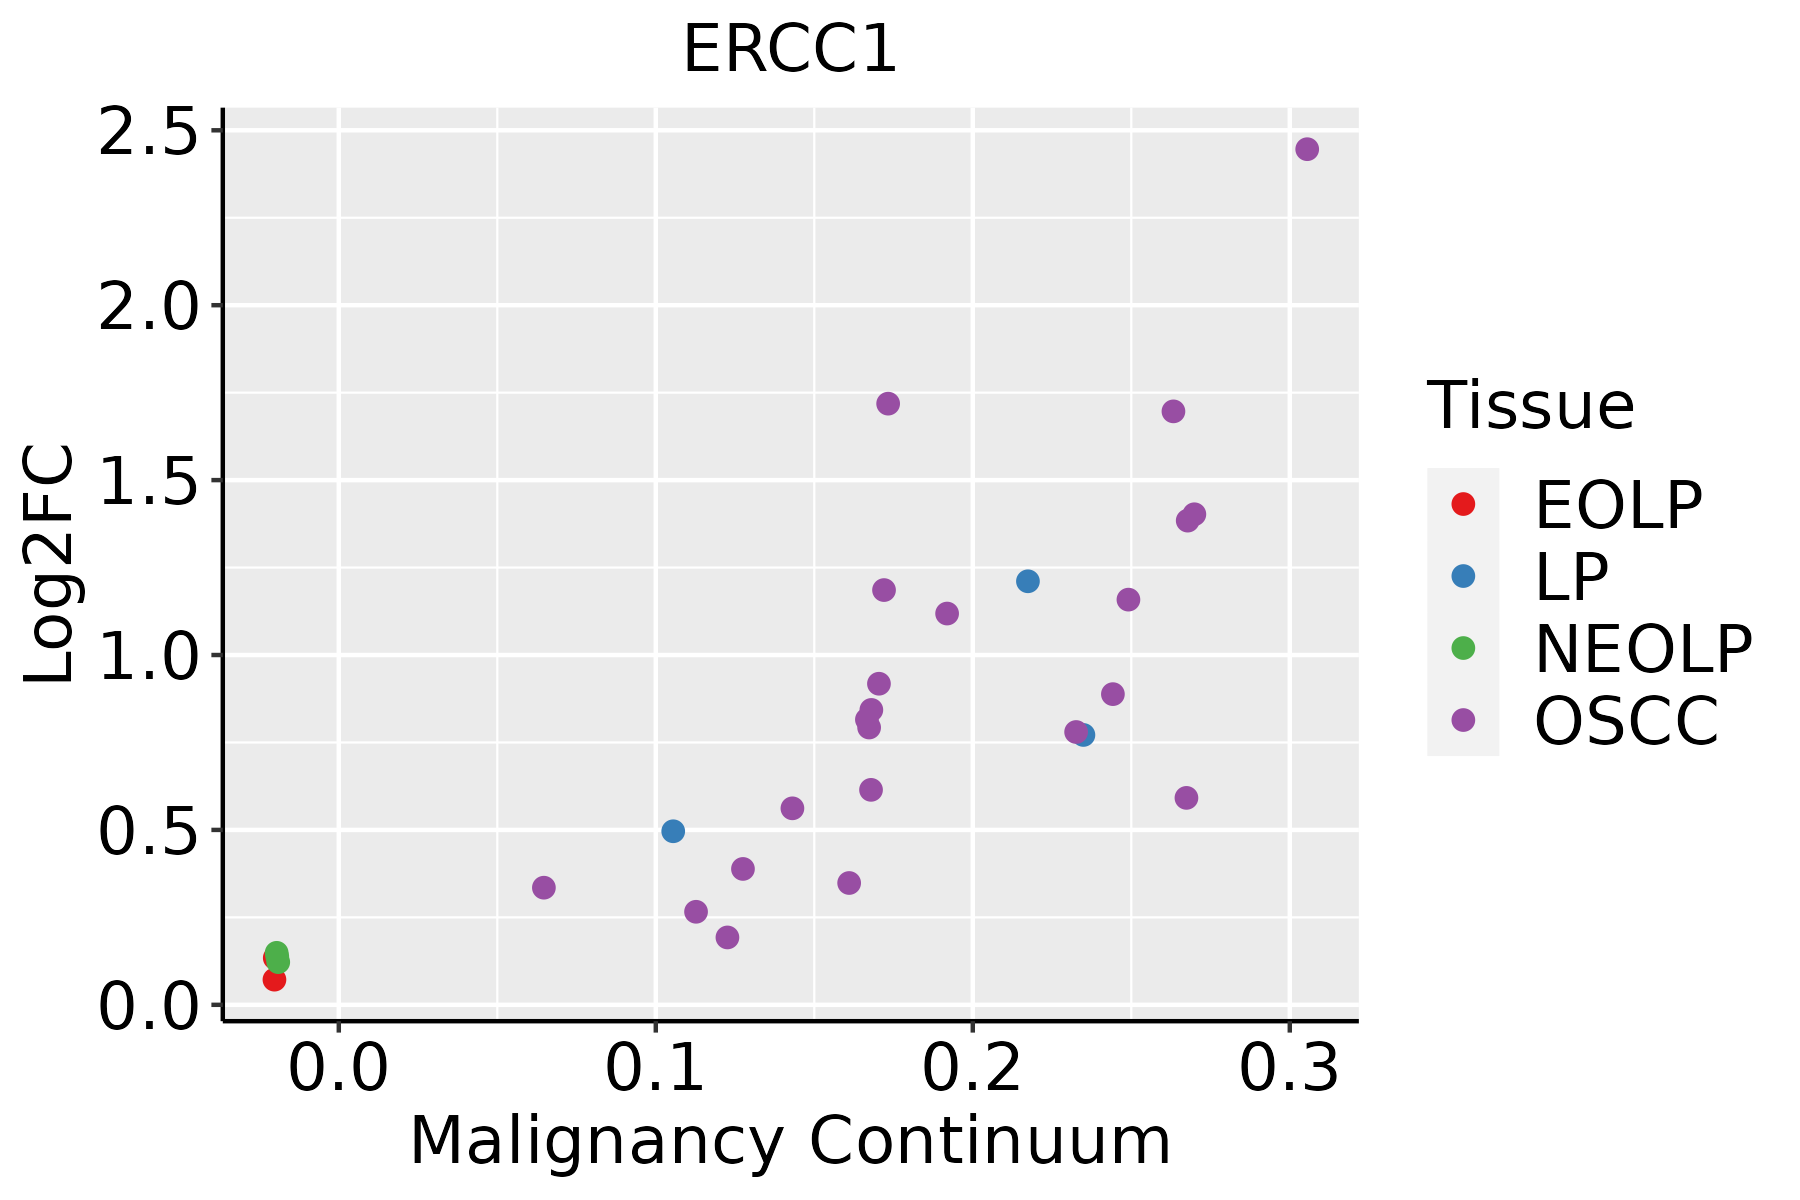 | EOLP: Erosive Oral lichen planus |
| LP: leukoplakia | ||
| NEOLP: Non-erosive oral lichen planus | ||
| OSCC: Oral squamous cell carcinoma | ||
| Prostate | 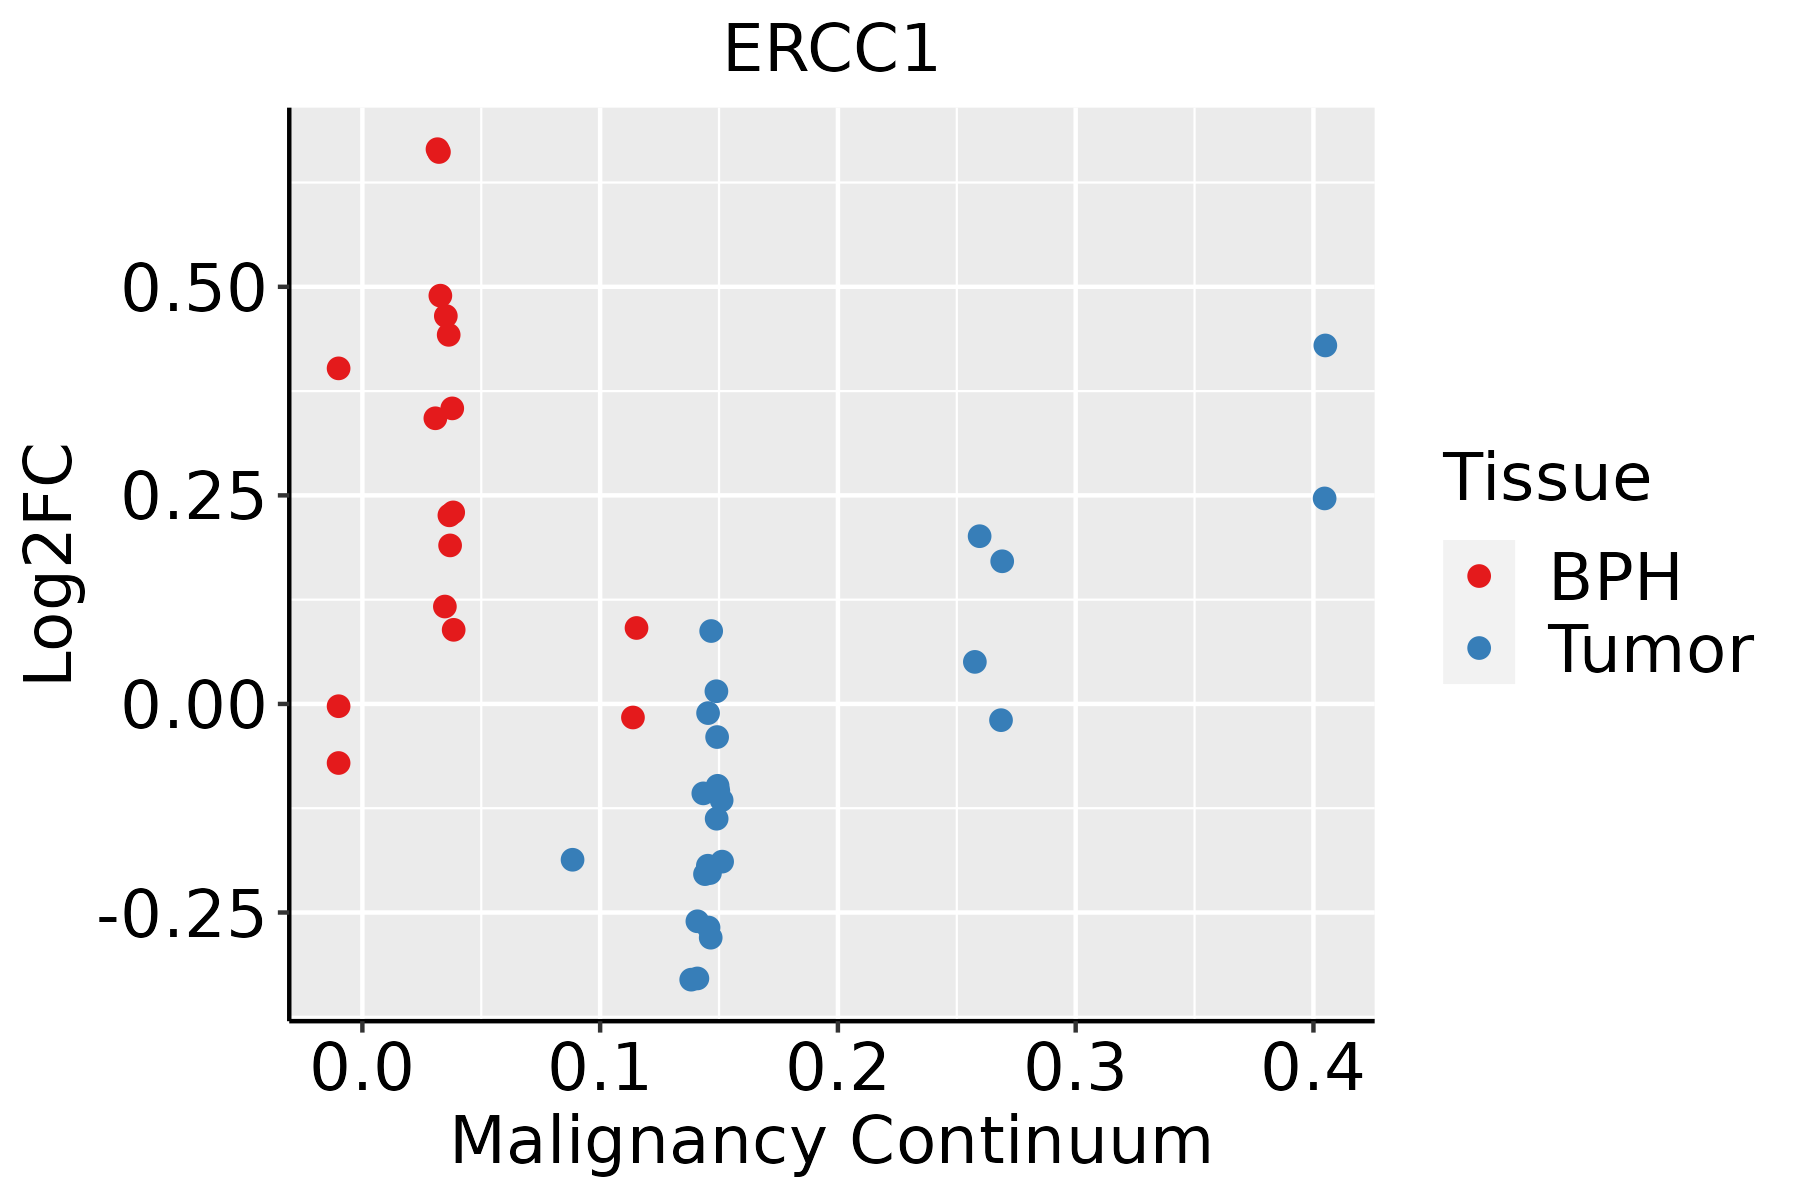 | BPH: Benign Prostatic Hyperplasia |
| Skin | 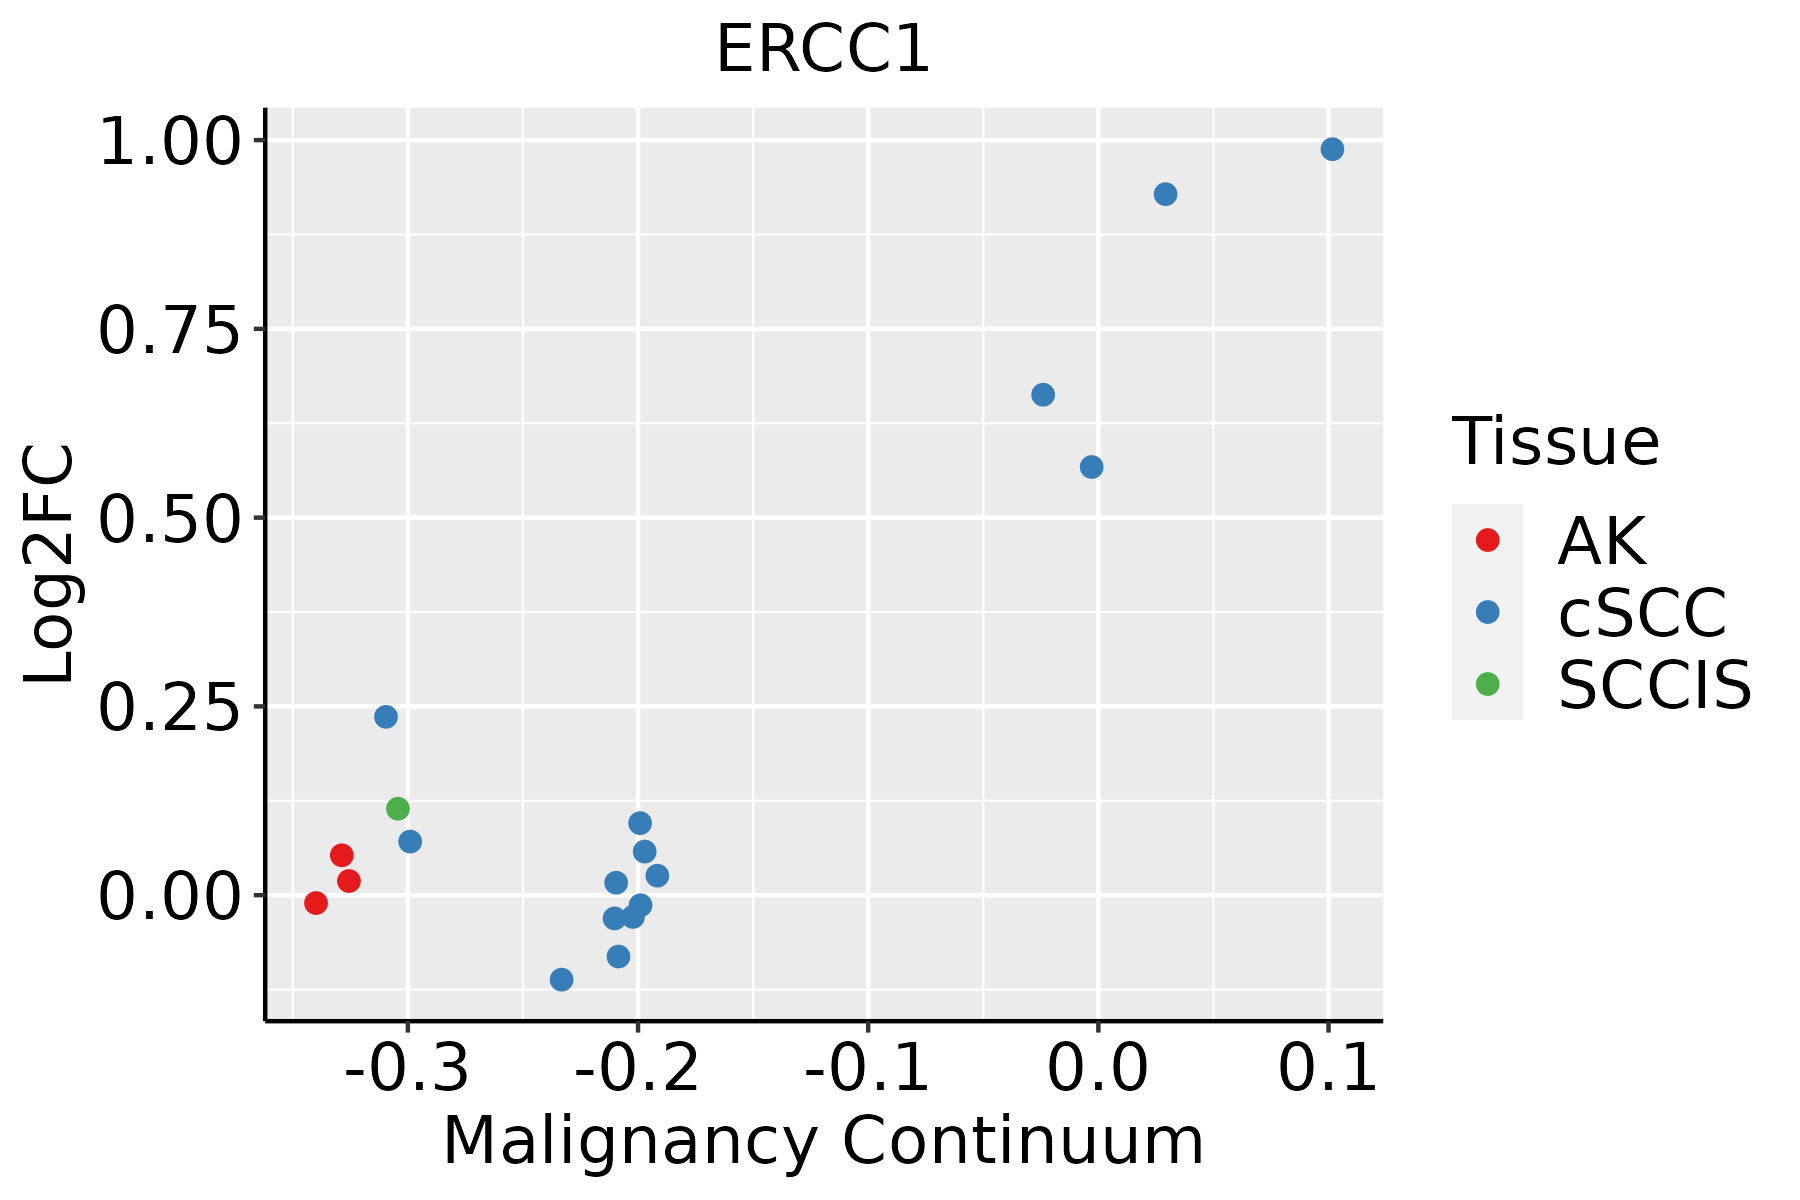 | AK: Actinic keratosis |
| cSCC: Cutaneous squamous cell carcinoma | ||
| SCCIS:squamous cell carcinoma in situ | ||
| Thyroid |  | ATC: Anaplastic thyroid cancer |
| HT: Hashimoto's thyroiditis | ||
| PTC: Papillary thyroid cancer |
| ∗log2FC in expression of this searched gene in stem-like cells from each diseased tissue sample relative to stem-like cells in normal samples in each tissue plotted against the malignancy continuum. Samples are colored based on if they are from different disease stage. |
Top |
Malignant transformation related pathway analysis |
| Find out the enriched GO biological processes and KEGG pathways involved in transition from healthy to precancer to cancer |
| Tissue | Disease Stage | Enriched GO biological Processes |
| Colorectum | AD |  |
| Colorectum | SER |  |
| Colorectum | MSS |  |
| Colorectum | MSI-H |  |
| Colorectum | FAP |  |
| ∗Top 15 enriched GO BP terms are showed in the bar plot of each disease state in each tissue. Each row represents a significant GO biological process which is colored according to the -log10(p.adjust). |
| Page: 1 2 3 4 5 6 7 8 9 |
| GO ID | Tissue | Disease Stage | Description | Gene Ratio | Bg Ratio | pvalue | p.adjust | Count |
| GO:200102022 | Lung | MIAC | regulation of response to DNA damage stimulus | 23/967 | 219/18723 | 9.93e-04 | 2.05e-02 | 23 |
| GO:00094161 | Lung | MIAC | response to light stimulus | 29/967 | 320/18723 | 2.42e-03 | 3.56e-02 | 29 |
| GO:0006949 | Lung | MIAC | syncytium formation | 9/967 | 57/18723 | 2.43e-03 | 3.56e-02 | 9 |
| GO:007121422 | Lung | MIAC | cellular response to abiotic stimulus | 29/967 | 331/18723 | 3.94e-03 | 4.78e-02 | 29 |
| GO:010400422 | Lung | MIAC | cellular response to environmental stimulus | 29/967 | 331/18723 | 3.94e-03 | 4.78e-02 | 29 |
| GO:001021222 | Lung | MIAC | response to ionizing radiation | 16/967 | 148/18723 | 4.15e-03 | 4.93e-02 | 16 |
| GO:000697920 | Oral cavity | OSCC | response to oxidative stress | 273/7305 | 446/18723 | 8.35e-22 | 1.65e-19 | 273 |
| GO:00330448 | Oral cavity | OSCC | regulation of chromosome organization | 123/7305 | 187/18723 | 9.87e-14 | 5.17e-12 | 123 |
| GO:005105210 | Oral cavity | OSCC | regulation of DNA metabolic process | 207/7305 | 359/18723 | 4.45e-13 | 2.17e-11 | 207 |
| GO:00102128 | Oral cavity | OSCC | response to ionizing radiation | 99/7305 | 148/18723 | 5.49e-12 | 2.08e-10 | 99 |
| GO:000756818 | Oral cavity | OSCC | aging | 194/7305 | 339/18723 | 6.18e-12 | 2.33e-10 | 194 |
| GO:005105414 | Oral cavity | OSCC | positive regulation of DNA metabolic process | 126/7305 | 201/18723 | 8.12e-12 | 3.01e-10 | 126 |
| GO:00094114 | Oral cavity | OSCC | response to UV | 99/7305 | 149/18723 | 1.01e-11 | 3.70e-10 | 99 |
| GO:007121416 | Oral cavity | OSCC | cellular response to abiotic stimulus | 186/7305 | 331/18723 | 1.38e-10 | 4.10e-09 | 186 |
| GO:010400416 | Oral cavity | OSCC | cellular response to environmental stimulus | 186/7305 | 331/18723 | 1.38e-10 | 4.10e-09 | 186 |
| GO:200102017 | Oral cavity | OSCC | regulation of response to DNA damage stimulus | 131/7305 | 219/18723 | 3.21e-10 | 8.72e-09 | 131 |
| GO:000931416 | Oral cavity | OSCC | response to radiation | 241/7305 | 456/18723 | 9.76e-10 | 2.40e-08 | 241 |
| GO:000072316 | Oral cavity | OSCC | telomere maintenance | 85/7305 | 131/18723 | 1.72e-09 | 4.09e-08 | 85 |
| GO:001063918 | Oral cavity | OSCC | negative regulation of organelle organization | 190/7305 | 348/18723 | 2.12e-09 | 4.97e-08 | 190 |
| GO:00346444 | Oral cavity | OSCC | cellular response to UV | 63/7305 | 90/18723 | 2.42e-09 | 5.60e-08 | 63 |
| Page: 1 2 3 4 5 6 7 8 9 10 11 12 13 14 15 16 17 18 19 20 21 22 23 24 25 |
| Pathway ID | Tissue | Disease Stage | Description | Gene Ratio | Bg Ratio | pvalue | p.adjust | qvalue | Count |
| hsa034205 | Esophagus | HGIN | Nucleotide excision repair | 29/1383 | 63/8465 | 2.96e-08 | 5.36e-07 | 4.26e-07 | 29 |
| hsa0342012 | Esophagus | HGIN | Nucleotide excision repair | 29/1383 | 63/8465 | 2.96e-08 | 5.36e-07 | 4.26e-07 | 29 |
| hsa0342022 | Esophagus | ESCC | Nucleotide excision repair | 54/4205 | 63/8465 | 2.01e-09 | 2.17e-08 | 1.11e-08 | 54 |
| hsa015247 | Esophagus | ESCC | Platinum drug resistance | 56/4205 | 73/8465 | 1.85e-06 | 1.13e-05 | 5.78e-06 | 56 |
| hsa0342032 | Esophagus | ESCC | Nucleotide excision repair | 54/4205 | 63/8465 | 2.01e-09 | 2.17e-08 | 1.11e-08 | 54 |
| hsa0152414 | Esophagus | ESCC | Platinum drug resistance | 56/4205 | 73/8465 | 1.85e-06 | 1.13e-05 | 5.78e-06 | 56 |
| hsa015244 | Liver | Cirrhotic | Platinum drug resistance | 34/2530 | 73/8465 | 1.86e-03 | 8.37e-03 | 5.16e-03 | 34 |
| hsa03420 | Liver | Cirrhotic | Nucleotide excision repair | 29/2530 | 63/8465 | 4.81e-03 | 1.74e-02 | 1.07e-02 | 29 |
| hsa0152411 | Liver | Cirrhotic | Platinum drug resistance | 34/2530 | 73/8465 | 1.86e-03 | 8.37e-03 | 5.16e-03 | 34 |
| hsa034201 | Liver | Cirrhotic | Nucleotide excision repair | 29/2530 | 63/8465 | 4.81e-03 | 1.74e-02 | 1.07e-02 | 29 |
| hsa015242 | Liver | HCC | Platinum drug resistance | 52/4020 | 73/8465 | 3.14e-05 | 1.88e-04 | 1.04e-04 | 52 |
| hsa034202 | Liver | HCC | Nucleotide excision repair | 41/4020 | 63/8465 | 3.59e-03 | 1.12e-02 | 6.22e-03 | 41 |
| hsa015243 | Liver | HCC | Platinum drug resistance | 52/4020 | 73/8465 | 3.14e-05 | 1.88e-04 | 1.04e-04 | 52 |
| hsa034203 | Liver | HCC | Nucleotide excision repair | 41/4020 | 63/8465 | 3.59e-03 | 1.12e-02 | 6.22e-03 | 41 |
| hsa034204 | Oral cavity | OSCC | Nucleotide excision repair | 49/3704 | 63/8465 | 3.48e-08 | 2.91e-07 | 1.48e-07 | 49 |
| hsa015246 | Oral cavity | OSCC | Platinum drug resistance | 51/3704 | 73/8465 | 5.41e-06 | 2.75e-05 | 1.40e-05 | 51 |
| hsa0342011 | Oral cavity | OSCC | Nucleotide excision repair | 49/3704 | 63/8465 | 3.48e-08 | 2.91e-07 | 1.48e-07 | 49 |
| hsa0152413 | Oral cavity | OSCC | Platinum drug resistance | 51/3704 | 73/8465 | 5.41e-06 | 2.75e-05 | 1.40e-05 | 51 |
| hsa0342021 | Oral cavity | LP | Nucleotide excision repair | 37/2418 | 63/8465 | 5.14e-07 | 6.33e-06 | 4.08e-06 | 37 |
| hsa0342031 | Oral cavity | LP | Nucleotide excision repair | 37/2418 | 63/8465 | 5.14e-07 | 6.33e-06 | 4.08e-06 | 37 |
| Page: 1 2 |
Top |
Cell-cell communication analysis |
| Identification of potential cell-cell interactions between two cell types and their ligand-receptor pairs for different disease states |
| Ligand | Receptor | LRpair | Pathway | Tissue | Disease Stage |
| Page: 1 |
Top |
Single-cell gene regulatory network inference analysis |
| Find out the significant the regulons (TFs) and the target genes of each regulon across cell types for different disease states |
| TF | Cell Type | Tissue | Disease Stage | Target Gene | RSS | Regulon Activity |
| ∗The dot plots of a searched regulon are shown for all cell subpopulations in each disease state of each tissue based on the regulon specific score inferred using pySCENIC and by calculating the average expression. |
| Page: 1 |
Top |
Somatic mutation of malignant transformation related genes |
| Annotation of somatic variants for genes involved in malignant transformation |
| Hugo Symbol | Variant Class | Variant Classification | dbSNP RS | HGVSc | HGVSp | HGVSp Short | SWISSPROT | BIOTYPE | SIFT | PolyPhen | Tumor Sample Barcode | Tissue | Histology | Sex | Age | Stage | Therapy Types | Drugs | Outcome |
| ERCC1 | SNV | Missense_Mutation | novel | c.533N>G | p.Pro178Arg | p.P178R | P07992 | protein_coding | tolerated(0.09) | probably_damaging(0.989) | TCGA-A2-A0CX-01 | Breast | breast invasive carcinoma | Female | <65 | I/II | Chemotherapy | adriamycin | SD |
| ERCC1 | SNV | Missense_Mutation | c.803G>T | p.Arg268Ile | p.R268I | P07992 | protein_coding | tolerated(0.06) | benign(0.325) | TCGA-B6-A0WZ-01 | Breast | breast invasive carcinoma | Female | <65 | I/II | Unknown | Unknown | PD | |
| ERCC1 | deletion | Frame_Shift_Del | novel | c.535delN | p.Gln179SerfsTer18 | p.Q179Sfs*18 | P07992 | protein_coding | TCGA-D8-A27V-01 | Breast | breast invasive carcinoma | Female | <65 | I/II | Hormone Therapy | tamoxiphen | SD | ||
| ERCC1 | SNV | Missense_Mutation | novel | c.811N>A | p.Leu271Met | p.L271M | P07992 | protein_coding | deleterious(0.01) | probably_damaging(0.999) | TCGA-2W-A8YY-01 | Cervix | cervical & endocervical cancer | Female | <65 | I/II | Chemotherapy | cisplatin | CR |
| ERCC1 | SNV | Missense_Mutation | c.861N>T | p.Lys287Asn | p.K287N | P07992 | protein_coding | deleterious(0.01) | benign(0.022) | TCGA-AA-3510-01 | Colorectum | colon adenocarcinoma | Male | >=65 | I/II | Unknown | Unknown | SD | |
| ERCC1 | SNV | Missense_Mutation | novel | c.658G>A | p.Ala220Thr | p.A220T | P07992 | protein_coding | tolerated(0.06) | benign(0.223) | TCGA-AA-3949-01 | Colorectum | colon adenocarcinoma | Female | >=65 | III/IV | Unknown | Unknown | SD |
| ERCC1 | SNV | Missense_Mutation | c.853C>A | p.Leu285Met | p.L285M | P07992 | protein_coding | tolerated(0.09) | benign(0.125) | TCGA-AA-3977-01 | Colorectum | colon adenocarcinoma | Male | >=65 | I/II | Unknown | Unknown | SD | |
| ERCC1 | SNV | Missense_Mutation | rs772941786 | c.700N>T | p.Arg234Trp | p.R234W | P07992 | protein_coding | deleterious(0) | possibly_damaging(0.724) | TCGA-AD-6889-01 | Colorectum | colon adenocarcinoma | Male | >=65 | I/II | Chemotherapy | xeloda | PD |
| ERCC1 | SNV | Missense_Mutation | rs374992813 | c.376N>A | p.Val126Ile | p.V126I | P07992 | protein_coding | tolerated(1) | benign(0.005) | TCGA-AD-A5EJ-01 | Colorectum | colon adenocarcinoma | Female | >=65 | I/II | Unknown | Unknown | SD |
| ERCC1 | insertion | Frame_Shift_Ins | novel | c.68_69insAATTTGT | p.Pro25CysfsTer8 | p.P25Cfs*8 | P07992 | protein_coding | TCGA-D5-6898-01 | Colorectum | colon adenocarcinoma | Female | <65 | I/II | Unknown | Unknown | SD |
| Page: 1 2 3 4 |
Top |
Related drugs of malignant transformation related genes |
| Identification of chemicals and drugs interact with genes involved in malignant transfromation |
| (DGIdb 4.0) |
| Entrez ID | Symbol | Category | Interaction Types | Drug Claim Name | Drug Name | PMIDs |
| 2067 | ERCC1 | CLINICALLY ACTIONABLE, DNA REPAIR | PACLITAXEL | PACLITAXEL | 17229776 | |
| 2067 | ERCC1 | CLINICALLY ACTIONABLE, DNA REPAIR | gemcitabine | GEMCITABINE | ||
| 2067 | ERCC1 | CLINICALLY ACTIONABLE, DNA REPAIR | palonosetron | PALONOSETRON | 29177570 | |
| 2067 | ERCC1 | CLINICALLY ACTIONABLE, DNA REPAIR | CISPLATIN | CISPLATIN | 11163512,9772291,10810335,9703867 | |
| 2067 | ERCC1 | CLINICALLY ACTIONABLE, DNA REPAIR | etoposide | ETOPOSIDE | ||
| 2067 | ERCC1 | CLINICALLY ACTIONABLE, DNA REPAIR | carboplatin | CARBOPLATIN | 19786980,22188361,18347182,21902499,25069034,21057378,29662106,19362955,27498158,21262916,22026922,22329723 | |
| 2067 | ERCC1 | CLINICALLY ACTIONABLE, DNA REPAIR | radiotherapy | 25026457,28796378 | ||
| 2067 | ERCC1 | CLINICALLY ACTIONABLE, DNA REPAIR | platinum | PLATINUM | 19786980,22188361,18347182,21902499,25069034,21057378,29662106,19362955,27498158,21262916,22026922,22329723 | |
| 2067 | ERCC1 | CLINICALLY ACTIONABLE, DNA REPAIR | thalidomide | THALIDOMIDE | 21435719 | |
| 2067 | ERCC1 | CLINICALLY ACTIONABLE, DNA REPAIR | doxorubicin | DOXORUBICIN |
| Page: 1 2 3 |

Copyright 2023-Present -The University of Texas Health Science Center at Houston |