
|
|||||
|
 | |
| |
| |
| |
| |
| |
|
Gene: DCP1A |
Gene summary for DCP1A |
| Gene information | Species | Human | Gene symbol | DCP1A | Gene ID | 55802 |
| Gene name | decapping mRNA 1A | |
| Gene Alias | HSA275986 | |
| Cytomap | 3p21.1 | |
| Gene Type | protein-coding | GO ID | GO:0000184 | UniProtAcc | Q9NPI6 |
Top |
Malignant transformation analysis |
| Identification of the aberrant gene expression in precancerous and cancerous lesions by comparing the gene expression of stem-like cells in diseased tissues with normal stem cells |
| Entrez ID | Symbol | Replicates | Species | Organ | Tissue | Adj P-value | Log2FC | Malignancy |
| 55802 | DCP1A | LZE2T | Human | Esophagus | ESCC | 3.85e-02 | 2.18e-01 | 0.082 |
| 55802 | DCP1A | LZE4T | Human | Esophagus | ESCC | 5.58e-06 | 6.05e-03 | 0.0811 |
| 55802 | DCP1A | LZE7T | Human | Esophagus | ESCC | 3.77e-06 | 2.65e-01 | 0.0667 |
| 55802 | DCP1A | LZE8T | Human | Esophagus | ESCC | 3.52e-02 | -6.37e-02 | 0.067 |
| 55802 | DCP1A | LZE22D1 | Human | Esophagus | HGIN | 9.29e-05 | 2.27e-02 | 0.0595 |
| 55802 | DCP1A | LZE24T | Human | Esophagus | ESCC | 6.20e-10 | 1.33e-01 | 0.0596 |
| 55802 | DCP1A | P1T-E | Human | Esophagus | ESCC | 6.16e-07 | 2.02e-01 | 0.0875 |
| 55802 | DCP1A | P2T-E | Human | Esophagus | ESCC | 3.06e-21 | 2.22e-01 | 0.1177 |
| 55802 | DCP1A | P4T-E | Human | Esophagus | ESCC | 2.56e-22 | 3.22e-01 | 0.1323 |
| 55802 | DCP1A | P5T-E | Human | Esophagus | ESCC | 6.07e-12 | 2.84e-02 | 0.1327 |
| 55802 | DCP1A | P8T-E | Human | Esophagus | ESCC | 2.19e-23 | 1.57e-01 | 0.0889 |
| 55802 | DCP1A | P9T-E | Human | Esophagus | ESCC | 2.46e-17 | 1.12e-01 | 0.1131 |
| 55802 | DCP1A | P10T-E | Human | Esophagus | ESCC | 4.24e-16 | 2.25e-01 | 0.116 |
| 55802 | DCP1A | P11T-E | Human | Esophagus | ESCC | 1.11e-14 | 4.45e-01 | 0.1426 |
| 55802 | DCP1A | P12T-E | Human | Esophagus | ESCC | 1.15e-23 | 3.28e-01 | 0.1122 |
| 55802 | DCP1A | P15T-E | Human | Esophagus | ESCC | 1.03e-22 | 1.79e-01 | 0.1149 |
| 55802 | DCP1A | P16T-E | Human | Esophagus | ESCC | 5.89e-25 | 3.39e-01 | 0.1153 |
| 55802 | DCP1A | P17T-E | Human | Esophagus | ESCC | 2.20e-05 | 1.47e-01 | 0.1278 |
| 55802 | DCP1A | P20T-E | Human | Esophagus | ESCC | 2.20e-19 | 1.45e-01 | 0.1124 |
| 55802 | DCP1A | P21T-E | Human | Esophagus | ESCC | 4.78e-22 | 1.91e-01 | 0.1617 |
| Page: 1 2 3 4 5 |
| Tissue | Expression Dynamics | Abbreviation |
| Esophagus | 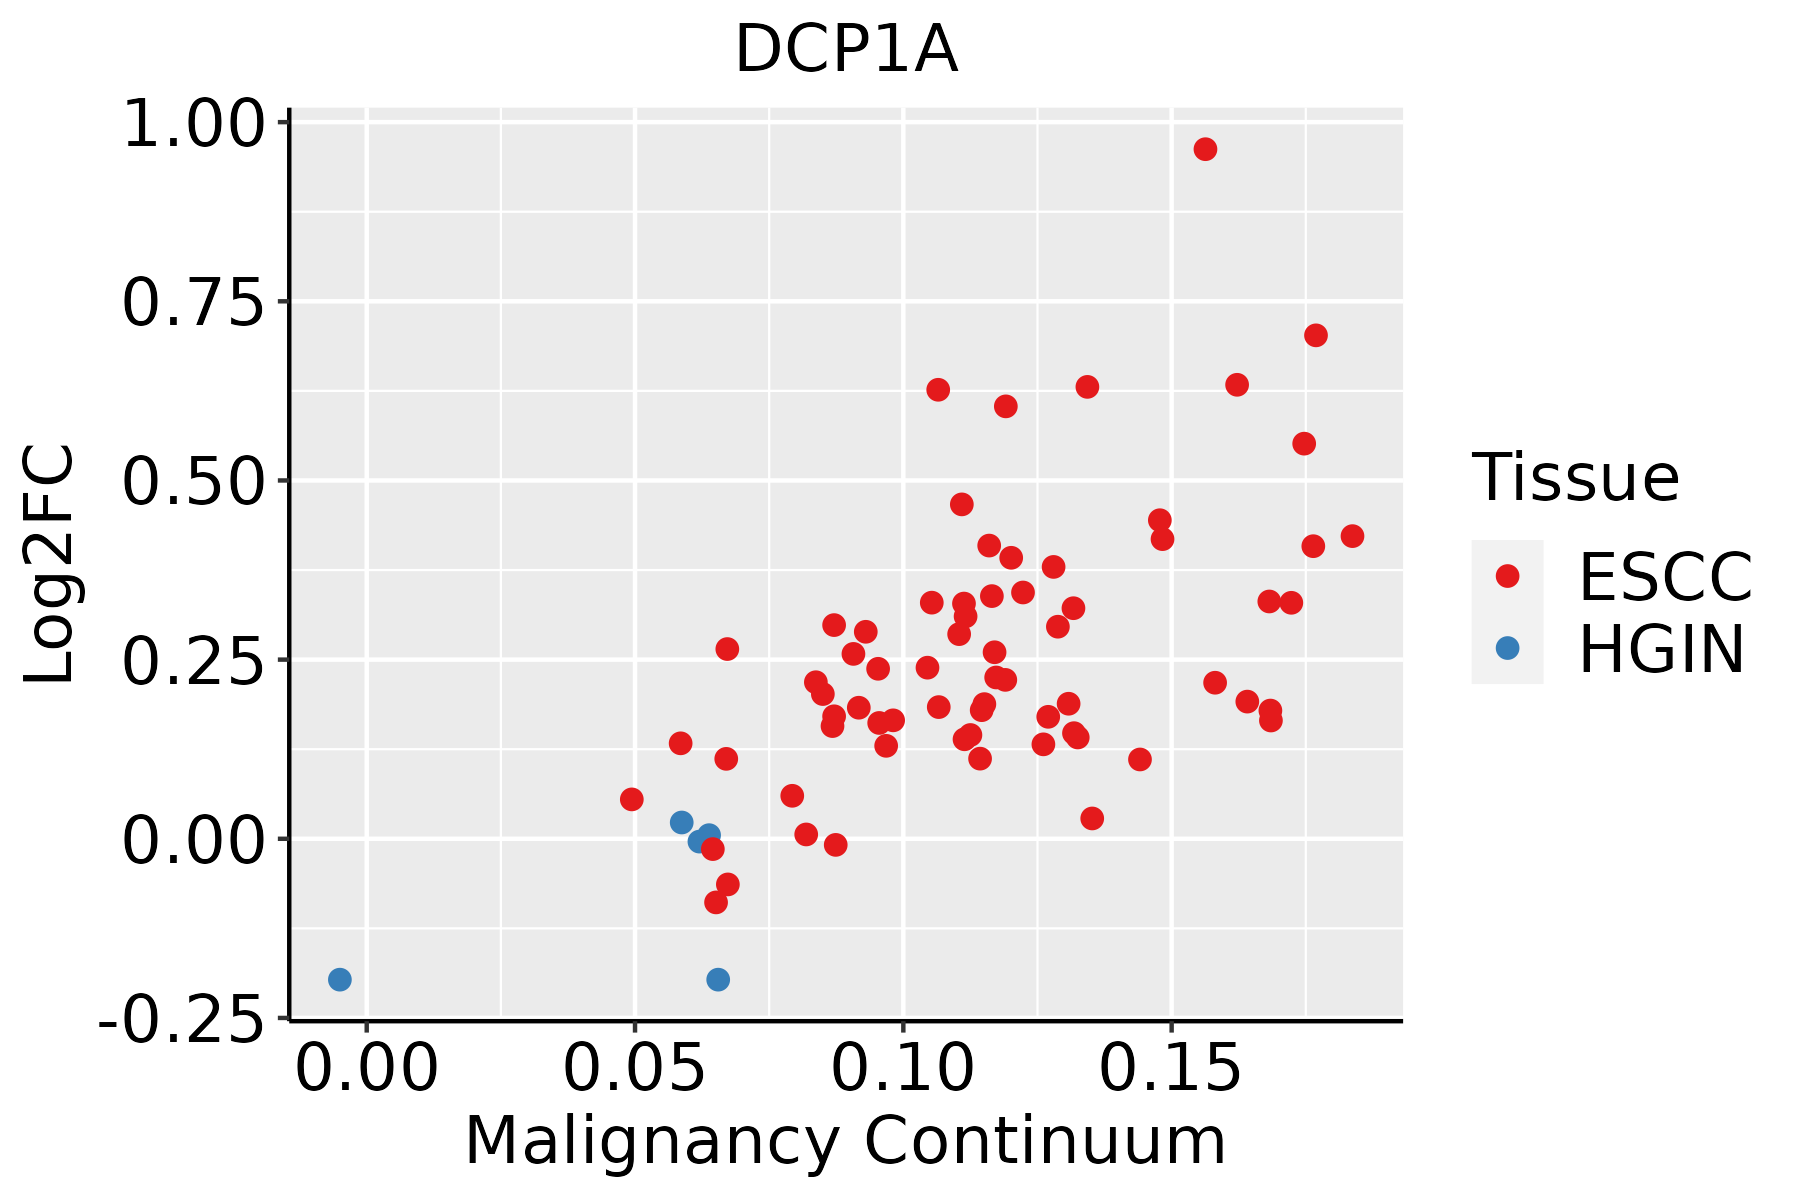 | ESCC: Esophageal squamous cell carcinoma |
| HGIN: High-grade intraepithelial neoplasias | ||
| LGIN: Low-grade intraepithelial neoplasias | ||
| Liver | 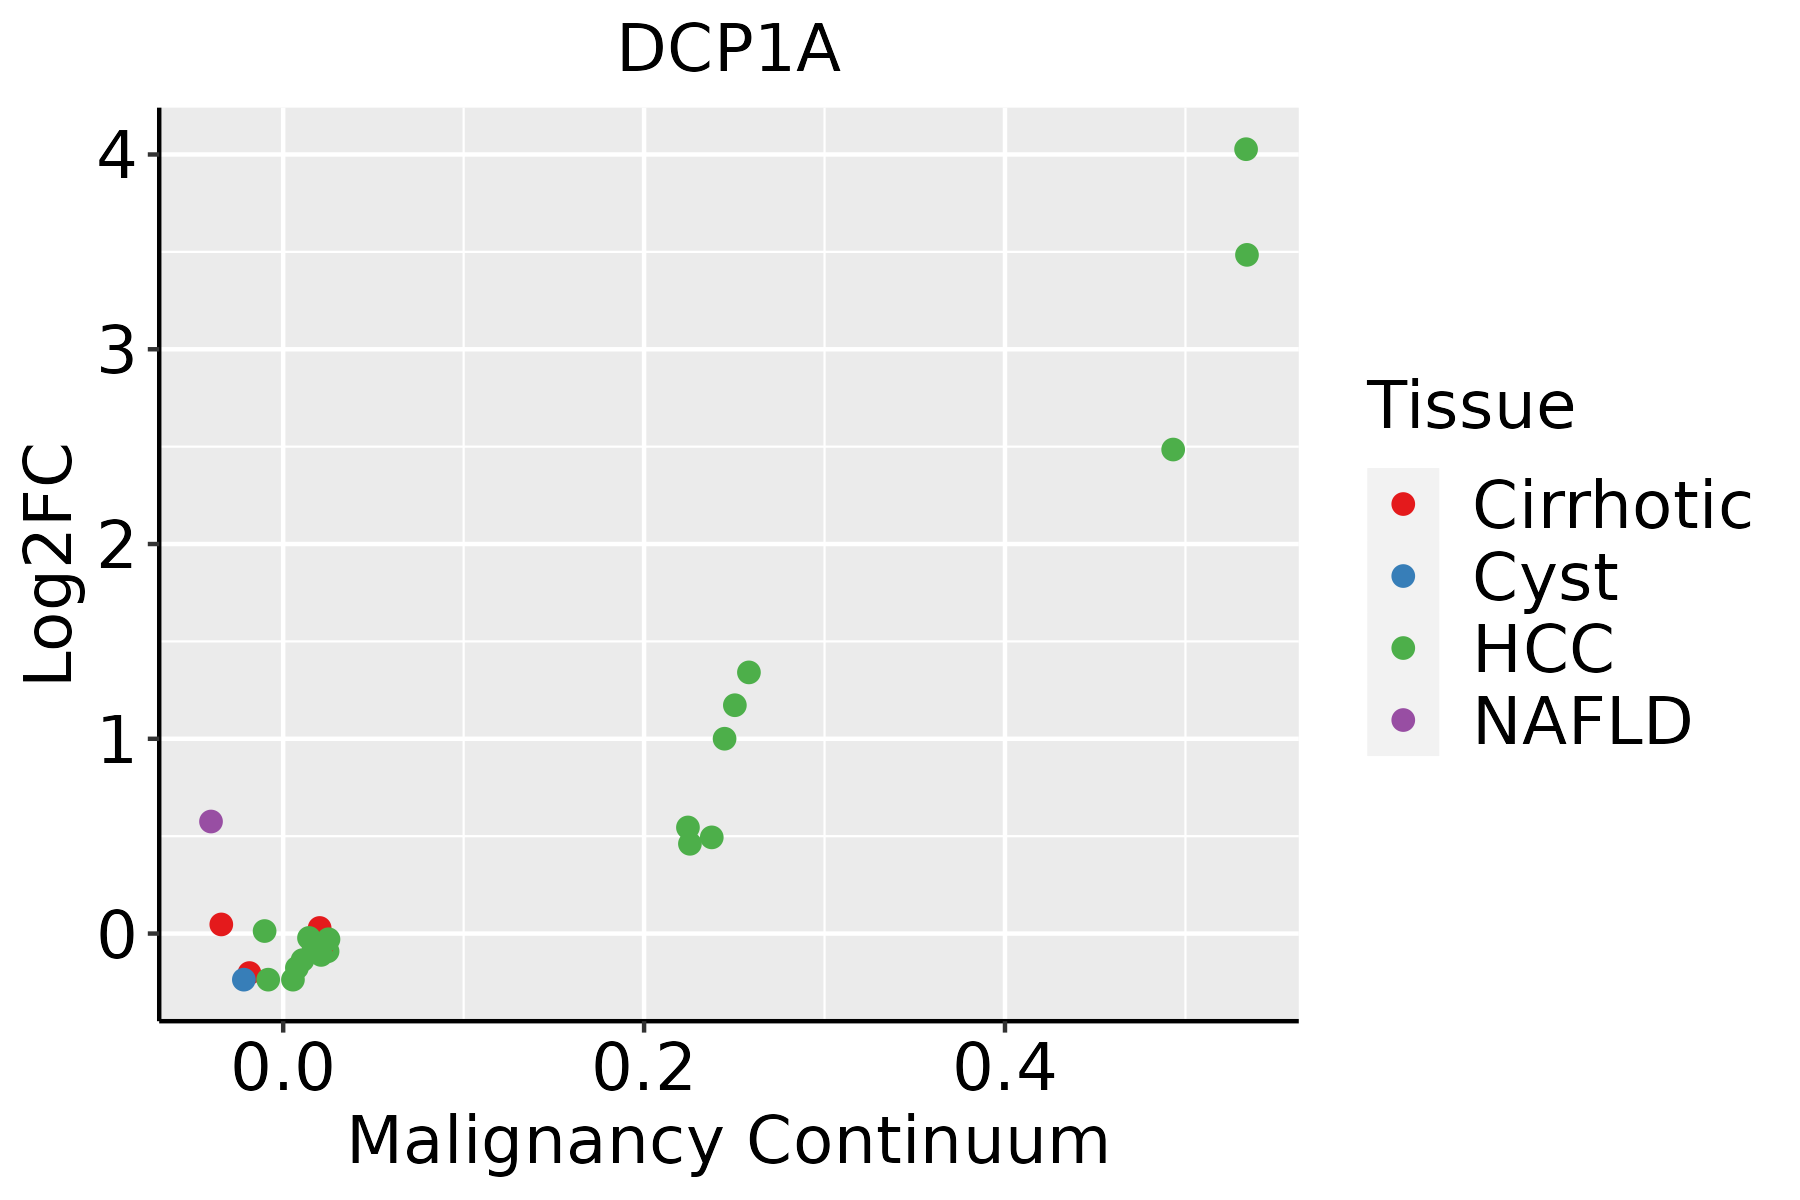 | HCC: Hepatocellular carcinoma |
| NAFLD: Non-alcoholic fatty liver disease | ||
| Oral Cavity | 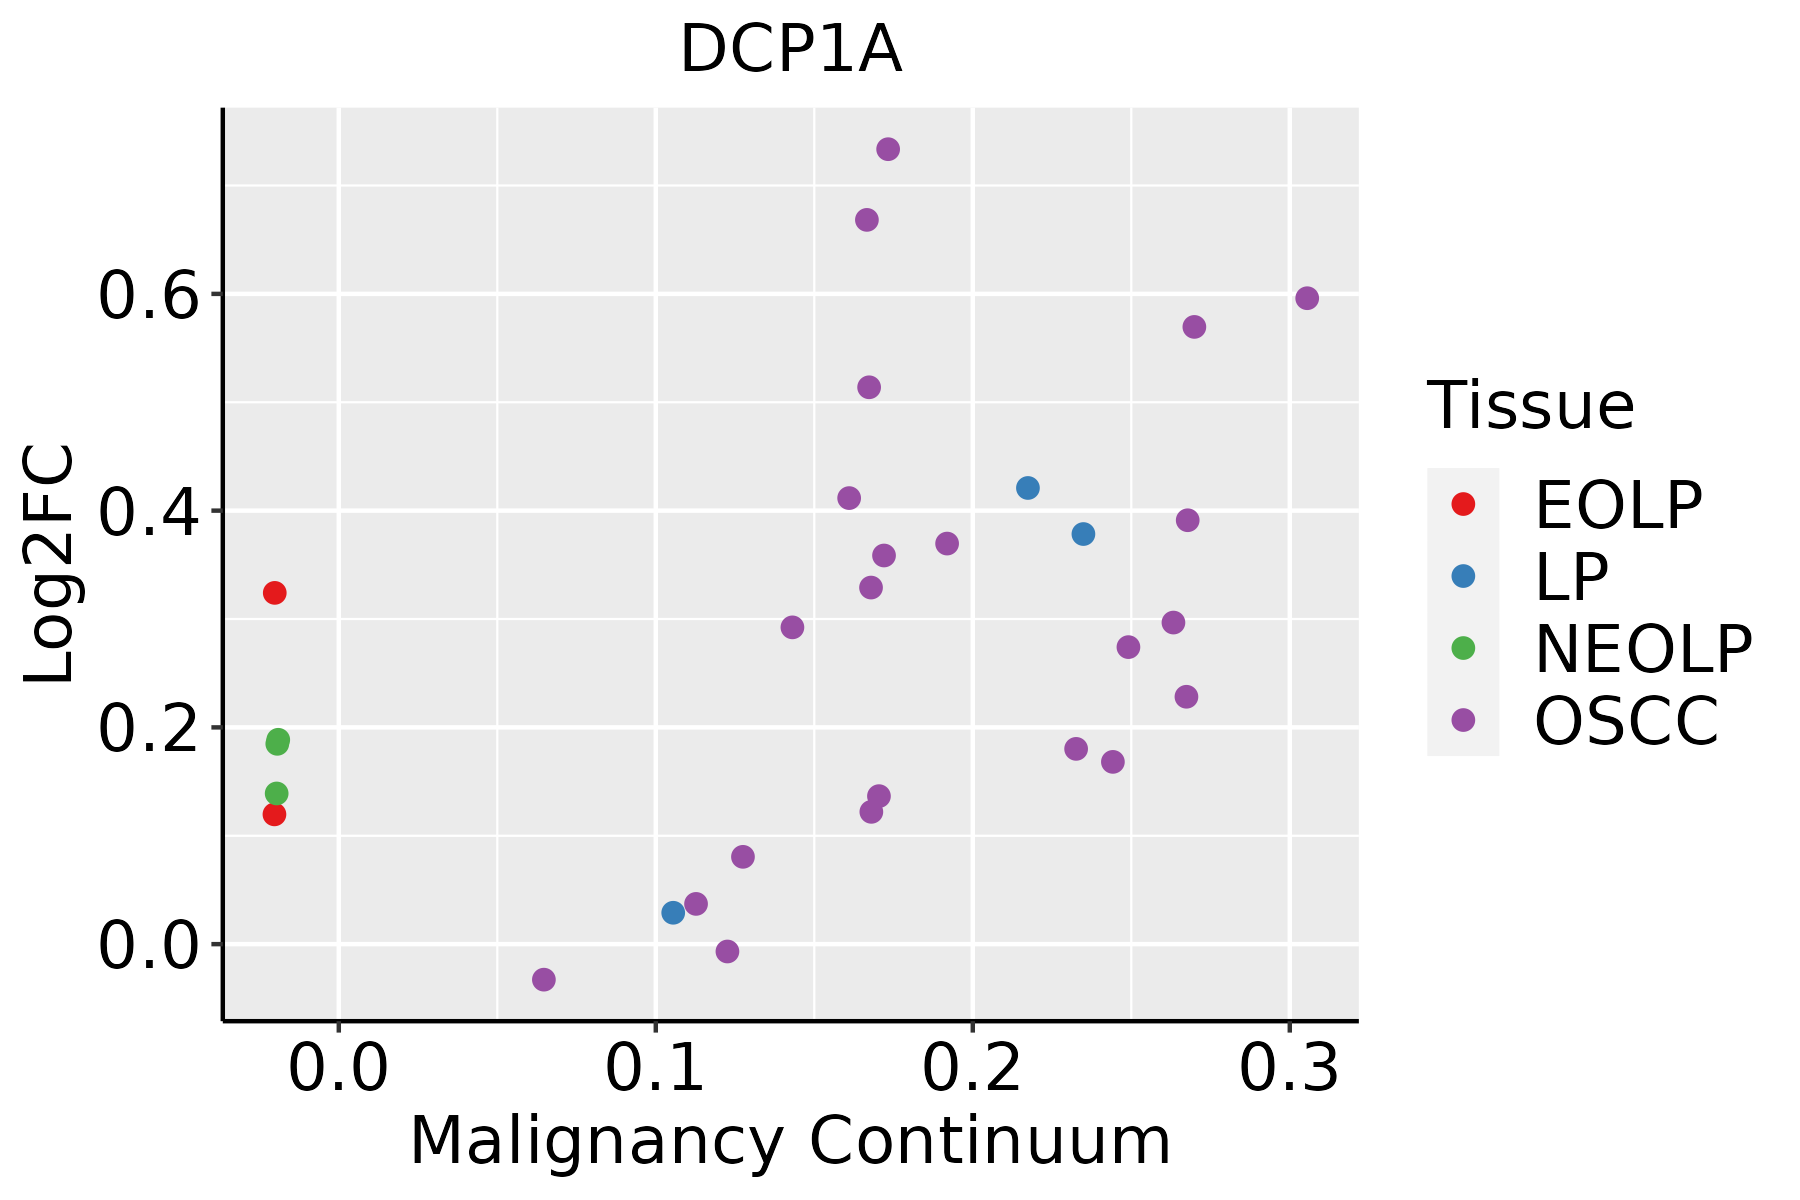 | EOLP: Erosive Oral lichen planus |
| LP: leukoplakia | ||
| NEOLP: Non-erosive oral lichen planus | ||
| OSCC: Oral squamous cell carcinoma |
| ∗log2FC in expression of this searched gene in stem-like cells from each diseased tissue sample relative to stem-like cells in normal samples in each tissue plotted against the malignancy continuum. Samples are colored based on if they are from different disease stage. |
Top |
Malignant transformation related pathway analysis |
| Find out the enriched GO biological processes and KEGG pathways involved in transition from healthy to precancer to cancer |
| Tissue | Disease Stage | Enriched GO biological Processes |
| Colorectum | AD |  |
| Colorectum | SER |  |
| Colorectum | MSS |  |
| Colorectum | MSI-H |  |
| Colorectum | FAP |  |
| ∗Top 15 enriched GO BP terms are showed in the bar plot of each disease state in each tissue. Each row represents a significant GO biological process which is colored according to the -log10(p.adjust). |
| Page: 1 2 3 4 5 6 7 8 9 |
| GO ID | Tissue | Disease Stage | Description | Gene Ratio | Bg Ratio | pvalue | p.adjust | Count |
| GO:001714822 | Oral cavity | NEOLP | negative regulation of translation | 45/2005 | 245/18723 | 2.13e-04 | 2.26e-03 | 45 |
| GO:001943931 | Oral cavity | NEOLP | aromatic compound catabolic process | 75/2005 | 467/18723 | 2.22e-04 | 2.34e-03 | 75 |
| GO:005077923 | Oral cavity | NEOLP | RNA destabilization | 21/2005 | 88/18723 | 3.17e-04 | 3.11e-03 | 21 |
| GO:190136131 | Oral cavity | NEOLP | organic cyclic compound catabolic process | 77/2005 | 495/18723 | 4.96e-04 | 4.40e-03 | 77 |
| GO:000018431 | Oral cavity | NEOLP | nuclear-transcribed mRNA catabolic process, nonsense-mediated decay | 11/2005 | 37/18723 | 1.26e-03 | 9.21e-03 | 11 |
| GO:000028822 | Oral cavity | NEOLP | nuclear-transcribed mRNA catabolic process, deadenylation-dependent decay | 13/2005 | 56/18723 | 5.38e-03 | 2.88e-02 | 13 |
| Page: 1 2 3 4 5 6 7 8 9 10 |
| Pathway ID | Tissue | Disease Stage | Description | Gene Ratio | Bg Ratio | pvalue | p.adjust | qvalue | Count |
| hsa0301810 | Esophagus | HGIN | RNA degradation | 27/1383 | 79/8465 | 7.73e-05 | 9.00e-04 | 7.15e-04 | 27 |
| hsa0301815 | Esophagus | HGIN | RNA degradation | 27/1383 | 79/8465 | 7.73e-05 | 9.00e-04 | 7.15e-04 | 27 |
| hsa0301824 | Esophagus | ESCC | RNA degradation | 62/4205 | 79/8465 | 1.18e-07 | 9.39e-07 | 4.81e-07 | 62 |
| hsa0301834 | Esophagus | ESCC | RNA degradation | 62/4205 | 79/8465 | 1.18e-07 | 9.39e-07 | 4.81e-07 | 62 |
| hsa03018 | Liver | Cirrhotic | RNA degradation | 44/2530 | 79/8465 | 1.43e-06 | 1.65e-05 | 1.02e-05 | 44 |
| hsa030181 | Liver | Cirrhotic | RNA degradation | 44/2530 | 79/8465 | 1.43e-06 | 1.65e-05 | 1.02e-05 | 44 |
| hsa030182 | Liver | HCC | RNA degradation | 58/4020 | 79/8465 | 2.29e-06 | 2.19e-05 | 1.22e-05 | 58 |
| hsa030183 | Liver | HCC | RNA degradation | 58/4020 | 79/8465 | 2.29e-06 | 2.19e-05 | 1.22e-05 | 58 |
| hsa030189 | Oral cavity | OSCC | RNA degradation | 59/3704 | 79/8465 | 2.05e-08 | 1.91e-07 | 9.70e-08 | 59 |
| hsa0301814 | Oral cavity | OSCC | RNA degradation | 59/3704 | 79/8465 | 2.05e-08 | 1.91e-07 | 9.70e-08 | 59 |
| hsa0301841 | Oral cavity | EOLP | RNA degradation | 22/1218 | 79/8465 | 1.33e-03 | 4.80e-03 | 2.83e-03 | 22 |
| hsa0301851 | Oral cavity | EOLP | RNA degradation | 22/1218 | 79/8465 | 1.33e-03 | 4.80e-03 | 2.83e-03 | 22 |
| hsa0301861 | Oral cavity | NEOLP | RNA degradation | 18/1112 | 79/8465 | 1.25e-02 | 4.06e-02 | 2.56e-02 | 18 |
| hsa0301871 | Oral cavity | NEOLP | RNA degradation | 18/1112 | 79/8465 | 1.25e-02 | 4.06e-02 | 2.56e-02 | 18 |
| Page: 1 |
Top |
Cell-cell communication analysis |
| Identification of potential cell-cell interactions between two cell types and their ligand-receptor pairs for different disease states |
| Ligand | Receptor | LRpair | Pathway | Tissue | Disease Stage |
| Page: 1 |
Top |
Single-cell gene regulatory network inference analysis |
| Find out the significant the regulons (TFs) and the target genes of each regulon across cell types for different disease states |
| TF | Cell Type | Tissue | Disease Stage | Target Gene | RSS | Regulon Activity |
| ∗The dot plots of a searched regulon are shown for all cell subpopulations in each disease state of each tissue based on the regulon specific score inferred using pySCENIC and by calculating the average expression. |
| Page: 1 |
Top |
Somatic mutation of malignant transformation related genes |
| Annotation of somatic variants for genes involved in malignant transformation |
| Hugo Symbol | Variant Class | Variant Classification | dbSNP RS | HGVSc | HGVSp | HGVSp Short | SWISSPROT | BIOTYPE | SIFT | PolyPhen | Tumor Sample Barcode | Tissue | Histology | Sex | Age | Stage | Therapy Types | Drugs | Outcome |
| DCP1A | SNV | Missense_Mutation | rs782339040 | c.496N>T | p.Asp166Tyr | p.D166Y | Q9NPI6 | protein_coding | deleterious(0) | possibly_damaging(0.844) | TCGA-A2-A0CX-01 | Breast | breast invasive carcinoma | Female | <65 | I/II | Chemotherapy | adriamycin | SD |
| DCP1A | SNV | Missense_Mutation | c.1116N>T | p.Gln372His | p.Q372H | Q9NPI6 | protein_coding | deleterious(0.03) | benign(0.022) | TCGA-AR-A24H-01 | Breast | breast invasive carcinoma | Female | >=65 | I/II | Hormone Therapy | tamoxiphen | SD | |
| DCP1A | SNV | Missense_Mutation | novel | c.1672G>A | p.Asp558Asn | p.D558N | Q9NPI6 | protein_coding | deleterious(0) | probably_damaging(0.999) | TCGA-AR-A2LE-01 | Breast | breast invasive carcinoma | Female | >=65 | I/II | Hormone Therapy | tamoxiphen | PD |
| DCP1A | insertion | Nonsense_Mutation | novel | c.447_448insTCTTCTGTTGTGCATTTTAGTTTATAAATT | p.Ser150_Asp151insSerValValHisPheSerLeuTerIleSer | p.S150_D151insSVVHFSL*IS | Q9NPI6 | protein_coding | TCGA-AO-A0JB-01 | Breast | breast invasive carcinoma | Female | <65 | III/IV | Chemotherapy | cyclophosphamide | SD | ||
| DCP1A | insertion | Nonsense_Mutation | novel | c.1003_1004insAGATTTTCCACTGGGAAAGTCTTTTTCAATTAAGACTAGGAAG | p.Leu335Ter | p.L335* | Q9NPI6 | protein_coding | TCGA-BH-A0HU-01 | Breast | breast invasive carcinoma | Female | <65 | I/II | Chemotherapy | docetaxel | SD | ||
| DCP1A | SNV | Missense_Mutation | novel | c.1552N>C | p.Glu518Gln | p.E518Q | Q9NPI6 | protein_coding | tolerated(0.05) | possibly_damaging(0.905) | TCGA-C5-A901-01 | Cervix | cervical & endocervical cancer | Female | <65 | I/II | Unknown | Unknown | SD |
| DCP1A | SNV | Missense_Mutation | c.808N>G | p.Gln270Glu | p.Q270E | Q9NPI6 | protein_coding | tolerated(0.15) | benign(0.138) | TCGA-DR-A0ZM-01 | Cervix | cervical & endocervical cancer | Female | <65 | III/IV | Unspecific | Cisplatin | SD | |
| DCP1A | SNV | Missense_Mutation | c.1148A>G | p.Asn383Ser | p.N383S | Q9NPI6 | protein_coding | tolerated(0.71) | benign(0.001) | TCGA-A6-6781-01 | Colorectum | colon adenocarcinoma | Male | <65 | III/IV | Chemotherapy | oxaliplatin | SD | |
| DCP1A | SNV | Missense_Mutation | novel | c.91G>T | p.Gly31Cys | p.G31C | Q9NPI6 | protein_coding | deleterious(0) | probably_damaging(1) | TCGA-AA-3950-01 | Colorectum | colon adenocarcinoma | Female | >=65 | I/II | Unknown | Unknown | SD |
| DCP1A | SNV | Missense_Mutation | c.226N>T | p.His76Tyr | p.H76Y | Q9NPI6 | protein_coding | deleterious(0.01) | benign(0.281) | TCGA-AA-3977-01 | Colorectum | colon adenocarcinoma | Male | >=65 | I/II | Unknown | Unknown | SD |
| Page: 1 2 3 4 5 |
Top |
Related drugs of malignant transformation related genes |
| Identification of chemicals and drugs interact with genes involved in malignant transfromation |
| (DGIdb 4.0) |
| Entrez ID | Symbol | Category | Interaction Types | Drug Claim Name | Drug Name | PMIDs |
| Page: 1 |

Copyright 2023-Present -The University of Texas Health Science Center at Houston |