
|
|||||
|
 | |
| |
| |
| |
| |
| |
|
Gene: DAXX |
Gene summary for DAXX |
| Gene information | Species | Human | Gene symbol | DAXX | Gene ID | 1616 |
| Gene name | death domain associated protein | |
| Gene Alias | BING2 | |
| Cytomap | 6p21.32 | |
| Gene Type | protein-coding | GO ID | GO:0001932 | UniProtAcc | A0A024RCS3 |
Top |
Malignant transformation analysis |
| Identification of the aberrant gene expression in precancerous and cancerous lesions by comparing the gene expression of stem-like cells in diseased tissues with normal stem cells |
| Entrez ID | Symbol | Replicates | Species | Organ | Tissue | Adj P-value | Log2FC | Malignancy |
| 1616 | DAXX | HTA11_2487_2000001011 | Human | Colorectum | SER | 1.38e-04 | 3.32e-01 | -0.1808 |
| 1616 | DAXX | HTA11_1938_2000001011 | Human | Colorectum | AD | 2.99e-07 | 3.61e-01 | -0.0811 |
| 1616 | DAXX | HTA11_347_2000001011 | Human | Colorectum | AD | 4.57e-10 | 3.78e-01 | -0.1954 |
| 1616 | DAXX | HTA11_3361_2000001011 | Human | Colorectum | AD | 4.23e-03 | 2.38e-01 | -0.1207 |
| 1616 | DAXX | HTA11_696_2000001011 | Human | Colorectum | AD | 4.20e-09 | 3.74e-01 | -0.1464 |
| 1616 | DAXX | HTA11_1391_2000001011 | Human | Colorectum | AD | 8.48e-11 | 4.58e-01 | -0.059 |
| 1616 | DAXX | HTA11_5212_2000001011 | Human | Colorectum | AD | 3.08e-02 | 2.92e-01 | -0.2061 |
| 1616 | DAXX | HTA11_546_2000001011 | Human | Colorectum | AD | 1.35e-08 | 3.58e-01 | -0.0842 |
| 1616 | DAXX | HTA11_866_3004761011 | Human | Colorectum | AD | 2.73e-08 | 3.68e-01 | 0.096 |
| 1616 | DAXX | HTA11_8622_2000001021 | Human | Colorectum | SER | 4.50e-03 | 4.22e-01 | 0.0528 |
| 1616 | DAXX | HTA11_10711_2000001011 | Human | Colorectum | AD | 8.19e-06 | 3.58e-01 | 0.0338 |
| 1616 | DAXX | HTA11_7696_3000711011 | Human | Colorectum | AD | 4.54e-08 | 3.18e-01 | 0.0674 |
| 1616 | DAXX | HTA11_6818_2000001011 | Human | Colorectum | AD | 1.21e-03 | 3.87e-01 | 0.0112 |
| 1616 | DAXX | HTA11_7469_2000001011 | Human | Colorectum | AD | 5.20e-03 | 3.84e-01 | -0.0124 |
| 1616 | DAXX | HTA11_6818_2000001021 | Human | Colorectum | AD | 9.64e-06 | 3.48e-01 | 0.0588 |
| 1616 | DAXX | HTA11_99999970781_79442 | Human | Colorectum | MSS | 6.41e-11 | 4.14e-01 | 0.294 |
| 1616 | DAXX | HTA11_99999965062_69753 | Human | Colorectum | MSI-H | 4.27e-02 | 7.37e-01 | 0.3487 |
| 1616 | DAXX | HTA11_99999965104_69814 | Human | Colorectum | MSS | 3.43e-10 | 5.44e-01 | 0.281 |
| 1616 | DAXX | HTA11_99999971662_82457 | Human | Colorectum | MSS | 2.13e-13 | 4.58e-01 | 0.3859 |
| 1616 | DAXX | HTA11_99999973899_84307 | Human | Colorectum | MSS | 1.07e-03 | 4.70e-01 | 0.2585 |
| Page: 1 2 3 4 5 6 7 |
| Tissue | Expression Dynamics | Abbreviation |
| Colorectum (GSE201348) |  | FAP: Familial adenomatous polyposis |
| CRC: Colorectal cancer | ||
| Colorectum (HTA11) |  | AD: Adenomas |
| SER: Sessile serrated lesions | ||
| MSI-H: Microsatellite-high colorectal cancer | ||
| MSS: Microsatellite stable colorectal cancer | ||
| Esophagus | 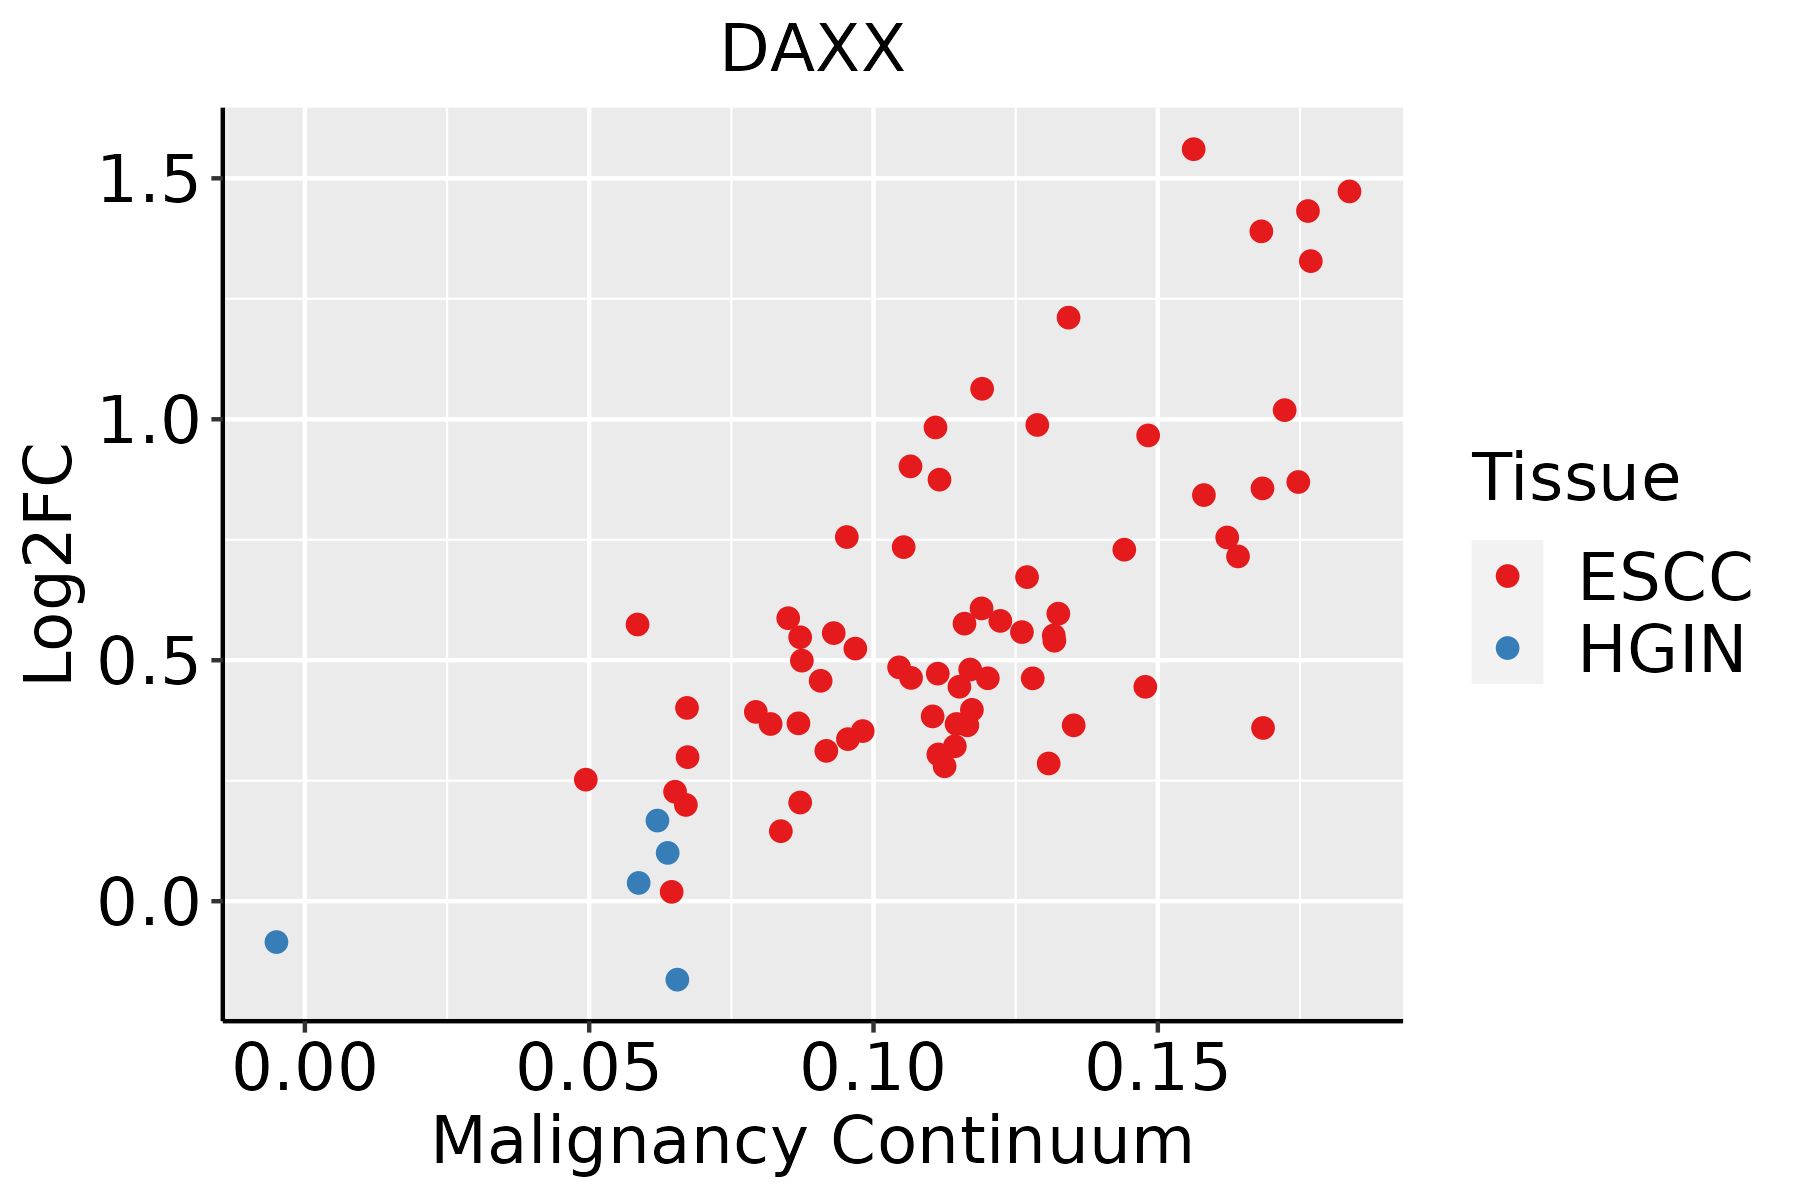 | ESCC: Esophageal squamous cell carcinoma |
| HGIN: High-grade intraepithelial neoplasias | ||
| LGIN: Low-grade intraepithelial neoplasias | ||
| Liver |  | HCC: Hepatocellular carcinoma |
| NAFLD: Non-alcoholic fatty liver disease | ||
| Oral Cavity |  | EOLP: Erosive Oral lichen planus |
| LP: leukoplakia | ||
| NEOLP: Non-erosive oral lichen planus | ||
| OSCC: Oral squamous cell carcinoma | ||
| Skin |  | AK: Actinic keratosis |
| cSCC: Cutaneous squamous cell carcinoma | ||
| SCCIS:squamous cell carcinoma in situ | ||
| Thyroid | 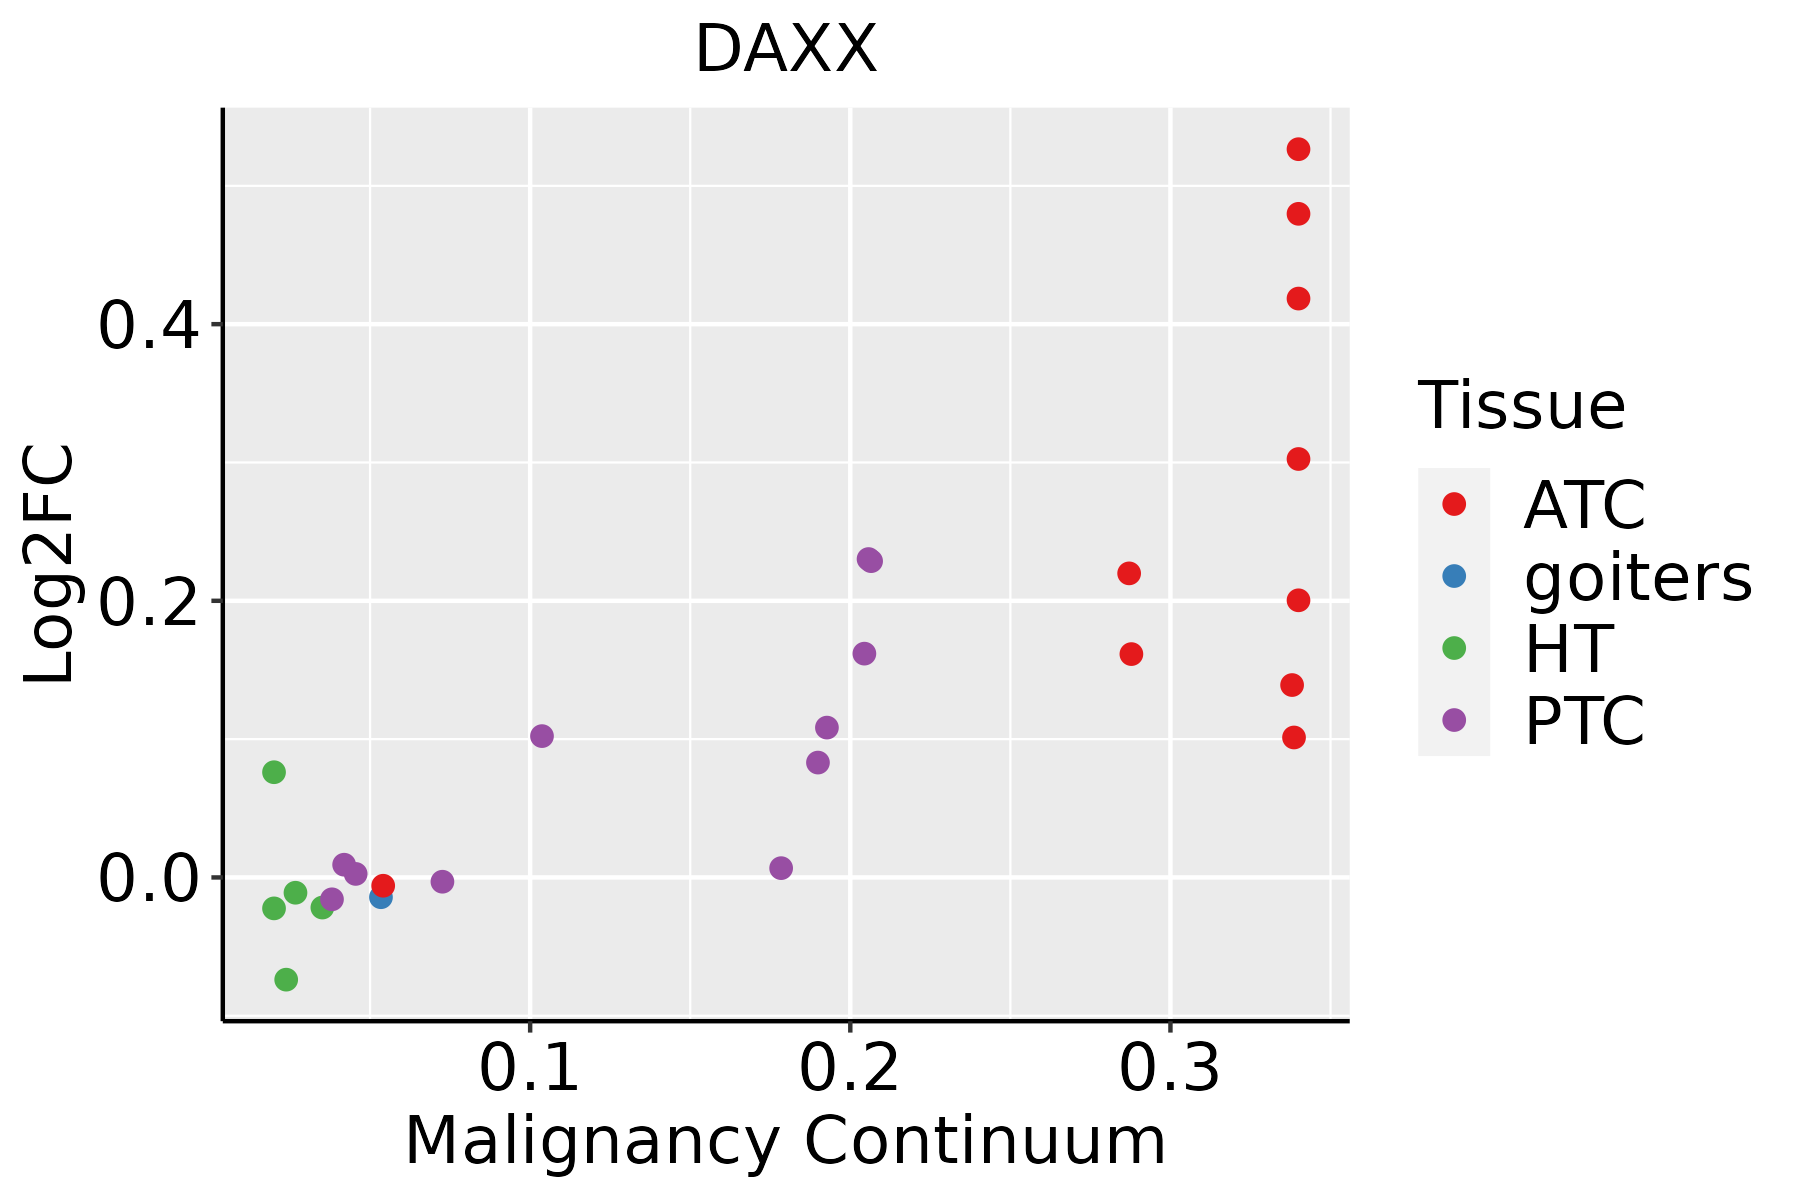 | ATC: Anaplastic thyroid cancer |
| HT: Hashimoto's thyroiditis | ||
| PTC: Papillary thyroid cancer |
| ∗log2FC in expression of this searched gene in stem-like cells from each diseased tissue sample relative to stem-like cells in normal samples in each tissue plotted against the malignancy continuum. Samples are colored based on if they are from different disease stage. |
Top |
Malignant transformation related pathway analysis |
| Find out the enriched GO biological processes and KEGG pathways involved in transition from healthy to precancer to cancer |
| Tissue | Disease Stage | Enriched GO biological Processes |
| Colorectum | AD |  |
| Colorectum | SER |  |
| Colorectum | MSS |  |
| Colorectum | MSI-H |  |
| Colorectum | FAP |  |
| ∗Top 15 enriched GO BP terms are showed in the bar plot of each disease state in each tissue. Each row represents a significant GO biological process which is colored according to the -log10(p.adjust). |
| Page: 1 2 3 4 5 6 7 8 9 |
| GO ID | Tissue | Disease Stage | Description | Gene Ratio | Bg Ratio | pvalue | p.adjust | Count |
| GO:00092666 | Liver | Cirrhotic | response to temperature stimulus | 63/4634 | 178/18723 | 9.38e-04 | 6.66e-03 | 63 |
| GO:00712766 | Liver | Cirrhotic | cellular response to cadmium ion | 19/4634 | 40/18723 | 1.49e-03 | 9.87e-03 | 19 |
| GO:00712805 | Liver | Cirrhotic | cellular response to copper ion | 14/4634 | 28/18723 | 3.40e-03 | 1.89e-02 | 14 |
| GO:004586011 | Liver | Cirrhotic | positive regulation of protein kinase activity | 117/4634 | 386/18723 | 7.07e-03 | 3.41e-02 | 117 |
| GO:00466886 | Liver | Cirrhotic | response to copper ion | 18/4634 | 42/18723 | 7.64e-03 | 3.61e-02 | 18 |
| GO:003596612 | Liver | HCC | response to topologically incorrect protein | 123/7958 | 159/18723 | 2.60e-19 | 3.44e-17 | 123 |
| GO:190332022 | Liver | HCC | regulation of protein modification by small protein conjugation or removal | 167/7958 | 242/18723 | 4.99e-17 | 4.72e-15 | 167 |
| GO:000698612 | Liver | HCC | response to unfolded protein | 103/7958 | 137/18723 | 6.50e-15 | 4.48e-13 | 103 |
| GO:003596712 | Liver | HCC | cellular response to topologically incorrect protein | 89/7958 | 116/18723 | 5.61e-14 | 3.39e-12 | 89 |
| GO:003139622 | Liver | HCC | regulation of protein ubiquitination | 142/7958 | 210/18723 | 1.39e-13 | 7.81e-12 | 142 |
| GO:003052222 | Liver | HCC | intracellular receptor signaling pathway | 171/7958 | 265/18723 | 3.00e-13 | 1.61e-11 | 171 |
| GO:004854522 | Liver | HCC | response to steroid hormone | 206/7958 | 339/18723 | 6.81e-12 | 2.92e-10 | 206 |
| GO:009719122 | Liver | HCC | extrinsic apoptotic signaling pathway | 143/7958 | 219/18723 | 6.99e-12 | 2.97e-10 | 143 |
| GO:003462012 | Liver | HCC | cellular response to unfolded protein | 71/7958 | 96/18723 | 3.70e-10 | 1.22e-08 | 71 |
| GO:007138322 | Liver | HCC | cellular response to steroid hormone stimulus | 128/7958 | 204/18723 | 3.92e-09 | 1.04e-07 | 128 |
| GO:003460512 | Liver | HCC | cellular response to heat | 53/7958 | 69/18723 | 6.62e-09 | 1.70e-07 | 53 |
| GO:000940811 | Liver | HCC | response to heat | 76/7958 | 110/18723 | 1.48e-08 | 3.58e-07 | 76 |
| GO:001003822 | Liver | HCC | response to metal ion | 208/7958 | 373/18723 | 1.35e-07 | 2.56e-06 | 208 |
| GO:007099722 | Liver | HCC | neuron death | 202/7958 | 361/18723 | 1.44e-07 | 2.70e-06 | 202 |
| GO:190121412 | Liver | HCC | regulation of neuron death | 179/7958 | 319/18723 | 5.65e-07 | 9.01e-06 | 179 |
| Page: 1 2 3 4 5 6 7 8 9 10 11 12 13 14 15 16 17 18 19 |
| Pathway ID | Tissue | Disease Stage | Description | Gene Ratio | Bg Ratio | pvalue | p.adjust | qvalue | Count |
| hsa05012 | Colorectum | AD | Parkinson disease | 147/2092 | 266/8465 | 2.53e-27 | 8.48e-25 | 5.41e-25 | 147 |
| hsa05014 | Colorectum | AD | Amyotrophic lateral sclerosis | 164/2092 | 364/8465 | 4.28e-18 | 1.27e-16 | 8.09e-17 | 164 |
| hsa05022 | Colorectum | AD | Pathways of neurodegeneration - multiple diseases | 201/2092 | 476/8465 | 4.54e-18 | 1.27e-16 | 8.09e-17 | 201 |
| hsa050121 | Colorectum | AD | Parkinson disease | 147/2092 | 266/8465 | 2.53e-27 | 8.48e-25 | 5.41e-25 | 147 |
| hsa050141 | Colorectum | AD | Amyotrophic lateral sclerosis | 164/2092 | 364/8465 | 4.28e-18 | 1.27e-16 | 8.09e-17 | 164 |
| hsa050221 | Colorectum | AD | Pathways of neurodegeneration - multiple diseases | 201/2092 | 476/8465 | 4.54e-18 | 1.27e-16 | 8.09e-17 | 201 |
| hsa050122 | Colorectum | SER | Parkinson disease | 132/1580 | 266/8465 | 2.72e-31 | 9.03e-29 | 6.55e-29 | 132 |
| hsa050222 | Colorectum | SER | Pathways of neurodegeneration - multiple diseases | 168/1580 | 476/8465 | 6.23e-19 | 2.07e-17 | 1.50e-17 | 168 |
| hsa050142 | Colorectum | SER | Amyotrophic lateral sclerosis | 138/1580 | 364/8465 | 9.89e-19 | 2.99e-17 | 2.17e-17 | 138 |
| hsa050123 | Colorectum | SER | Parkinson disease | 132/1580 | 266/8465 | 2.72e-31 | 9.03e-29 | 6.55e-29 | 132 |
| hsa050223 | Colorectum | SER | Pathways of neurodegeneration - multiple diseases | 168/1580 | 476/8465 | 6.23e-19 | 2.07e-17 | 1.50e-17 | 168 |
| hsa050143 | Colorectum | SER | Amyotrophic lateral sclerosis | 138/1580 | 364/8465 | 9.89e-19 | 2.99e-17 | 2.17e-17 | 138 |
| hsa050124 | Colorectum | MSS | Parkinson disease | 140/1875 | 266/8465 | 2.32e-28 | 7.79e-26 | 4.77e-26 | 140 |
| hsa050224 | Colorectum | MSS | Pathways of neurodegeneration - multiple diseases | 192/1875 | 476/8465 | 2.79e-20 | 1.04e-18 | 6.36e-19 | 192 |
| hsa050144 | Colorectum | MSS | Amyotrophic lateral sclerosis | 156/1875 | 364/8465 | 1.43e-19 | 4.62e-18 | 2.83e-18 | 156 |
| hsa04210 | Colorectum | MSS | Apoptosis | 44/1875 | 136/8465 | 3.66e-03 | 1.66e-02 | 1.01e-02 | 44 |
| hsa050125 | Colorectum | MSS | Parkinson disease | 140/1875 | 266/8465 | 2.32e-28 | 7.79e-26 | 4.77e-26 | 140 |
| hsa050225 | Colorectum | MSS | Pathways of neurodegeneration - multiple diseases | 192/1875 | 476/8465 | 2.79e-20 | 1.04e-18 | 6.36e-19 | 192 |
| hsa050145 | Colorectum | MSS | Amyotrophic lateral sclerosis | 156/1875 | 364/8465 | 1.43e-19 | 4.62e-18 | 2.83e-18 | 156 |
| hsa042101 | Colorectum | MSS | Apoptosis | 44/1875 | 136/8465 | 3.66e-03 | 1.66e-02 | 1.01e-02 | 44 |
| Page: 1 2 3 4 |
Top |
Cell-cell communication analysis |
| Identification of potential cell-cell interactions between two cell types and their ligand-receptor pairs for different disease states |
| Ligand | Receptor | LRpair | Pathway | Tissue | Disease Stage |
| Page: 1 |
Top |
Single-cell gene regulatory network inference analysis |
| Find out the significant the regulons (TFs) and the target genes of each regulon across cell types for different disease states |
| TF | Cell Type | Tissue | Disease Stage | Target Gene | RSS | Regulon Activity |
| ∗The dot plots of a searched regulon are shown for all cell subpopulations in each disease state of each tissue based on the regulon specific score inferred using pySCENIC and by calculating the average expression. |
| Page: 1 |
Top |
Somatic mutation of malignant transformation related genes |
| Annotation of somatic variants for genes involved in malignant transformation |
| Hugo Symbol | Variant Class | Variant Classification | dbSNP RS | HGVSc | HGVSp | HGVSp Short | SWISSPROT | BIOTYPE | SIFT | PolyPhen | Tumor Sample Barcode | Tissue | Histology | Sex | Age | Stage | Therapy Types | Drugs | Outcome |
| DAXX | SNV | Missense_Mutation | novel | c.2185G>A | p.Asp729Asn | p.D729N | Q9UER7 | protein_coding | deleterious(0) | probably_damaging(0.999) | TCGA-AN-A046-01 | Breast | breast invasive carcinoma | Female | >=65 | I/II | Unknown | Unknown | SD |
| DAXX | SNV | Missense_Mutation | c.1142T>G | p.Met381Arg | p.M381R | Q9UER7 | protein_coding | tolerated(0.42) | benign(0.359) | TCGA-AR-A24U-01 | Breast | breast invasive carcinoma | Female | <65 | I/II | Chemotherapy | doxorubicin | SD | |
| DAXX | SNV | Missense_Mutation | rs758422357 | c.1042N>A | p.Val348Ile | p.V348I | Q9UER7 | protein_coding | tolerated(1) | benign(0.003) | TCGA-LD-A74U-01 | Breast | breast invasive carcinoma | Female | >=65 | III/IV | Chemotherapy | taxotere | SD |
| DAXX | SNV | Missense_Mutation | novel | c.427C>A | p.Leu143Met | p.L143M | Q9UER7 | protein_coding | tolerated(0.12) | benign(0.312) | TCGA-OL-A6VQ-01 | Breast | breast invasive carcinoma | Female | <65 | I/II | Unknown | Unknown | SD |
| DAXX | SNV | Missense_Mutation | rs763046918 | c.2105N>T | p.Ser702Phe | p.S702F | Q9UER7 | protein_coding | tolerated(0.26) | benign(0.003) | TCGA-JW-A5VL-01 | Cervix | cervical & endocervical cancer | Female | <65 | I/II | Unknown | Unknown | SD |
| DAXX | SNV | Missense_Mutation | novel | c.514N>A | p.Glu172Lys | p.E172K | Q9UER7 | protein_coding | tolerated(0.16) | benign(0.111) | TCGA-JW-A5VL-01 | Cervix | cervical & endocervical cancer | Female | <65 | I/II | Unknown | Unknown | SD |
| DAXX | SNV | Missense_Mutation | rs375012684 | c.1318N>A | p.Asp440Asn | p.D440N | Q9UER7 | protein_coding | tolerated(0.17) | benign(0.085) | TCGA-AA-3811-01 | Colorectum | colon adenocarcinoma | Female | >=65 | III/IV | Unknown | Unknown | PD |
| DAXX | SNV | Missense_Mutation | c.8N>T | p.Thr3Ile | p.T3I | Q9UER7 | protein_coding | deleterious(0.02) | possibly_damaging(0.452) | TCGA-AU-6004-01 | Colorectum | colon adenocarcinoma | Female | >=65 | I/II | Unknown | Unknown | SD | |
| DAXX | SNV | Missense_Mutation | c.202N>A | p.Glu68Lys | p.E68K | Q9UER7 | protein_coding | tolerated(0.22) | benign(0.003) | TCGA-AZ-4315-01 | Colorectum | colon adenocarcinoma | Male | <65 | I/II | Unknown | Unknown | SD | |
| DAXX | SNV | Missense_Mutation | c.1210N>T | p.His404Tyr | p.H404Y | Q9UER7 | protein_coding | tolerated(0.46) | benign(0.158) | TCGA-CK-4951-01 | Colorectum | colon adenocarcinoma | Female | >=65 | I/II | Unknown | Unknown | PD |
| Page: 1 2 3 4 5 6 7 8 |
Top |
Related drugs of malignant transformation related genes |
| Identification of chemicals and drugs interact with genes involved in malignant transfromation |
| (DGIdb 4.0) |
| Entrez ID | Symbol | Category | Interaction Types | Drug Claim Name | Drug Name | PMIDs |
| Page: 1 |

Copyright 2023-Present -The University of Texas Health Science Center at Houston |