
|
|||||
|
 | |
| |
| |
| |
| |
| |
|
Gene: CRYAB |
Gene summary for CRYAB |
| Gene information | Species | Human | Gene symbol | CRYAB | Gene ID | 1410 |
| Gene name | crystallin alpha B | |
| Gene Alias | CMD1II | |
| Cytomap | 11q23.1 | |
| Gene Type | protein-coding | GO ID | GO:0000165 | UniProtAcc | P02511 |
Top |
Malignant transformation analysis |
| Identification of the aberrant gene expression in precancerous and cancerous lesions by comparing the gene expression of stem-like cells in diseased tissues with normal stem cells |
| Entrez ID | Symbol | Replicates | Species | Organ | Tissue | Adj P-value | Log2FC | Malignancy |
| 1410 | CRYAB | GSM4909277 | Human | Breast | Precancer | 3.28e-08 | 1.17e+00 | 0.0177 |
| 1410 | CRYAB | GSM4909281 | Human | Breast | IDC | 8.79e-10 | 4.72e-01 | 0.21 |
| 1410 | CRYAB | GSM4909285 | Human | Breast | IDC | 4.93e-26 | 6.48e-01 | 0.21 |
| 1410 | CRYAB | GSM4909286 | Human | Breast | IDC | 1.72e-09 | -6.37e-02 | 0.1081 |
| 1410 | CRYAB | GSM4909290 | Human | Breast | IDC | 1.98e-23 | -9.20e-01 | 0.2096 |
| 1410 | CRYAB | GSM4909291 | Human | Breast | IDC | 1.20e-14 | -8.52e-01 | 0.1753 |
| 1410 | CRYAB | GSM4909292 | Human | Breast | IDC | 1.61e-05 | -9.72e-01 | 0.1236 |
| 1410 | CRYAB | GSM4909293 | Human | Breast | IDC | 2.21e-23 | -8.01e-01 | 0.1581 |
| 1410 | CRYAB | GSM4909294 | Human | Breast | IDC | 3.02e-31 | -8.58e-01 | 0.2022 |
| 1410 | CRYAB | GSM4909296 | Human | Breast | IDC | 9.33e-29 | -8.60e-01 | 0.1524 |
| 1410 | CRYAB | GSM4909297 | Human | Breast | IDC | 2.25e-37 | -8.90e-01 | 0.1517 |
| 1410 | CRYAB | GSM4909298 | Human | Breast | IDC | 1.64e-22 | -7.83e-01 | 0.1551 |
| 1410 | CRYAB | GSM4909299 | Human | Breast | IDC | 6.73e-11 | 4.71e-01 | 0.035 |
| 1410 | CRYAB | GSM4909300 | Human | Breast | IDC | 4.14e-02 | 2.96e-01 | 0.0334 |
| 1410 | CRYAB | GSM4909301 | Human | Breast | IDC | 1.72e-47 | -9.64e-01 | 0.1577 |
| 1410 | CRYAB | GSM4909302 | Human | Breast | IDC | 7.22e-23 | -8.09e-01 | 0.1545 |
| 1410 | CRYAB | GSM4909304 | Human | Breast | IDC | 2.09e-35 | -9.28e-01 | 0.1636 |
| 1410 | CRYAB | GSM4909306 | Human | Breast | IDC | 9.39e-16 | -6.53e-01 | 0.1564 |
| 1410 | CRYAB | GSM4909307 | Human | Breast | IDC | 7.18e-09 | -3.94e-01 | 0.1569 |
| 1410 | CRYAB | GSM4909308 | Human | Breast | IDC | 3.75e-38 | -9.72e-01 | 0.158 |
| Page: 1 2 3 4 5 6 7 8 9 |
| Tissue | Expression Dynamics | Abbreviation |
| Breast | 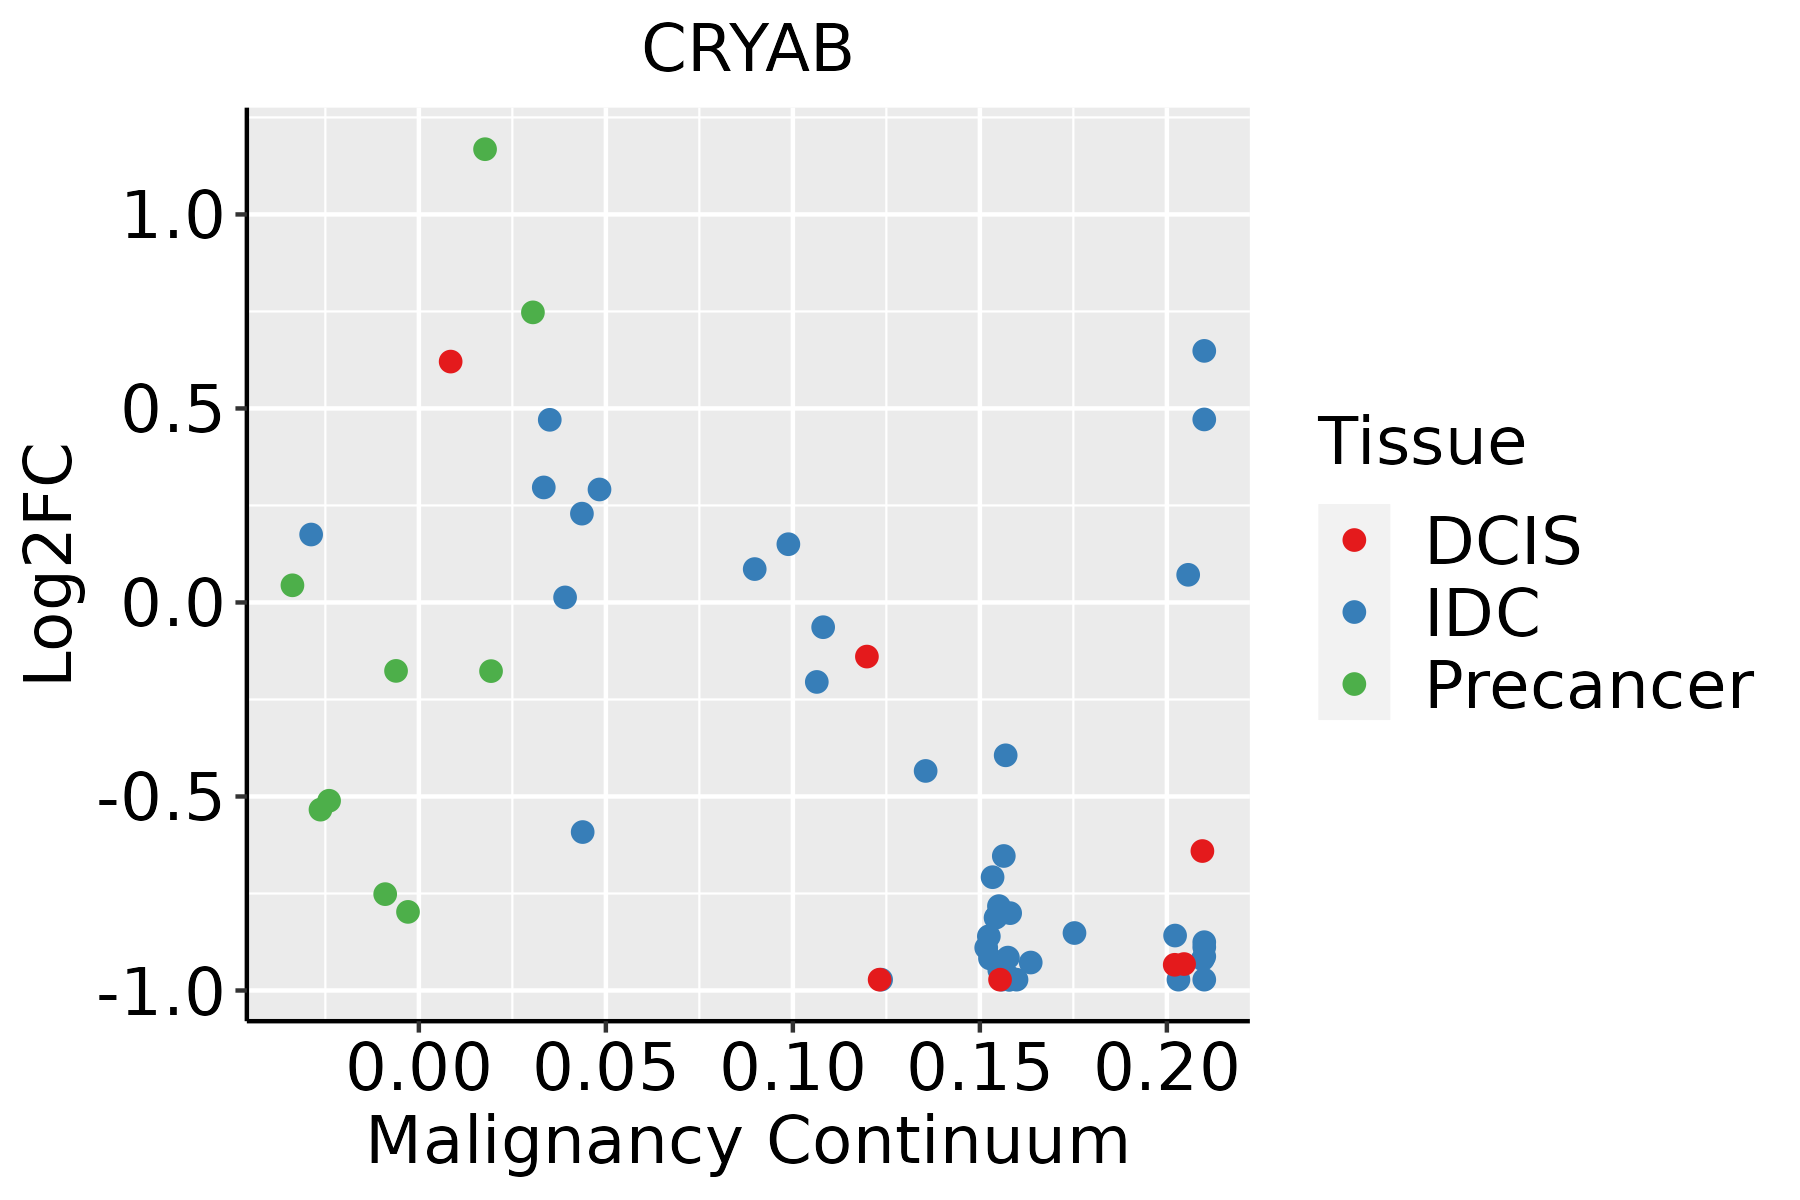 | IDC: Invasive ductal carcinoma |
| DCIS: Ductal carcinoma in situ | ||
| Precancer(BRCA1-mut): Precancerous lesion from BRCA1 mutation carriers | ||
| Cervix | 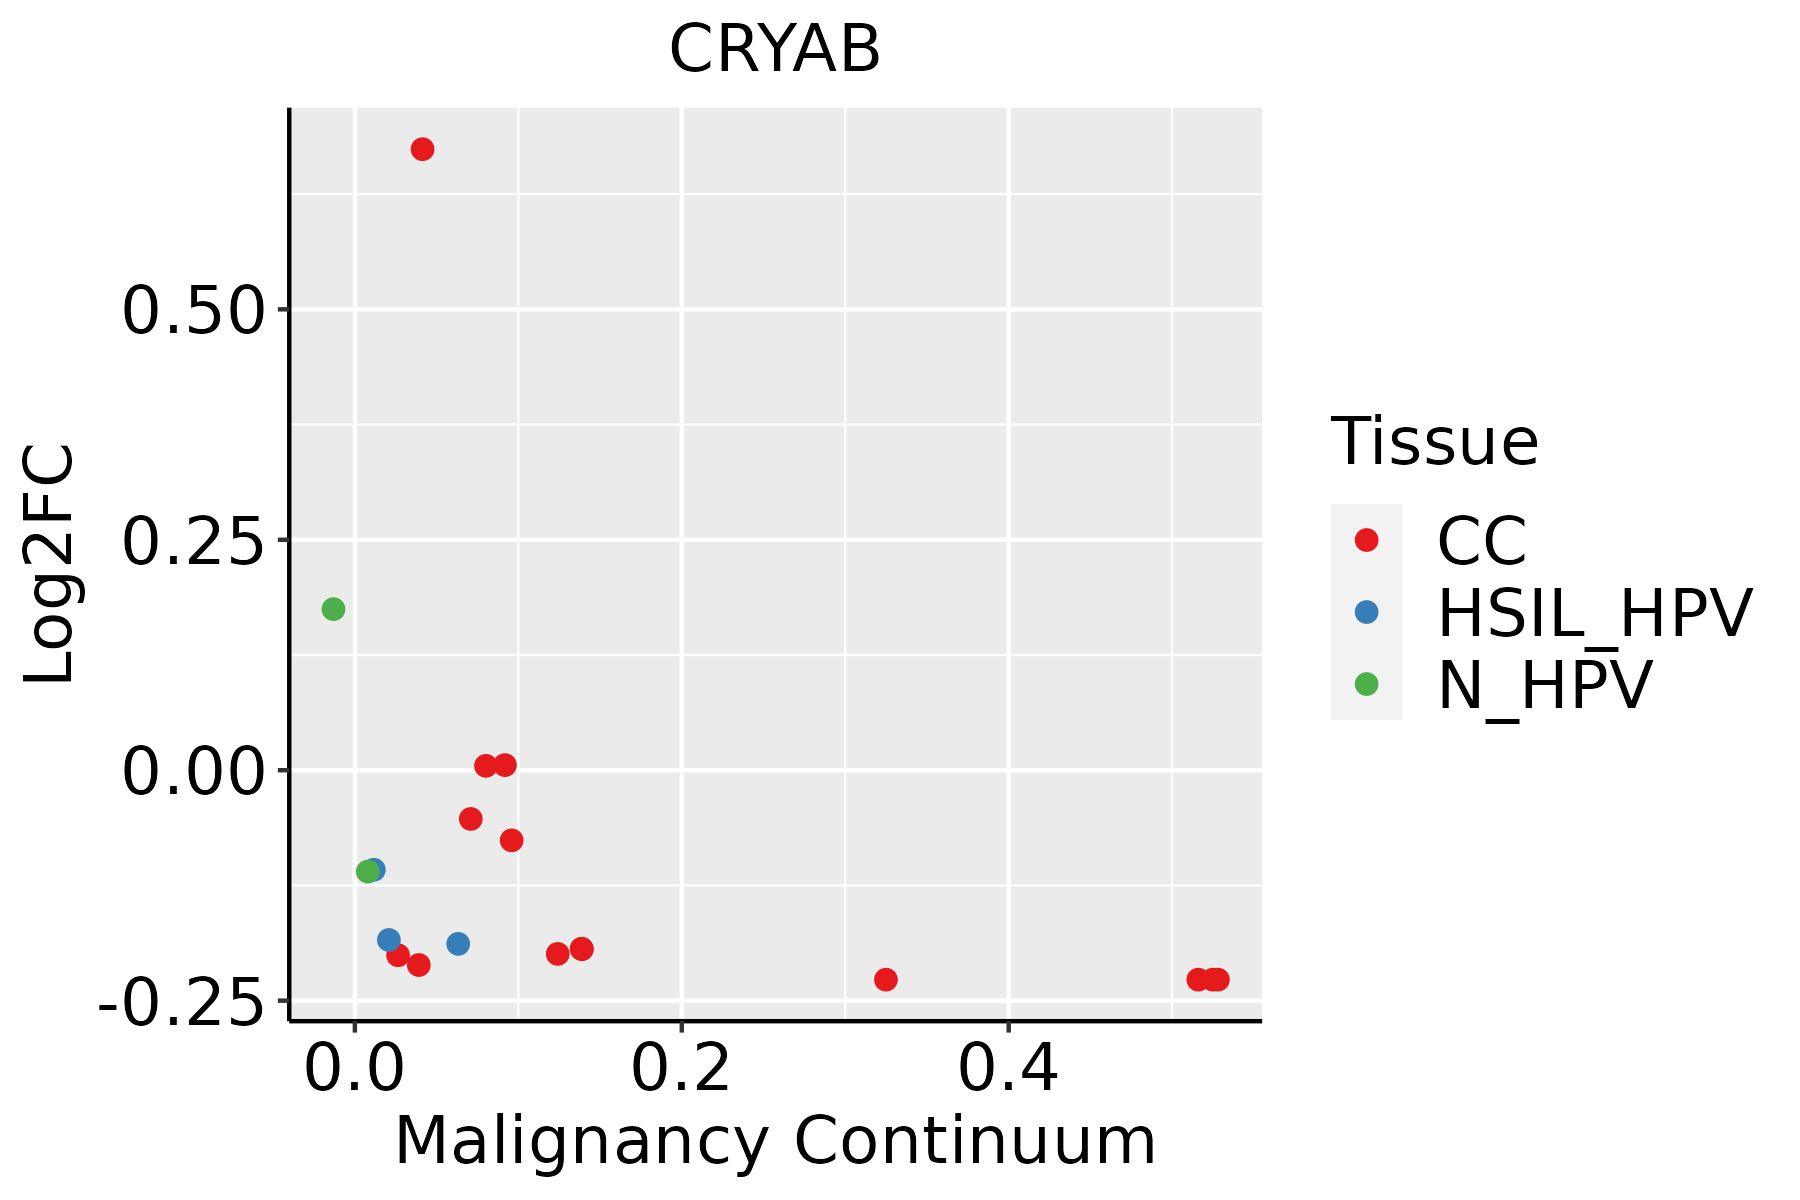 | CC: Cervix cancer |
| HSIL_HPV: HPV-infected high-grade squamous intraepithelial lesions | ||
| N_HPV: HPV-infected normal cervix | ||
| Esophagus | 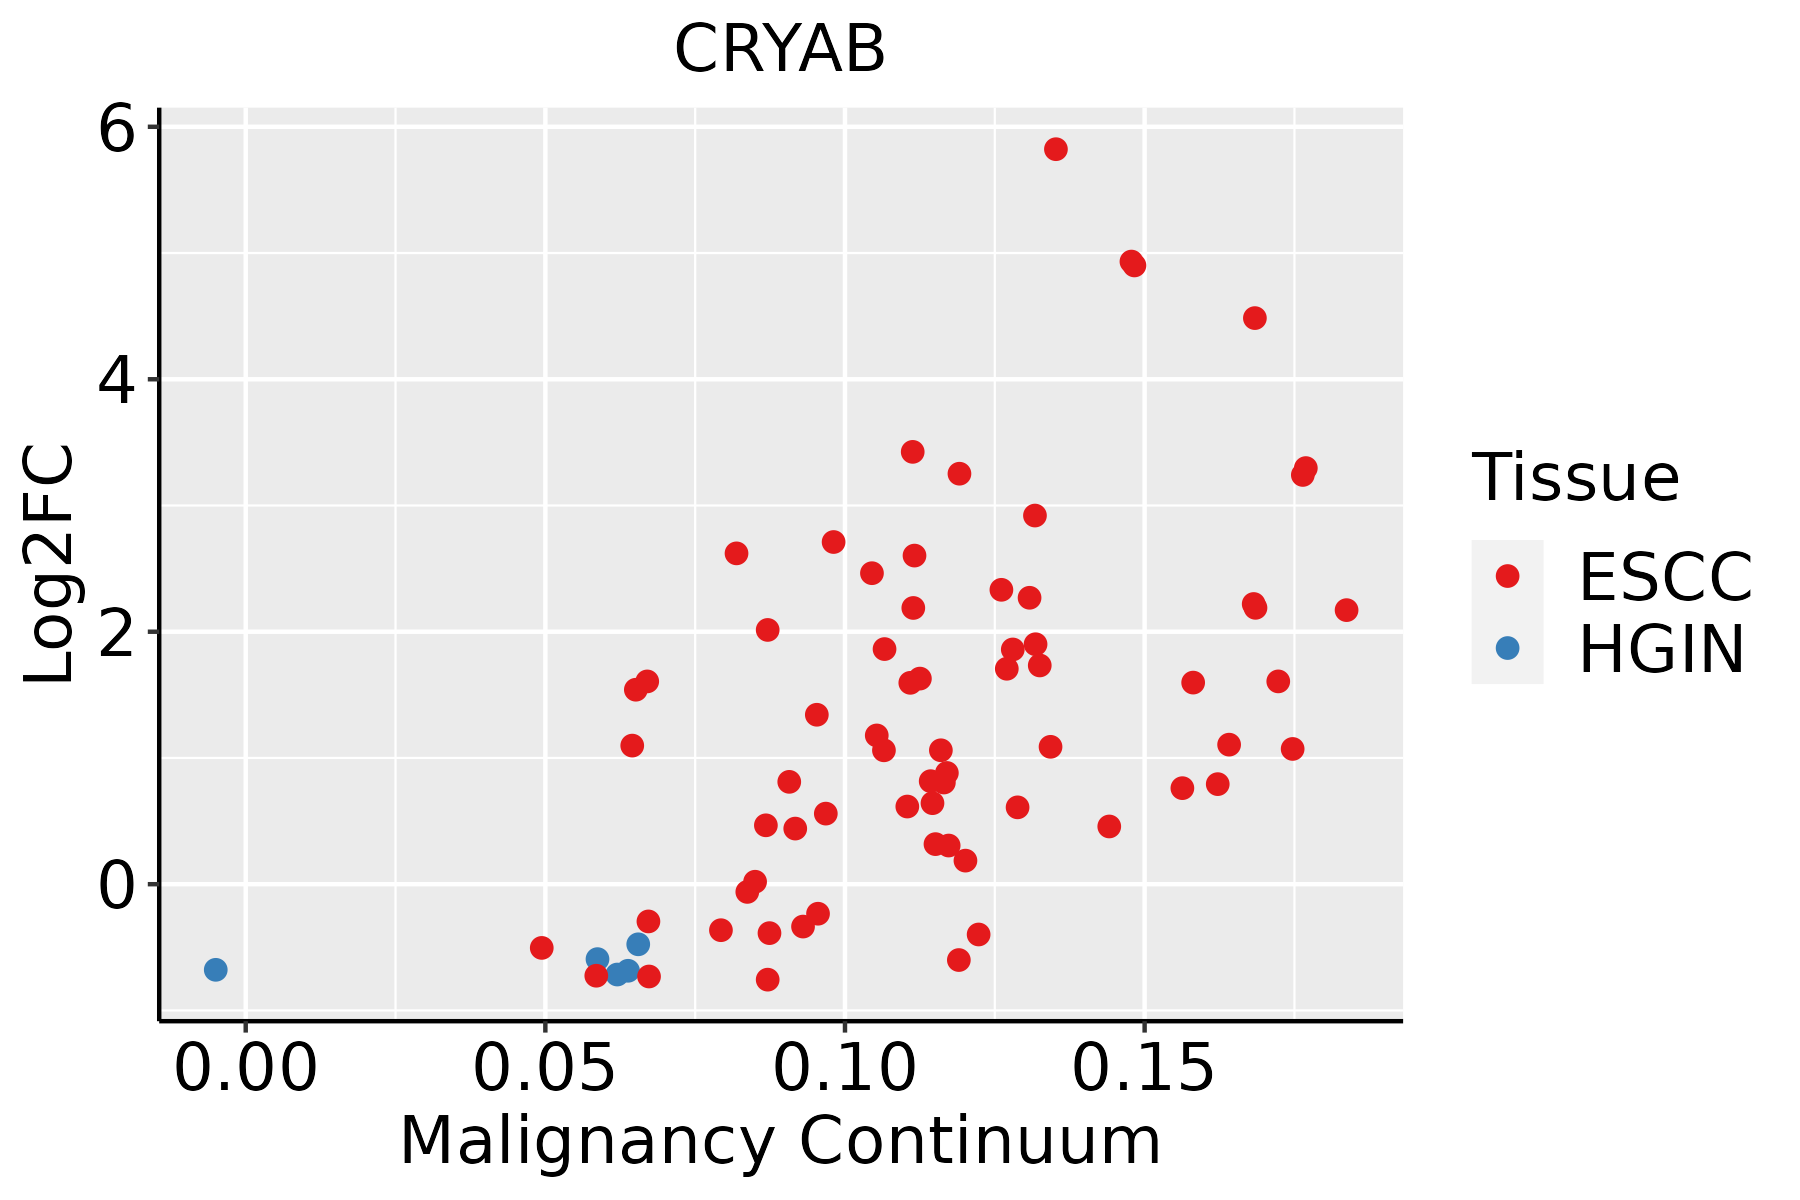 | ESCC: Esophageal squamous cell carcinoma |
| HGIN: High-grade intraepithelial neoplasias | ||
| LGIN: Low-grade intraepithelial neoplasias | ||
| Liver | 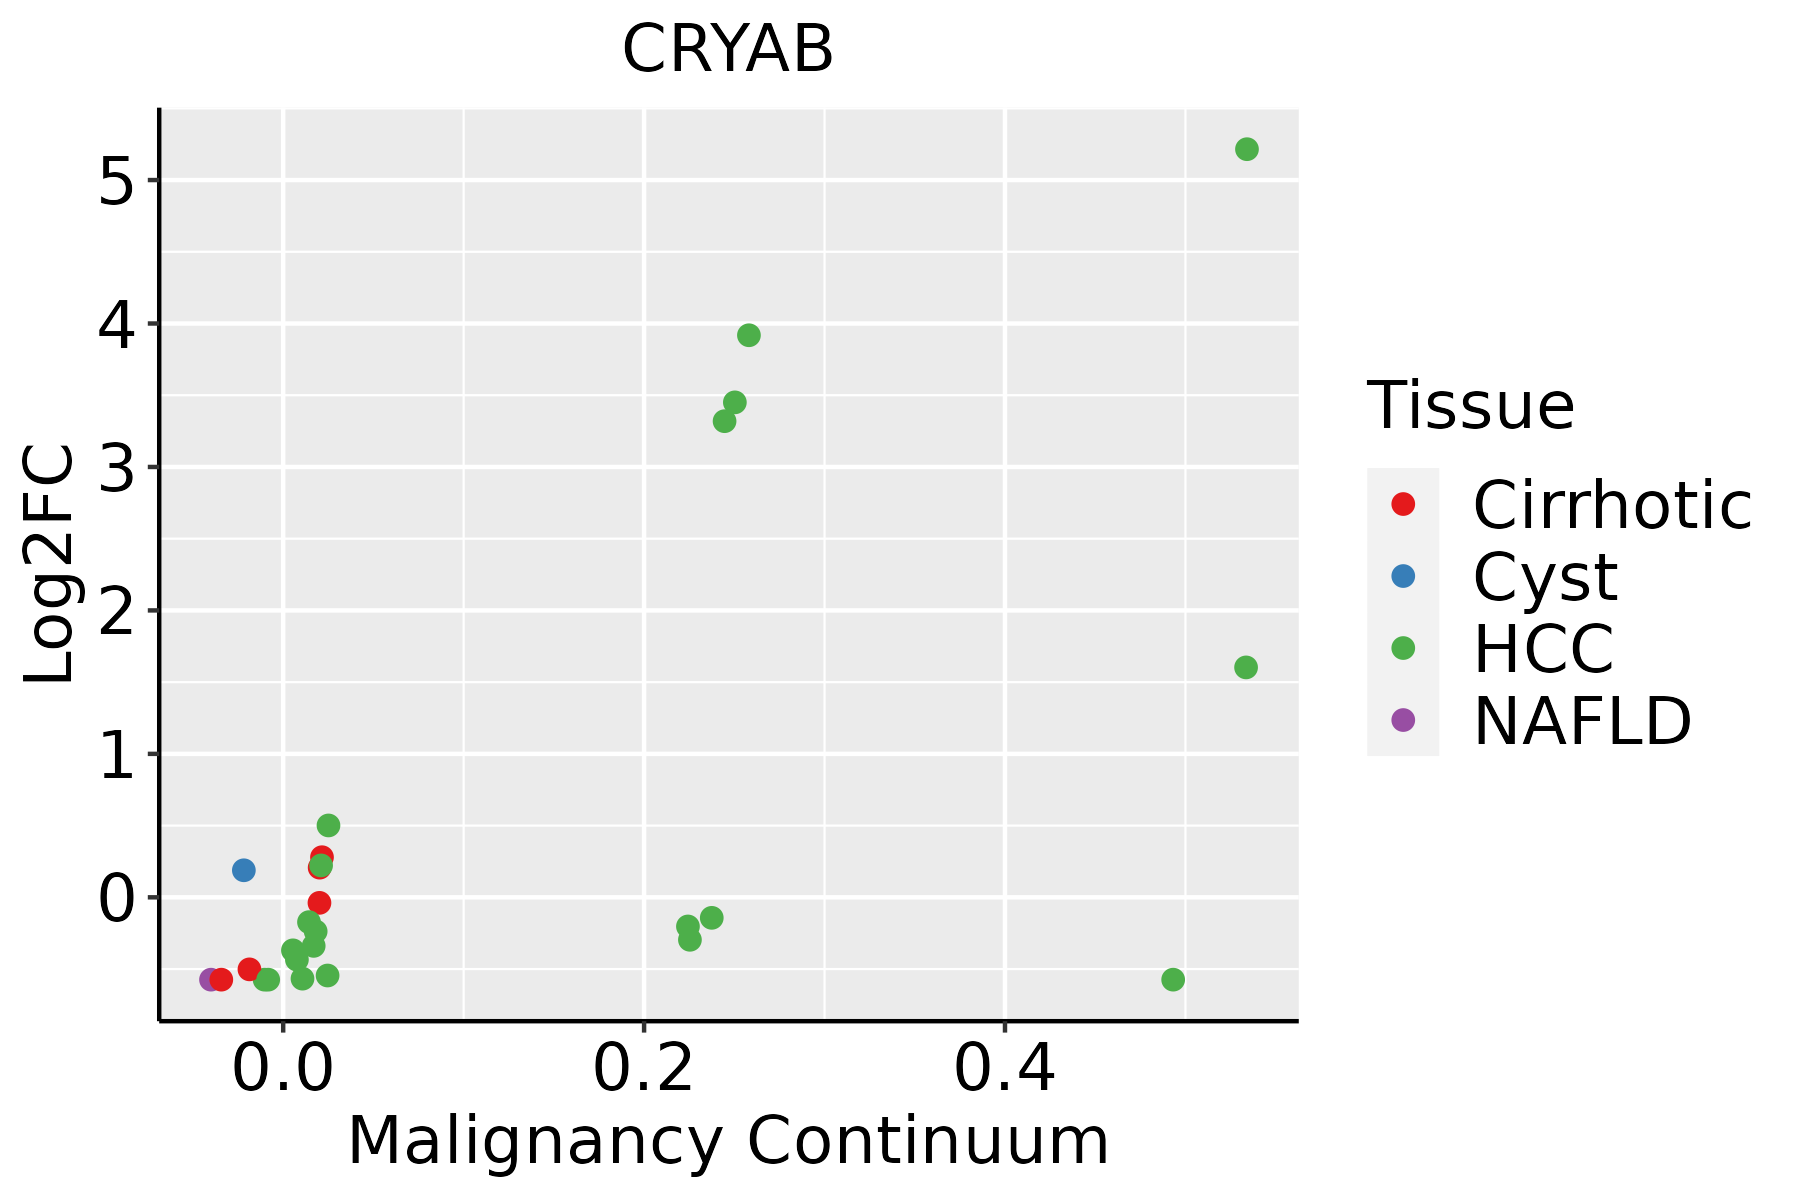 | HCC: Hepatocellular carcinoma |
| NAFLD: Non-alcoholic fatty liver disease | ||
| Oral Cavity | 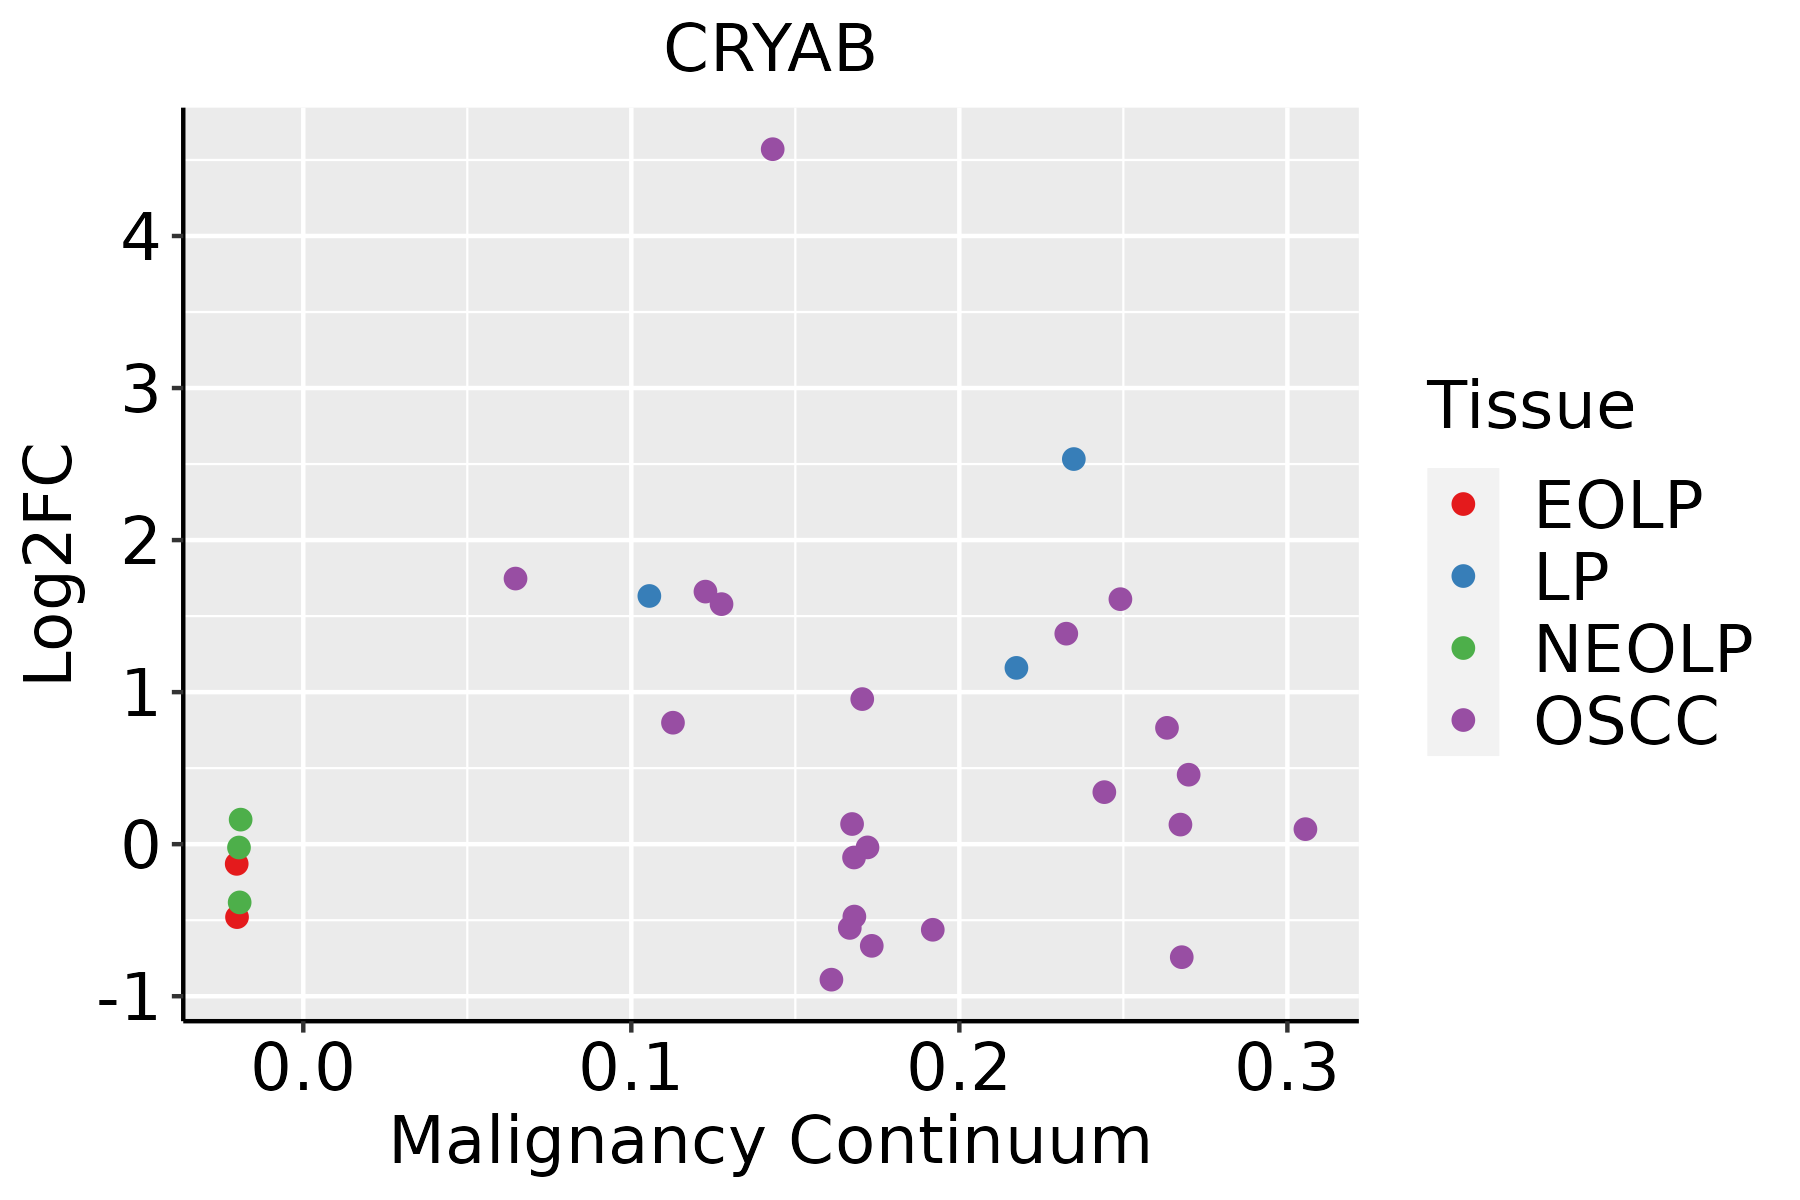 | EOLP: Erosive Oral lichen planus |
| LP: leukoplakia | ||
| NEOLP: Non-erosive oral lichen planus | ||
| OSCC: Oral squamous cell carcinoma | ||
| Prostate | 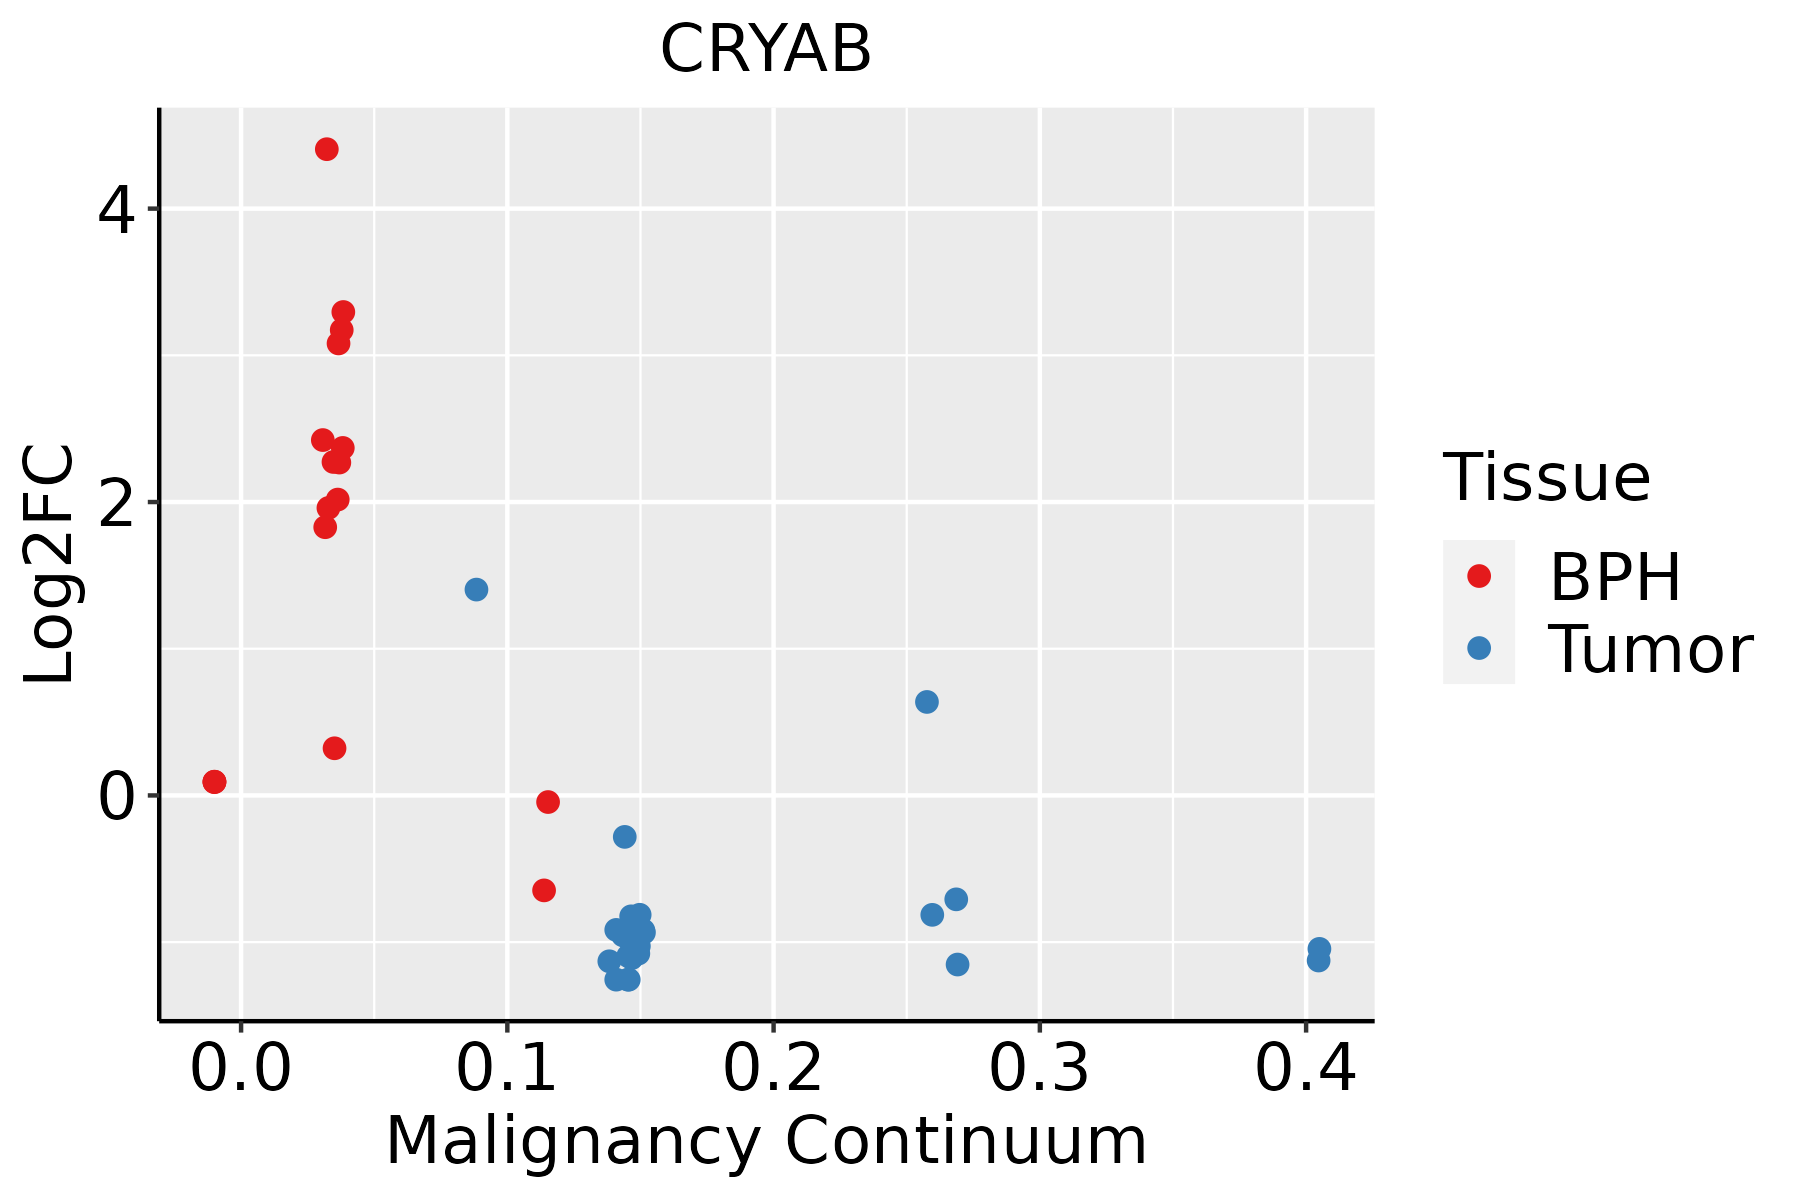 | BPH: Benign Prostatic Hyperplasia |
| Skin | 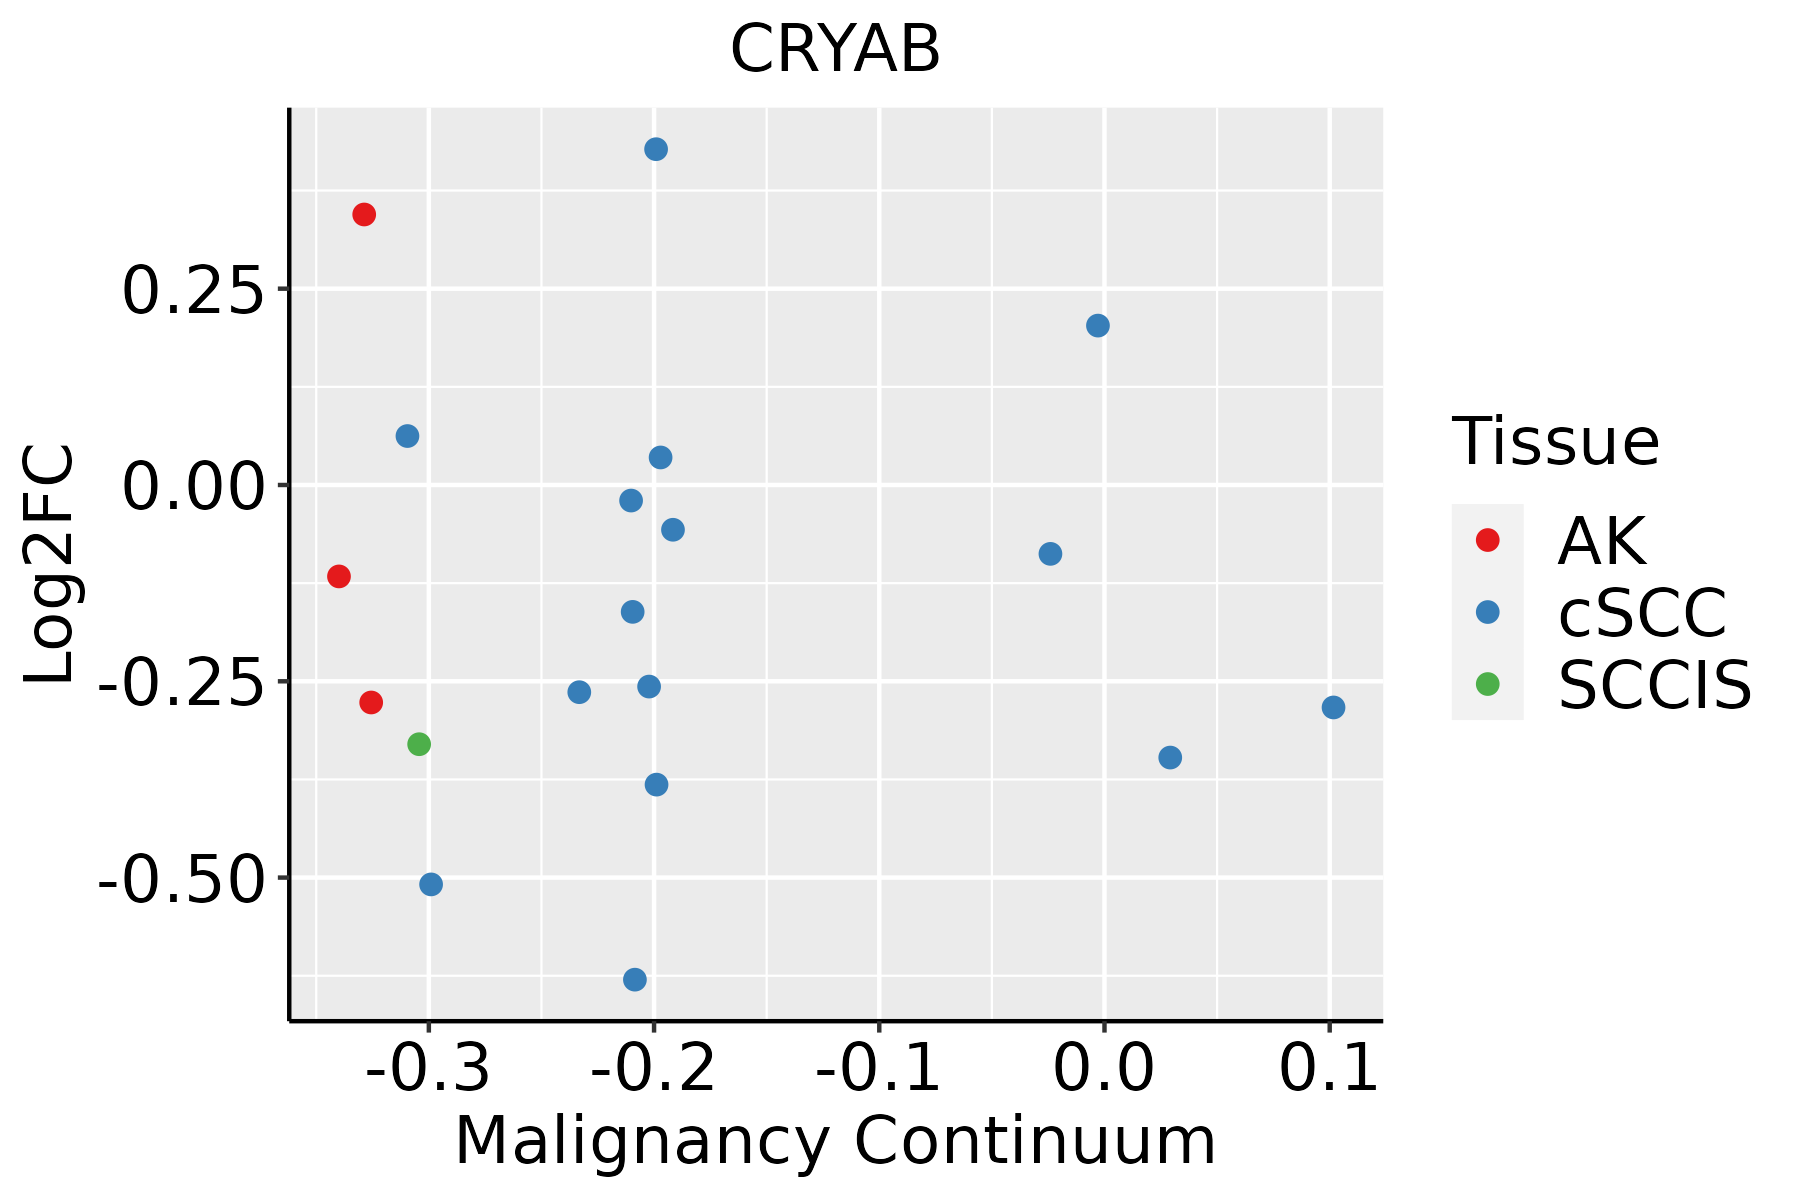 | AK: Actinic keratosis |
| cSCC: Cutaneous squamous cell carcinoma | ||
| SCCIS:squamous cell carcinoma in situ | ||
| Thyroid | 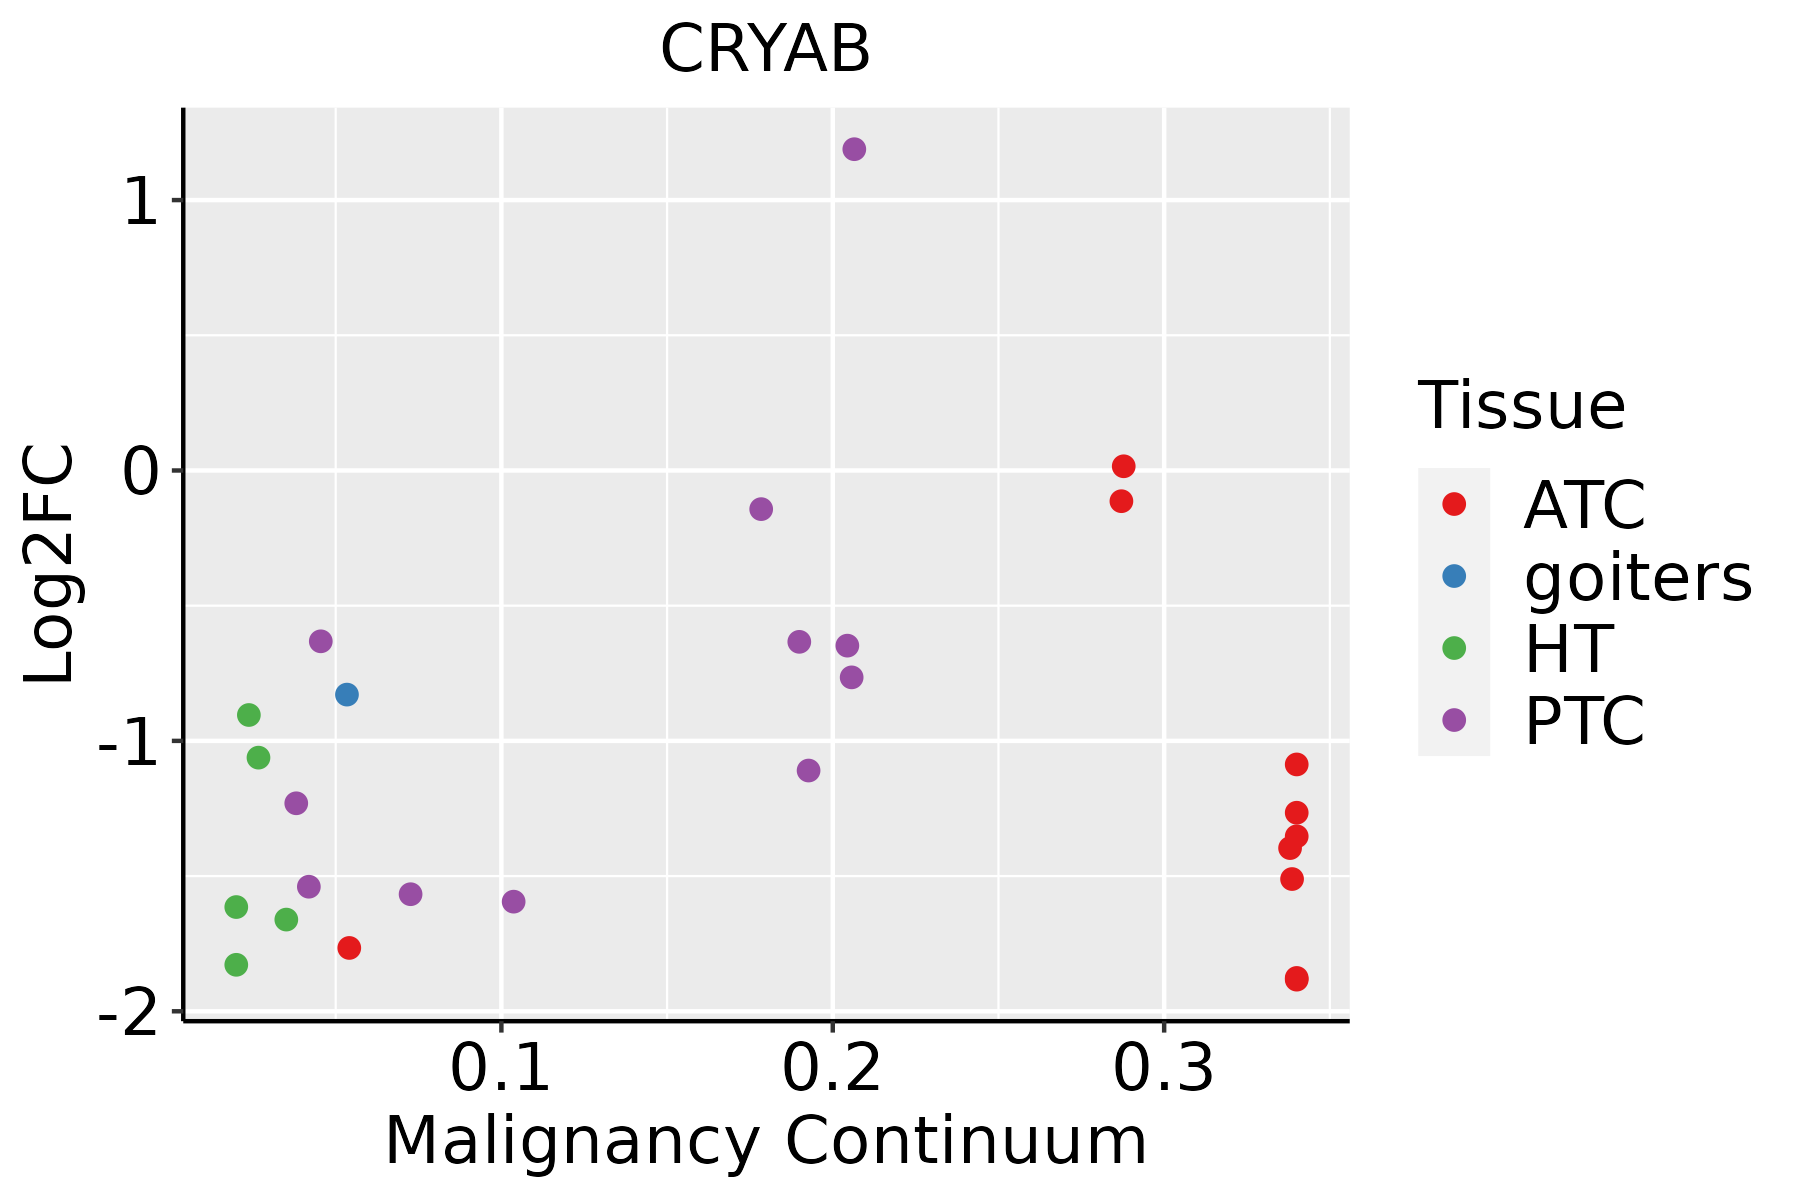 | ATC: Anaplastic thyroid cancer |
| HT: Hashimoto's thyroiditis | ||
| PTC: Papillary thyroid cancer |
| ∗log2FC in expression of this searched gene in stem-like cells from each diseased tissue sample relative to stem-like cells in normal samples in each tissue plotted against the malignancy continuum. Samples are colored based on if they are from different disease stage. |
Top |
Malignant transformation related pathway analysis |
| Find out the enriched GO biological processes and KEGG pathways involved in transition from healthy to precancer to cancer |
| Tissue | Disease Stage | Enriched GO biological Processes |
| Colorectum | AD |  |
| Colorectum | SER |  |
| Colorectum | MSS |  |
| Colorectum | MSI-H |  |
| Colorectum | FAP |  |
| ∗Top 15 enriched GO BP terms are showed in the bar plot of each disease state in each tissue. Each row represents a significant GO biological process which is colored according to the -log10(p.adjust). |
| Page: 1 2 3 4 5 6 7 8 9 |
| GO ID | Tissue | Disease Stage | Description | Gene Ratio | Bg Ratio | pvalue | p.adjust | Count |
| GO:003235513 | Cervix | HSIL_HPV | response to estradiol | 18/737 | 141/18723 | 1.09e-05 | 3.69e-04 | 18 |
| GO:005082115 | Cervix | HSIL_HPV | protein stabilization | 21/737 | 191/18723 | 2.17e-05 | 6.58e-04 | 21 |
| GO:004325415 | Cervix | HSIL_HPV | regulation of protein-containing complex assembly | 34/737 | 428/18723 | 8.79e-05 | 1.92e-03 | 34 |
| GO:200011714 | Cervix | HSIL_HPV | negative regulation of cysteine-type endopeptidase activity | 12/737 | 86/18723 | 1.34e-04 | 2.65e-03 | 12 |
| GO:000756814 | Cervix | HSIL_HPV | aging | 28/737 | 339/18723 | 1.90e-04 | 3.56e-03 | 28 |
| GO:004315414 | Cervix | HSIL_HPV | negative regulation of cysteine-type endopeptidase activity involved in apoptotic process | 11/737 | 78/18723 | 2.29e-04 | 4.03e-03 | 11 |
| GO:000645714 | Cervix | HSIL_HPV | protein folding | 20/737 | 212/18723 | 2.81e-04 | 4.69e-03 | 20 |
| GO:190590612 | Cervix | HSIL_HPV | regulation of amyloid fibril formation | 5/737 | 16/18723 | 2.83e-04 | 4.69e-03 | 5 |
| GO:199000013 | Cervix | HSIL_HPV | amyloid fibril formation | 7/737 | 34/18723 | 3.02e-04 | 4.94e-03 | 7 |
| GO:190290414 | Cervix | HSIL_HPV | negative regulation of supramolecular fiber organization | 16/737 | 167/18723 | 9.36e-04 | 1.18e-02 | 16 |
| GO:19059074 | Cervix | HSIL_HPV | negative regulation of amyloid fibril formation | 4/737 | 13/18723 | 1.28e-03 | 1.48e-02 | 4 |
| GO:200037714 | Cervix | HSIL_HPV | regulation of reactive oxygen species metabolic process | 15/737 | 157/18723 | 1.37e-03 | 1.56e-02 | 15 |
| GO:001033212 | Cervix | HSIL_HPV | response to gamma radiation | 8/737 | 56/18723 | 1.48e-03 | 1.65e-02 | 8 |
| GO:007147914 | Cervix | HSIL_HPV | cellular response to ionizing radiation | 9/737 | 72/18723 | 2.00e-03 | 2.08e-02 | 9 |
| GO:001021214 | Cervix | HSIL_HPV | response to ionizing radiation | 14/737 | 148/18723 | 2.15e-03 | 2.18e-02 | 14 |
| GO:000751711 | Cervix | HSIL_HPV | muscle organ development | 24/737 | 327/18723 | 2.65e-03 | 2.55e-02 | 24 |
| GO:001604914 | Cervix | HSIL_HPV | cell growth | 32/737 | 482/18723 | 2.87e-03 | 2.70e-02 | 32 |
| GO:007259314 | Cervix | HSIL_HPV | reactive oxygen species metabolic process | 19/737 | 239/18723 | 2.99e-03 | 2.76e-02 | 19 |
| GO:003133314 | Cervix | HSIL_HPV | negative regulation of protein-containing complex assembly | 13/737 | 141/18723 | 3.80e-03 | 3.32e-02 | 13 |
| GO:0031647111 | Esophagus | ESCC | regulation of protein stability | 223/8552 | 298/18723 | 5.76e-25 | 1.52e-22 | 223 |
| Page: 1 2 3 4 5 6 7 8 9 10 11 12 13 14 15 16 17 18 19 20 21 22 23 24 25 26 27 28 29 30 31 32 33 34 35 36 37 38 39 40 41 42 43 44 45 46 |
| Pathway ID | Tissue | Disease Stage | Description | Gene Ratio | Bg Ratio | pvalue | p.adjust | qvalue | Count |
| hsa0414118 | Breast | Precancer | Protein processing in endoplasmic reticulum | 33/684 | 174/8465 | 2.78e-06 | 3.83e-05 | 2.94e-05 | 33 |
| hsa0414119 | Breast | Precancer | Protein processing in endoplasmic reticulum | 33/684 | 174/8465 | 2.78e-06 | 3.83e-05 | 2.94e-05 | 33 |
| hsa0414124 | Breast | IDC | Protein processing in endoplasmic reticulum | 36/867 | 174/8465 | 2.73e-05 | 2.86e-04 | 2.14e-04 | 36 |
| hsa0414134 | Breast | IDC | Protein processing in endoplasmic reticulum | 36/867 | 174/8465 | 2.73e-05 | 2.86e-04 | 2.14e-04 | 36 |
| hsa0414143 | Breast | DCIS | Protein processing in endoplasmic reticulum | 36/846 | 174/8465 | 1.60e-05 | 1.91e-04 | 1.41e-04 | 36 |
| hsa0414153 | Breast | DCIS | Protein processing in endoplasmic reticulum | 36/846 | 174/8465 | 1.60e-05 | 1.91e-04 | 1.41e-04 | 36 |
| hsa0414120 | Cervix | CC | Protein processing in endoplasmic reticulum | 55/1267 | 174/8465 | 1.74e-08 | 2.68e-07 | 1.58e-07 | 55 |
| hsa04141110 | Cervix | CC | Protein processing in endoplasmic reticulum | 55/1267 | 174/8465 | 1.74e-08 | 2.68e-07 | 1.58e-07 | 55 |
| hsa0414125 | Cervix | HSIL_HPV | Protein processing in endoplasmic reticulum | 21/459 | 174/8465 | 4.54e-04 | 3.80e-03 | 3.07e-03 | 21 |
| hsa0414135 | Cervix | HSIL_HPV | Protein processing in endoplasmic reticulum | 21/459 | 174/8465 | 4.54e-04 | 3.80e-03 | 3.07e-03 | 21 |
| hsa04141211 | Esophagus | ESCC | Protein processing in endoplasmic reticulum | 147/4205 | 174/8465 | 3.29e-22 | 1.10e-19 | 5.64e-20 | 147 |
| hsa04141310 | Esophagus | ESCC | Protein processing in endoplasmic reticulum | 147/4205 | 174/8465 | 3.29e-22 | 1.10e-19 | 5.64e-20 | 147 |
| hsa0414122 | Liver | HCC | Protein processing in endoplasmic reticulum | 146/4020 | 174/8465 | 7.34e-24 | 2.46e-21 | 1.37e-21 | 146 |
| hsa042138 | Liver | HCC | Longevity regulating pathway - multiple species | 41/4020 | 62/8465 | 2.30e-03 | 7.86e-03 | 4.37e-03 | 41 |
| hsa0414132 | Liver | HCC | Protein processing in endoplasmic reticulum | 146/4020 | 174/8465 | 7.34e-24 | 2.46e-21 | 1.37e-21 | 146 |
| hsa0421311 | Liver | HCC | Longevity regulating pathway - multiple species | 41/4020 | 62/8465 | 2.30e-03 | 7.86e-03 | 4.37e-03 | 41 |
| hsa0414130 | Oral cavity | OSCC | Protein processing in endoplasmic reticulum | 143/3704 | 174/8465 | 6.82e-26 | 2.28e-23 | 1.16e-23 | 143 |
| hsa0421310 | Oral cavity | OSCC | Longevity regulating pathway - multiple species | 38/3704 | 62/8465 | 3.97e-03 | 9.86e-03 | 5.02e-03 | 38 |
| hsa04141113 | Oral cavity | OSCC | Protein processing in endoplasmic reticulum | 143/3704 | 174/8465 | 6.82e-26 | 2.28e-23 | 1.16e-23 | 143 |
| hsa0421313 | Oral cavity | OSCC | Longevity regulating pathway - multiple species | 38/3704 | 62/8465 | 3.97e-03 | 9.86e-03 | 5.02e-03 | 38 |
| Page: 1 2 |
Top |
Cell-cell communication analysis |
| Identification of potential cell-cell interactions between two cell types and their ligand-receptor pairs for different disease states |
| Ligand | Receptor | LRpair | Pathway | Tissue | Disease Stage |
| Page: 1 |
Top |
Single-cell gene regulatory network inference analysis |
| Find out the significant the regulons (TFs) and the target genes of each regulon across cell types for different disease states |
| TF | Cell Type | Tissue | Disease Stage | Target Gene | RSS | Regulon Activity |
| ∗The dot plots of a searched regulon are shown for all cell subpopulations in each disease state of each tissue based on the regulon specific score inferred using pySCENIC and by calculating the average expression. |
| Page: 1 |
Top |
Somatic mutation of malignant transformation related genes |
| Annotation of somatic variants for genes involved in malignant transformation |
| Hugo Symbol | Variant Class | Variant Classification | dbSNP RS | HGVSc | HGVSp | HGVSp Short | SWISSPROT | BIOTYPE | SIFT | PolyPhen | Tumor Sample Barcode | Tissue | Histology | Sex | Age | Stage | Therapy Types | Drugs | Outcome |
| CRYAB | SNV | Missense_Mutation | novel | c.55T>C | p.Ser19Pro | p.S19P | P02511 | protein_coding | tolerated(0.21) | possibly_damaging(0.536) | TCGA-BH-A0HU-01 | Breast | breast invasive carcinoma | Female | <65 | I/II | Chemotherapy | docetaxel | SD |
| CRYAB | SNV | Missense_Mutation | novel | c.500N>T | p.Pro167Leu | p.P167L | P02511 | protein_coding | deleterious(0) | possibly_damaging(0.873) | TCGA-2W-A8YY-01 | Cervix | cervical & endocervical cancer | Female | <65 | I/II | Chemotherapy | cisplatin | CR |
| CRYAB | SNV | Missense_Mutation | rs141638421 | c.470N>A | p.Arg157His | p.R157H | P02511 | protein_coding | deleterious(0.02) | probably_damaging(0.986) | TCGA-AY-A54L-01 | Colorectum | colon adenocarcinoma | Female | >=65 | I/II | Unknown | Unknown | PD |
| CRYAB | SNV | Missense_Mutation | rs370803064 | c.511N>A | p.Ala171Thr | p.A171T | P02511 | protein_coding | tolerated(0.12) | benign(0.014) | TCGA-CA-6717-01 | Colorectum | colon adenocarcinoma | Male | <65 | I/II | Chemotherapy | oxaliplatin | CR |
| CRYAB | deletion | Frame_Shift_Del | rs281865141 | c.60delC | p.Ser21AlafsTer24 | p.S21Afs*24 | P02511 | protein_coding | TCGA-AA-3947-01 | Colorectum | colon adenocarcinoma | Female | <65 | I/II | Unknown | Unknown | SD | ||
| CRYAB | SNV | Missense_Mutation | rs370803064 | c.511G>A | p.Ala171Thr | p.A171T | P02511 | protein_coding | tolerated(0.12) | benign(0.014) | TCGA-A5-A0G1-01 | Endometrium | uterine corpus endometrioid carcinoma | Female | >=65 | I/II | Unknown | Unknown | SD |
| CRYAB | SNV | Missense_Mutation | rs387907338 | c.166C>T | p.Arg56Trp | p.R56W | P02511 | protein_coding | deleterious(0) | probably_damaging(1) | TCGA-A5-A0G1-01 | Endometrium | uterine corpus endometrioid carcinoma | Female | >=65 | I/II | Unknown | Unknown | SD |
| CRYAB | SNV | Missense_Mutation | rs370803064 | c.511N>A | p.Ala171Thr | p.A171T | P02511 | protein_coding | tolerated(0.12) | benign(0.014) | TCGA-AJ-A3EK-01 | Endometrium | uterine corpus endometrioid carcinoma | Female | <65 | I/II | Chemotherapy | carboplatin | CR |
| CRYAB | SNV | Missense_Mutation | novel | c.148C>T | p.Arg50Trp | p.R50W | P02511 | protein_coding | deleterious(0) | probably_damaging(0.999) | TCGA-AJ-A5DW-01 | Endometrium | uterine corpus endometrioid carcinoma | Female | <65 | I/II | Unknown | Unknown | SD |
| CRYAB | SNV | Missense_Mutation | novel | c.449N>C | p.Lys150Thr | p.K150T | P02511 | protein_coding | tolerated(0.5) | possibly_damaging(0.622) | TCGA-AP-A059-01 | Endometrium | uterine corpus endometrioid carcinoma | Female | >=65 | I/II | Unknown | Unknown | SD |
| Page: 1 2 3 |
Top |
Related drugs of malignant transformation related genes |
| Identification of chemicals and drugs interact with genes involved in malignant transfromation |
| (DGIdb 4.0) |
| Entrez ID | Symbol | Category | Interaction Types | Drug Claim Name | Drug Name | PMIDs |
| Page: 1 |

Copyright 2023-Present -The University of Texas Health Science Center at Houston |