
|
|||||
|
 | |
| |
| |
| |
| |
| |
|
Gene: CRY1 |
Gene summary for CRY1 |
| Gene information | Species | Human | Gene symbol | CRY1 | Gene ID | 1407 |
| Gene name | cryptochrome circadian regulator 1 | |
| Gene Alias | DSPD | |
| Cytomap | 12q23.3 | |
| Gene Type | protein-coding | GO ID | GO:0000075 | UniProtAcc | A2I2P0 |
Top |
Malignant transformation analysis |
| Identification of the aberrant gene expression in precancerous and cancerous lesions by comparing the gene expression of stem-like cells in diseased tissues with normal stem cells |
| Entrez ID | Symbol | Replicates | Species | Organ | Tissue | Adj P-value | Log2FC | Malignancy |
| 1407 | CRY1 | AEH-subject1 | Human | Endometrium | AEH | 1.16e-36 | 7.36e-01 | -0.3059 |
| 1407 | CRY1 | AEH-subject2 | Human | Endometrium | AEH | 5.73e-06 | 2.87e-01 | -0.2525 |
| 1407 | CRY1 | AEH-subject3 | Human | Endometrium | AEH | 3.10e-15 | 4.55e-01 | -0.2576 |
| 1407 | CRY1 | AEH-subject4 | Human | Endometrium | AEH | 1.67e-14 | 5.27e-01 | -0.2657 |
| 1407 | CRY1 | AEH-subject5 | Human | Endometrium | AEH | 1.85e-19 | 4.91e-01 | -0.2953 |
| 1407 | CRY1 | EEC-subject1 | Human | Endometrium | EEC | 5.53e-24 | 6.47e-01 | -0.2682 |
| 1407 | CRY1 | EEC-subject2 | Human | Endometrium | EEC | 3.07e-06 | 2.90e-01 | -0.2607 |
| 1407 | CRY1 | EEC-subject4 | Human | Endometrium | EEC | 8.05e-08 | 3.16e-01 | -0.2571 |
| 1407 | CRY1 | EEC-subject5 | Human | Endometrium | EEC | 2.81e-09 | 3.16e-01 | -0.249 |
| 1407 | CRY1 | GSM5276934 | Human | Endometrium | EEC | 7.70e-06 | 2.44e-01 | -0.0913 |
| 1407 | CRY1 | GSM5276937 | Human | Endometrium | EEC | 8.10e-07 | 2.88e-01 | -0.0897 |
| 1407 | CRY1 | GSM6177620_NYU_UCEC1_lib2_lib2 | Human | Endometrium | EEC | 1.42e-05 | 1.12e-02 | -0.1875 |
| 1407 | CRY1 | GSM6177622_NYU_UCEC3_lib2_lib2 | Human | Endometrium | EEC | 1.15e-03 | 9.28e-02 | -0.1916 |
| 1407 | CRY1 | LZE4T | Human | Esophagus | ESCC | 7.25e-11 | 2.31e-01 | 0.0811 |
| 1407 | CRY1 | LZE7T | Human | Esophagus | ESCC | 1.81e-06 | 2.21e-01 | 0.0667 |
| 1407 | CRY1 | LZE8T | Human | Esophagus | ESCC | 1.36e-04 | 6.47e-02 | 0.067 |
| 1407 | CRY1 | LZE22T | Human | Esophagus | ESCC | 2.23e-03 | 2.22e-01 | 0.068 |
| 1407 | CRY1 | LZE24T | Human | Esophagus | ESCC | 7.35e-14 | 3.54e-01 | 0.0596 |
| 1407 | CRY1 | LZE21T | Human | Esophagus | ESCC | 3.40e-02 | 1.86e-01 | 0.0655 |
| 1407 | CRY1 | LZE6T | Human | Esophagus | ESCC | 8.82e-04 | 5.83e-02 | 0.0845 |
| Page: 1 2 3 4 5 6 |
| Tissue | Expression Dynamics | Abbreviation |
| Endometrium | 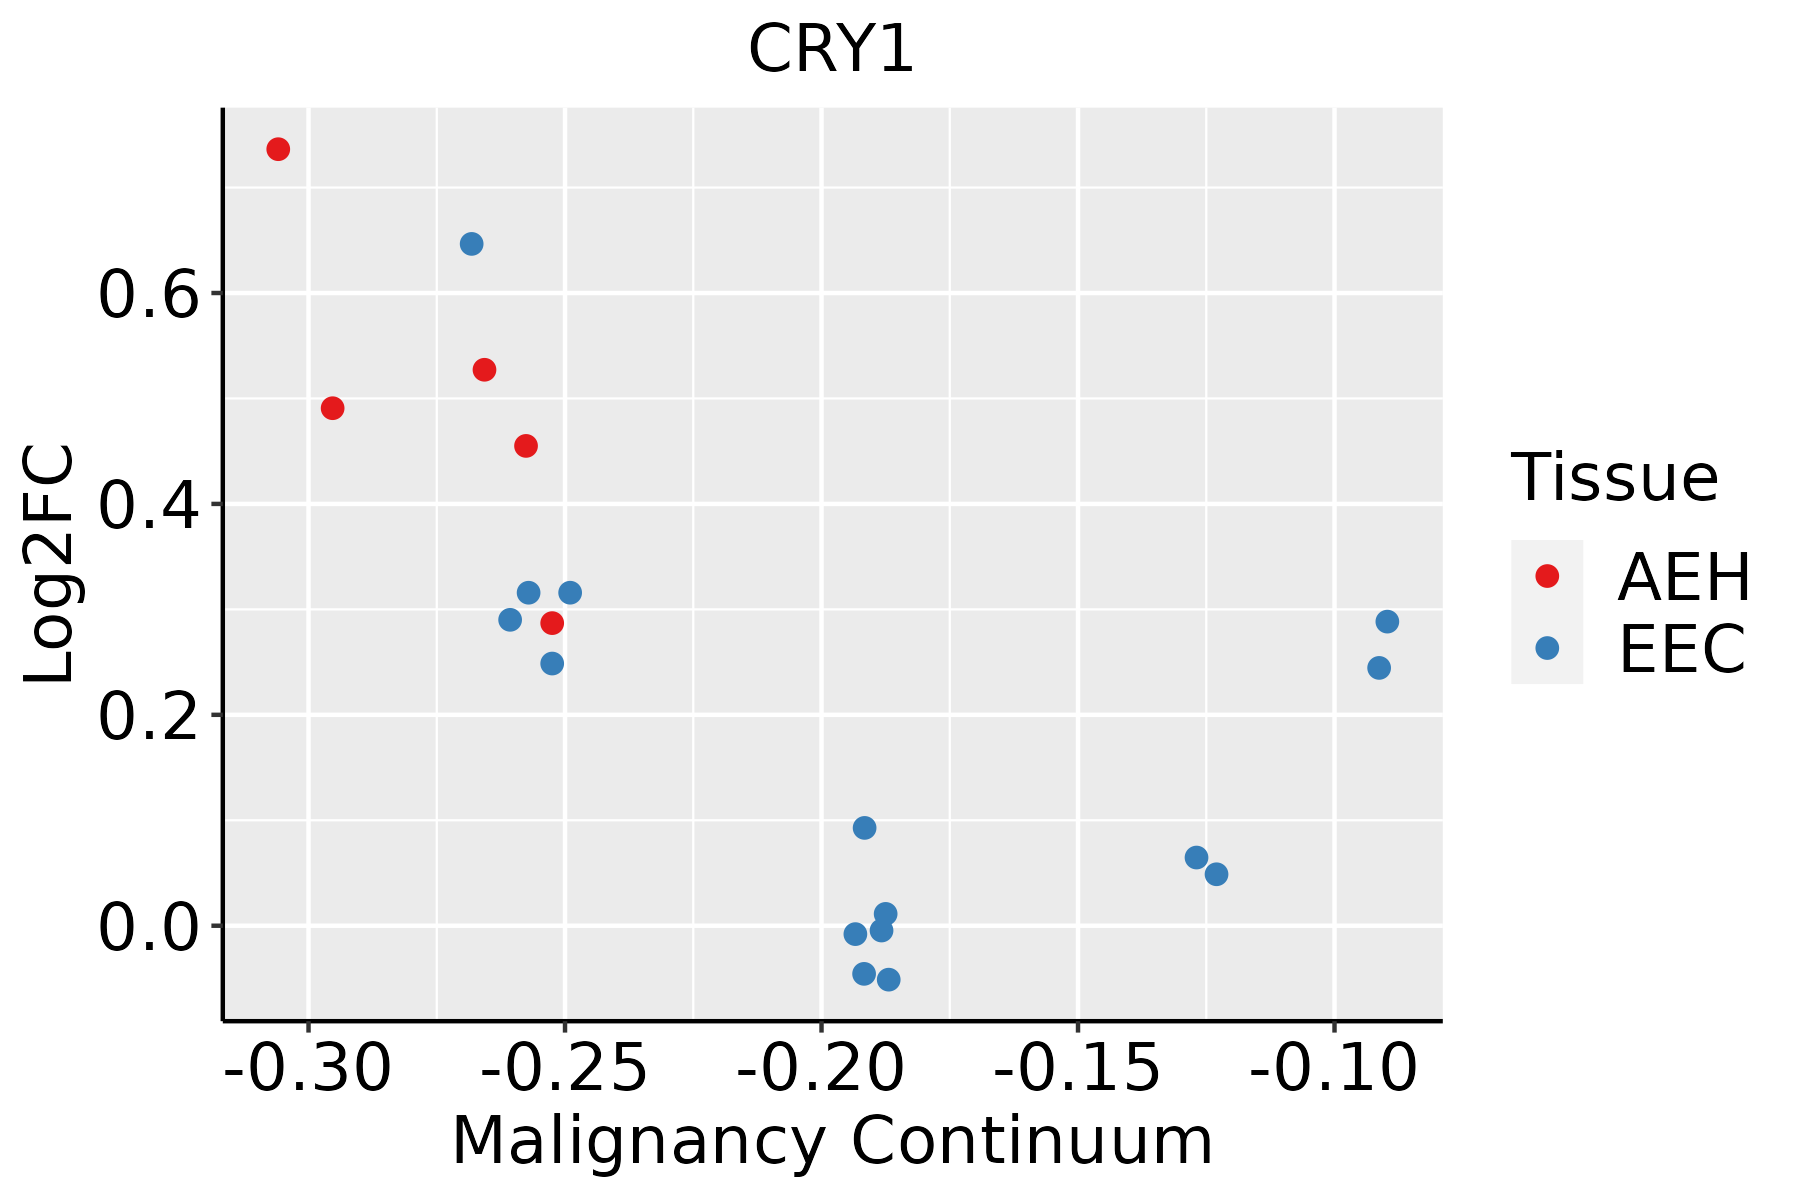 | AEH: Atypical endometrial hyperplasia |
| EEC: Endometrioid Cancer | ||
| Esophagus | 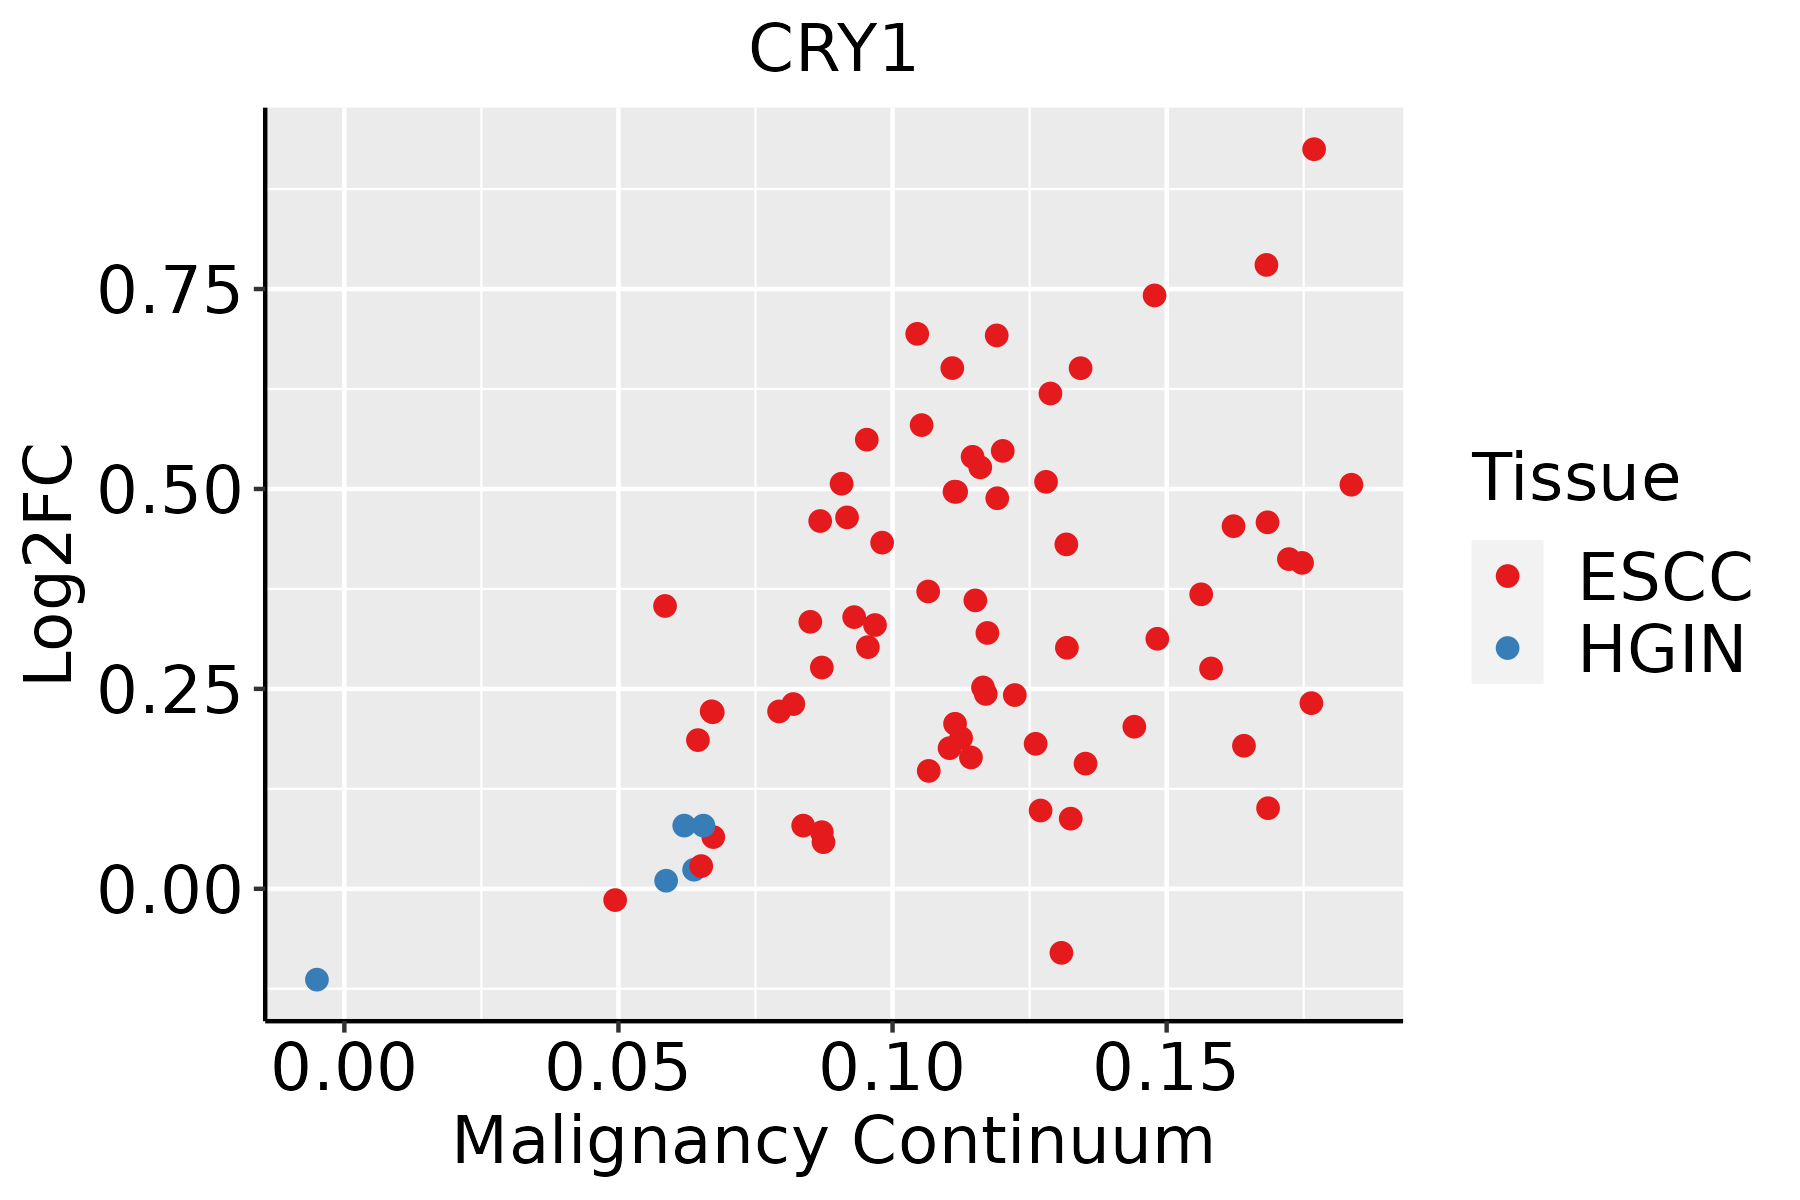 | ESCC: Esophageal squamous cell carcinoma |
| HGIN: High-grade intraepithelial neoplasias | ||
| LGIN: Low-grade intraepithelial neoplasias | ||
| Lung | 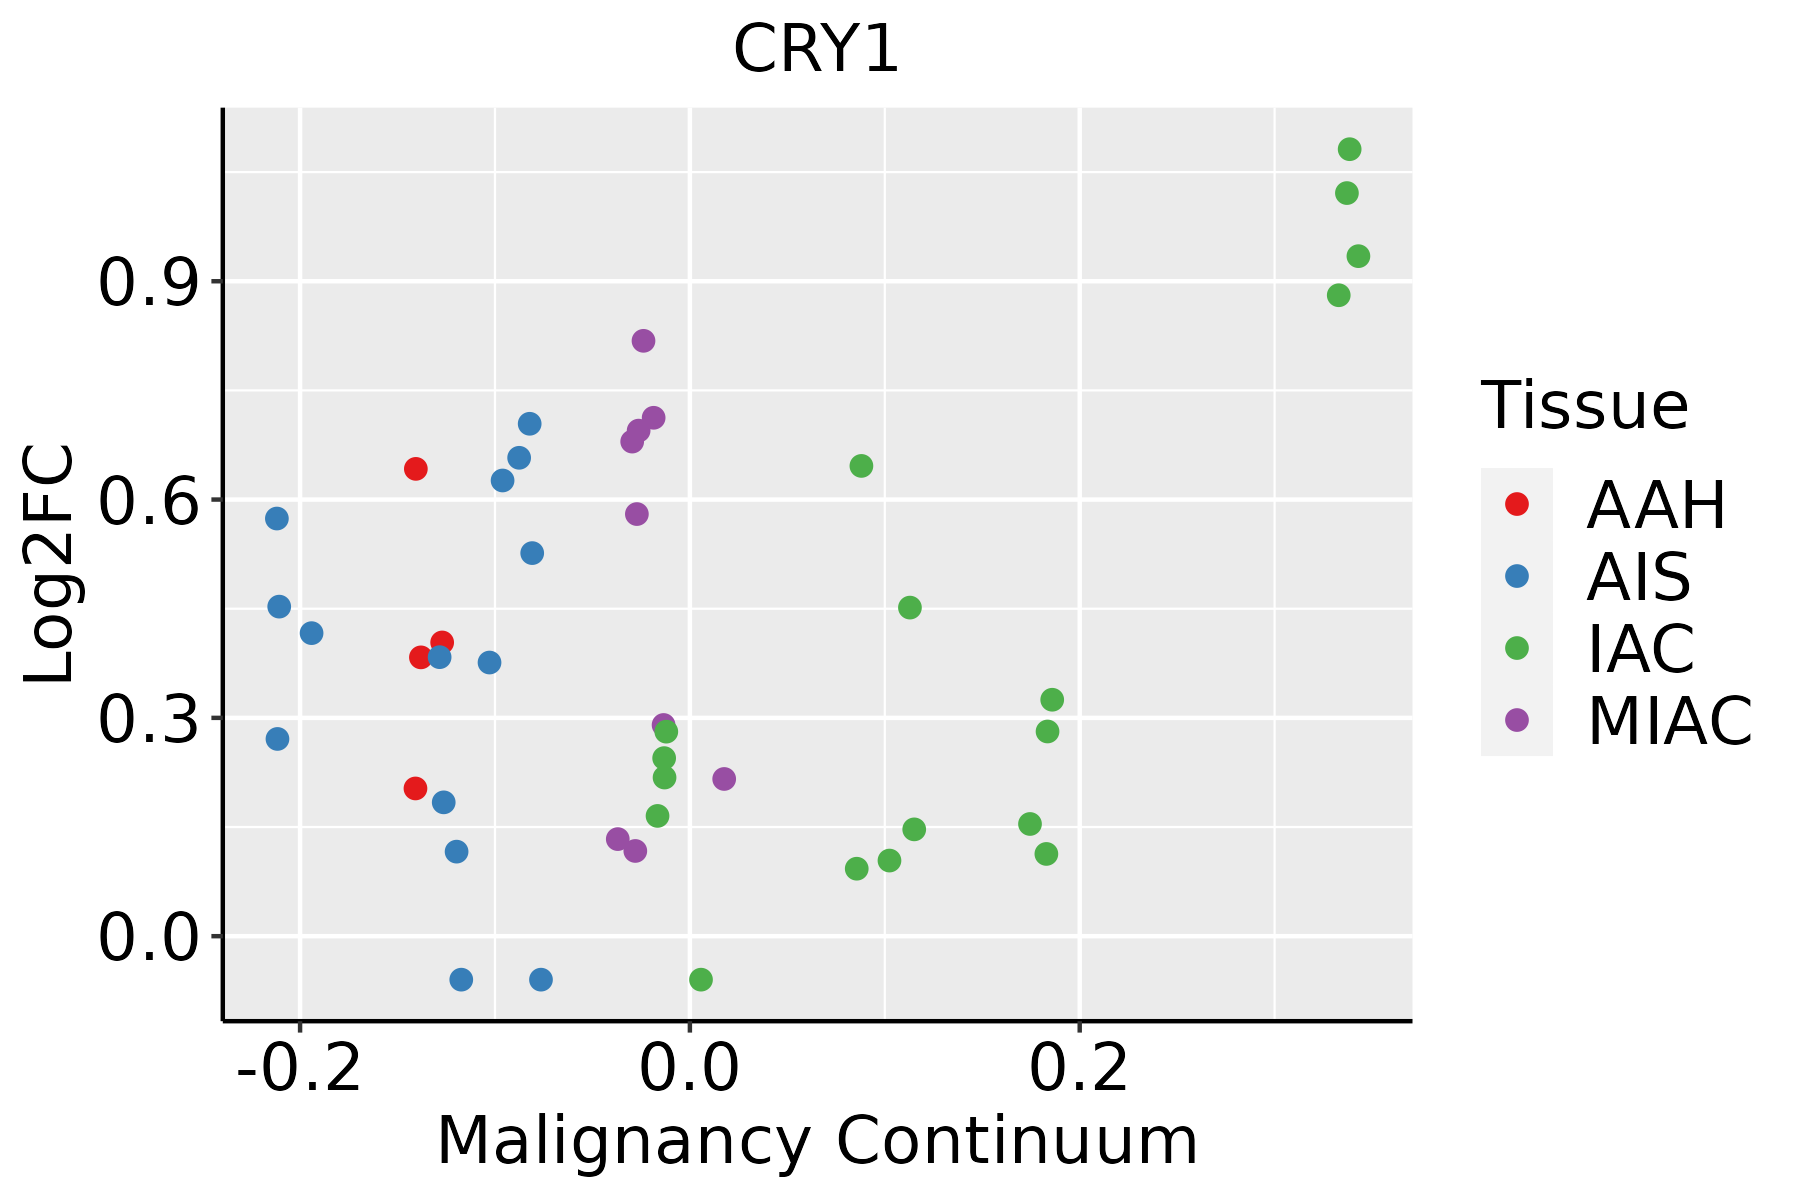 | AAH: Atypical adenomatous hyperplasia |
| AIS: Adenocarcinoma in situ | ||
| IAC: Invasive lung adenocarcinoma | ||
| MIA: Minimally invasive adenocarcinoma | ||
| Prostate | 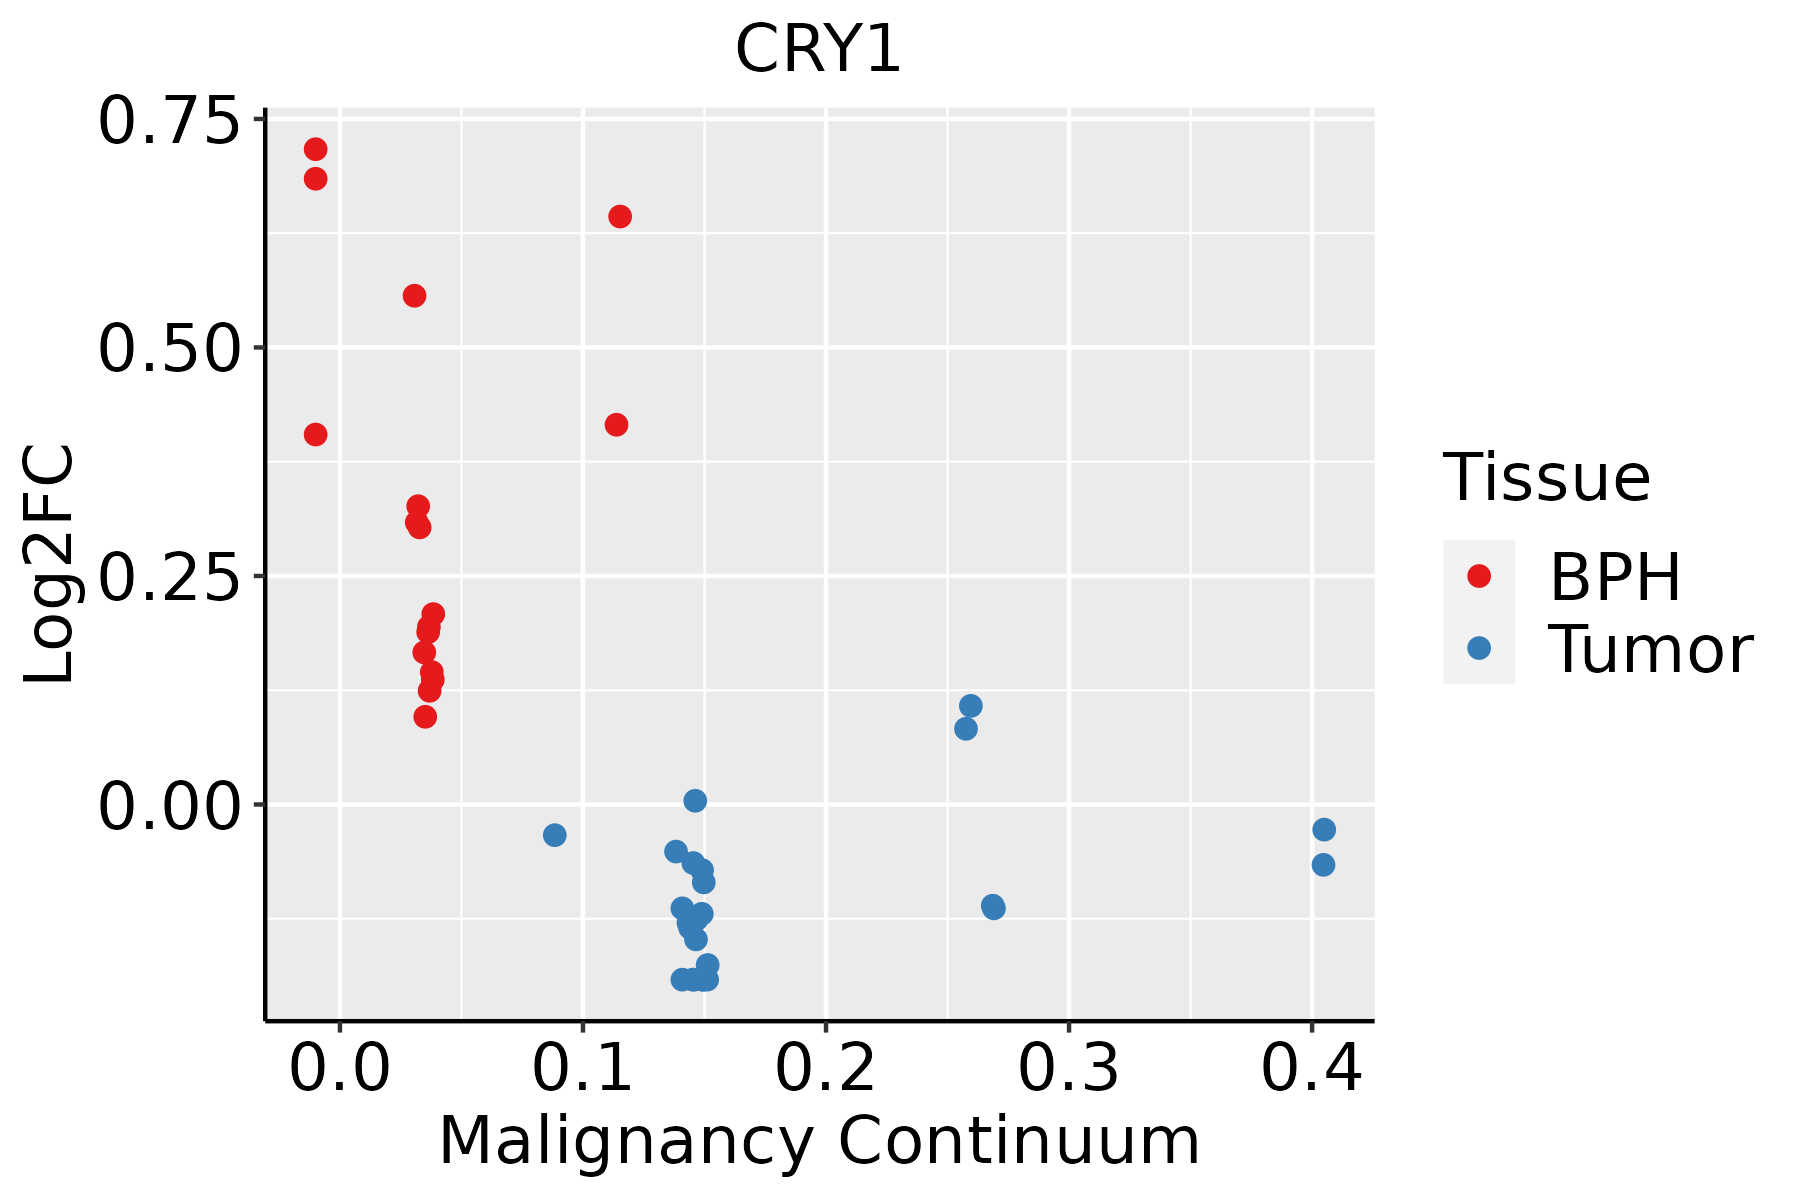 | BPH: Benign Prostatic Hyperplasia |
| Skin | 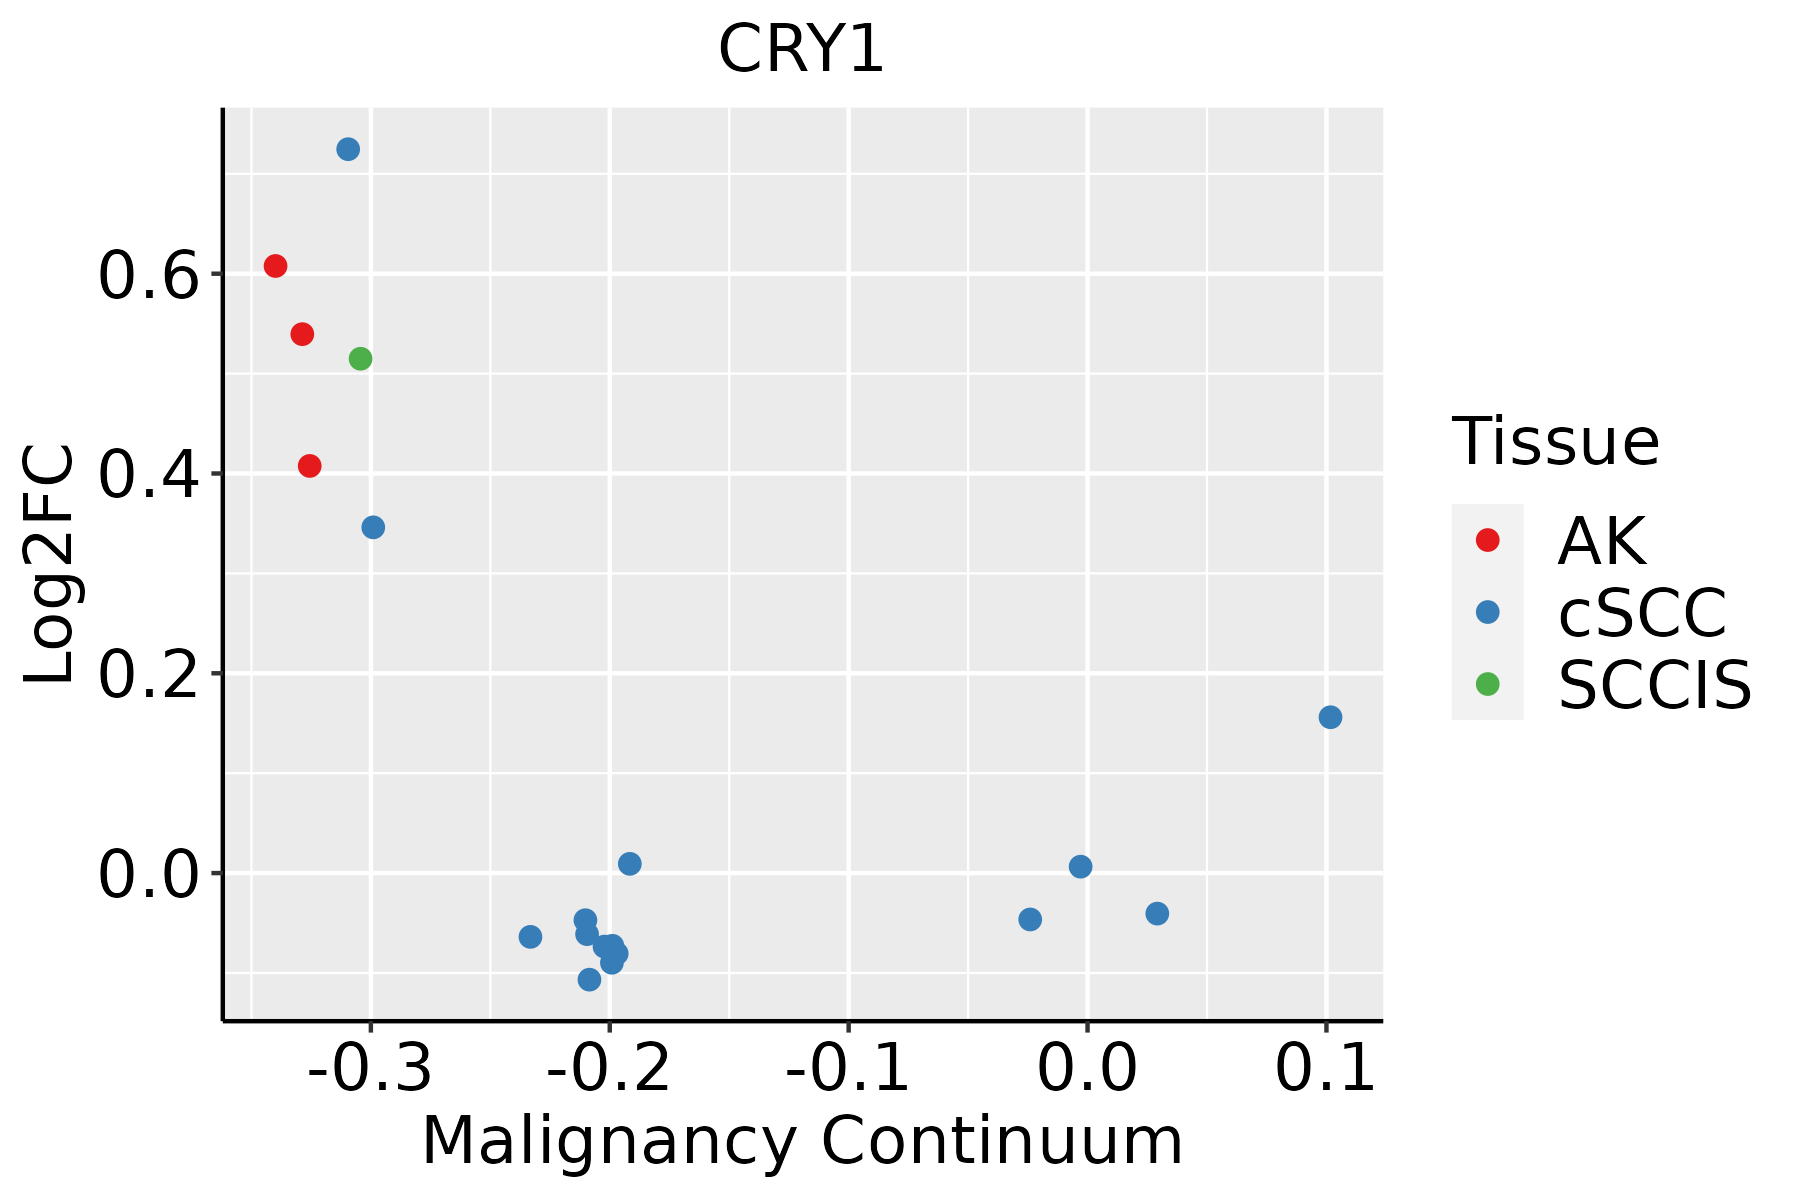 | AK: Actinic keratosis |
| cSCC: Cutaneous squamous cell carcinoma | ||
| SCCIS:squamous cell carcinoma in situ |
| ∗log2FC in expression of this searched gene in stem-like cells from each diseased tissue sample relative to stem-like cells in normal samples in each tissue plotted against the malignancy continuum. Samples are colored based on if they are from different disease stage. |
Top |
Malignant transformation related pathway analysis |
| Find out the enriched GO biological processes and KEGG pathways involved in transition from healthy to precancer to cancer |
| Tissue | Disease Stage | Enriched GO biological Processes |
| Colorectum | AD |  |
| Colorectum | SER |  |
| Colorectum | MSS |  |
| Colorectum | MSI-H |  |
| Colorectum | FAP |  |
| ∗Top 15 enriched GO BP terms are showed in the bar plot of each disease state in each tissue. Each row represents a significant GO biological process which is colored according to the -log10(p.adjust). |
| Page: 1 2 3 4 5 6 7 8 9 |
| GO ID | Tissue | Disease Stage | Description | Gene Ratio | Bg Ratio | pvalue | p.adjust | Count |
| GO:00000772 | Lung | MIAC | DNA damage checkpoint | 15/967 | 115/18723 | 8.47e-04 | 1.83e-02 | 15 |
| GO:200102022 | Lung | MIAC | regulation of response to DNA damage stimulus | 23/967 | 219/18723 | 9.93e-04 | 2.05e-02 | 23 |
| GO:003314322 | Lung | MIAC | regulation of intracellular steroid hormone receptor signaling pathway | 11/967 | 74/18723 | 1.39e-03 | 2.51e-02 | 11 |
| GO:00315702 | Lung | MIAC | DNA integrity checkpoint | 15/967 | 123/18723 | 1.69e-03 | 2.84e-02 | 15 |
| GO:00094161 | Lung | MIAC | response to light stimulus | 29/967 | 320/18723 | 2.42e-03 | 3.56e-02 | 29 |
| GO:003286831 | Lung | MIAC | response to insulin | 25/967 | 264/18723 | 2.62e-03 | 3.71e-02 | 25 |
| GO:003051822 | Lung | MIAC | intracellular steroid hormone receptor signaling pathway | 14/967 | 116/18723 | 2.62e-03 | 3.71e-02 | 14 |
| GO:004343423 | Lung | MIAC | response to peptide hormone | 35/967 | 414/18723 | 2.97e-03 | 4.00e-02 | 35 |
| GO:190198711 | Lung | MIAC | regulation of cell cycle phase transition | 33/967 | 390/18723 | 3.79e-03 | 4.68e-02 | 33 |
| GO:007121422 | Lung | MIAC | cellular response to abiotic stimulus | 29/967 | 331/18723 | 3.94e-03 | 4.78e-02 | 29 |
| GO:010400422 | Lung | MIAC | cellular response to environmental stimulus | 29/967 | 331/18723 | 3.94e-03 | 4.78e-02 | 29 |
| GO:00425937 | Lung | MIAC | glucose homeostasis | 24/967 | 258/18723 | 3.96e-03 | 4.79e-02 | 24 |
| GO:00335007 | Lung | MIAC | carbohydrate homeostasis | 24/967 | 259/18723 | 4.15e-03 | 4.93e-02 | 24 |
| GO:190332018 | Prostate | BPH | regulation of protein modification by small protein conjugation or removal | 90/3107 | 242/18723 | 7.37e-15 | 1.01e-12 | 90 |
| GO:004854518 | Prostate | BPH | response to steroid hormone | 109/3107 | 339/18723 | 9.35e-13 | 8.15e-11 | 109 |
| GO:004851110 | Prostate | BPH | rhythmic process | 96/3107 | 298/18723 | 1.88e-11 | 1.31e-09 | 96 |
| GO:003139618 | Prostate | BPH | regulation of protein ubiquitination | 74/3107 | 210/18723 | 3.66e-11 | 2.39e-09 | 74 |
| GO:000762310 | Prostate | BPH | circadian rhythm | 73/3107 | 210/18723 | 1.02e-10 | 6.02e-09 | 73 |
| GO:007138316 | Prostate | BPH | cellular response to steroid hormone stimulus | 71/3107 | 204/18723 | 1.72e-10 | 9.79e-09 | 71 |
| GO:00329228 | Prostate | BPH | circadian regulation of gene expression | 34/3107 | 68/18723 | 2.01e-10 | 1.12e-08 | 34 |
| Page: 1 2 3 4 5 6 7 8 9 10 11 12 13 14 15 16 17 18 19 20 |
| Pathway ID | Tissue | Disease Stage | Description | Gene Ratio | Bg Ratio | pvalue | p.adjust | qvalue | Count |
| hsa047105 | Esophagus | ESCC | Circadian rhythm | 24/4205 | 34/8465 | 1.09e-02 | 2.51e-02 | 1.29e-02 | 24 |
| hsa0471012 | Esophagus | ESCC | Circadian rhythm | 24/4205 | 34/8465 | 1.09e-02 | 2.51e-02 | 1.29e-02 | 24 |
| hsa04710 | Lung | IAC | Circadian rhythm | 10/1053 | 34/8465 | 6.70e-03 | 2.76e-02 | 1.83e-02 | 10 |
| hsa047101 | Lung | IAC | Circadian rhythm | 10/1053 | 34/8465 | 6.70e-03 | 2.76e-02 | 1.83e-02 | 10 |
| hsa047102 | Lung | AIS | Circadian rhythm | 11/961 | 34/8465 | 9.22e-04 | 7.11e-03 | 4.55e-03 | 11 |
| hsa047103 | Lung | AIS | Circadian rhythm | 11/961 | 34/8465 | 9.22e-04 | 7.11e-03 | 4.55e-03 | 11 |
| hsa047104 | Prostate | BPH | Circadian rhythm | 15/1718 | 34/8465 | 1.40e-03 | 5.85e-03 | 3.62e-03 | 15 |
| hsa0471011 | Prostate | BPH | Circadian rhythm | 15/1718 | 34/8465 | 1.40e-03 | 5.85e-03 | 3.62e-03 | 15 |
| Page: 1 |
Top |
Cell-cell communication analysis |
| Identification of potential cell-cell interactions between two cell types and their ligand-receptor pairs for different disease states |
| Ligand | Receptor | LRpair | Pathway | Tissue | Disease Stage |
| Page: 1 |
Top |
Single-cell gene regulatory network inference analysis |
| Find out the significant the regulons (TFs) and the target genes of each regulon across cell types for different disease states |
| TF | Cell Type | Tissue | Disease Stage | Target Gene | RSS | Regulon Activity |
| ∗The dot plots of a searched regulon are shown for all cell subpopulations in each disease state of each tissue based on the regulon specific score inferred using pySCENIC and by calculating the average expression. |
| Page: 1 |
Top |
Somatic mutation of malignant transformation related genes |
| Annotation of somatic variants for genes involved in malignant transformation |
| Hugo Symbol | Variant Class | Variant Classification | dbSNP RS | HGVSc | HGVSp | HGVSp Short | SWISSPROT | BIOTYPE | SIFT | PolyPhen | Tumor Sample Barcode | Tissue | Histology | Sex | Age | Stage | Therapy Types | Drugs | Outcome |
| CRY1 | SNV | Missense_Mutation | c.1344N>T | p.Trp448Cys | p.W448C | Q16526 | protein_coding | deleterious(0) | probably_damaging(1) | TCGA-A8-A07R-01 | Breast | breast invasive carcinoma | Female | >=65 | III/IV | Ancillary | zoledronic | SD | |
| CRY1 | insertion | Frame_Shift_Ins | novel | c.197_198insCATGGAAATGCCCA | p.Arg67MetfsTer8 | p.R67Mfs*8 | Q16526 | protein_coding | TCGA-A8-A0A4-01 | Breast | breast invasive carcinoma | Female | >=65 | I/II | Hormone Therapy | tamoxiphen | CR | ||
| CRY1 | insertion | Frame_Shift_Ins | novel | c.195_196insACAACTAG | p.Leu66ThrfsTer7 | p.L66Tfs*7 | Q16526 | protein_coding | TCGA-A8-A0A4-01 | Breast | breast invasive carcinoma | Female | >=65 | I/II | Hormone Therapy | tamoxiphen | CR | ||
| CRY1 | SNV | Missense_Mutation | c.1452G>A | p.Met484Ile | p.M484I | Q16526 | protein_coding | tolerated(0.05) | possibly_damaging(0.49) | TCGA-EK-A2H0-01 | Cervix | cervical & endocervical cancer | Female | <65 | I/II | Chemotherapy | cisplatin | CR | |
| CRY1 | SNV | Missense_Mutation | rs149558160 | c.767N>A | p.Arg256Gln | p.R256Q | Q16526 | protein_coding | deleterious(0) | probably_damaging(0.941) | TCGA-MA-AA3X-01 | Cervix | cervical & endocervical cancer | Female | <65 | III/IV | Chemotherapy | cisplatin | CR |
| CRY1 | SNV | Missense_Mutation | c.1452G>A | p.Met484Ile | p.M484I | Q16526 | protein_coding | tolerated(0.05) | possibly_damaging(0.49) | TCGA-ZJ-A8QQ-01 | Cervix | cervical & endocervical cancer | Female | <65 | I/II | Chemotherapy | cisplatin | SD | |
| CRY1 | SNV | Missense_Mutation | rs770965692 | c.1249G>A | p.Gly417Ser | p.G417S | Q16526 | protein_coding | tolerated(0.13) | benign(0.001) | TCGA-AA-3492-01 | Colorectum | colon adenocarcinoma | Female | >=65 | I/II | Unknown | Unknown | SD |
| CRY1 | SNV | Missense_Mutation | rs749506981 | c.1042C>T | p.Arg348Cys | p.R348C | Q16526 | protein_coding | deleterious(0) | possibly_damaging(0.606) | TCGA-AA-3672-01 | Colorectum | colon adenocarcinoma | Female | >=65 | III/IV | Unknown | Unknown | SD |
| CRY1 | SNV | Missense_Mutation | c.722C>T | p.Ala241Val | p.A241V | Q16526 | protein_coding | deleterious(0.03) | benign(0.42) | TCGA-AA-3672-01 | Colorectum | colon adenocarcinoma | Female | >=65 | III/IV | Unknown | Unknown | SD | |
| CRY1 | SNV | Missense_Mutation | novel | c.380N>T | p.Arg127Ile | p.R127I | Q16526 | protein_coding | deleterious(0.03) | benign(0.158) | TCGA-AA-A00N-01 | Colorectum | colon adenocarcinoma | Male | >=65 | I/II | Unknown | Unknown | PD |
| Page: 1 2 3 4 5 6 |
Top |
Related drugs of malignant transformation related genes |
| Identification of chemicals and drugs interact with genes involved in malignant transfromation |
| (DGIdb 4.0) |
| Entrez ID | Symbol | Category | Interaction Types | Drug Claim Name | Drug Name | PMIDs |
| 1407 | CRY1 | NUCLEAR HORMONE RECEPTOR, TRANSCRIPTION FACTOR | 252166810 | |||
| 1407 | CRY1 | NUCLEAR HORMONE RECEPTOR, TRANSCRIPTION FACTOR | lithium | LITHIUM |
| Page: 1 |

Copyright 2023-Present -The University of Texas Health Science Center at Houston |