
|
|||||
|
 | |
| |
| |
| |
| |
| |
|
Gene: CPNE1 |
Gene summary for CPNE1 |
| Gene information | Species | Human | Gene symbol | CPNE1 | Gene ID | 8904 |
| Gene name | copine 1 | |
| Gene Alias | COPN1 | |
| Cytomap | 20q11.22 | |
| Gene Type | protein-coding | GO ID | GO:0000902 | UniProtAcc | B0QZ18 |
Top |
Malignant transformation analysis |
| Identification of the aberrant gene expression in precancerous and cancerous lesions by comparing the gene expression of stem-like cells in diseased tissues with normal stem cells |
| Entrez ID | Symbol | Replicates | Species | Organ | Tissue | Adj P-value | Log2FC | Malignancy |
| 8904 | CPNE1 | HTA11_3410_2000001011 | Human | Colorectum | AD | 1.85e-03 | 2.36e-01 | 0.0155 |
| 8904 | CPNE1 | HTA11_347_2000001011 | Human | Colorectum | AD | 4.32e-05 | 2.96e-01 | -0.1954 |
| 8904 | CPNE1 | HTA11_1391_2000001011 | Human | Colorectum | AD | 1.81e-10 | 5.20e-01 | -0.059 |
| 8904 | CPNE1 | HTA11_866_3004761011 | Human | Colorectum | AD | 3.05e-20 | 6.97e-01 | 0.096 |
| 8904 | CPNE1 | HTA11_7696_3000711011 | Human | Colorectum | AD | 3.97e-04 | 3.13e-01 | 0.0674 |
| 8904 | CPNE1 | HTA11_6818_2000001021 | Human | Colorectum | AD | 4.84e-05 | 3.90e-01 | 0.0588 |
| 8904 | CPNE1 | HTA11_99999970781_79442 | Human | Colorectum | MSS | 2.76e-06 | 3.60e-01 | 0.294 |
| 8904 | CPNE1 | HTA11_99999971662_82457 | Human | Colorectum | MSS | 1.71e-34 | 1.07e+00 | 0.3859 |
| 8904 | CPNE1 | HTA11_99999973899_84307 | Human | Colorectum | MSS | 4.12e-18 | 1.06e+00 | 0.2585 |
| 8904 | CPNE1 | HTA11_99999974143_84620 | Human | Colorectum | MSS | 1.63e-41 | 1.10e+00 | 0.3005 |
| 8904 | CPNE1 | CRC-3-11773 | Human | Colorectum | CRC | 3.65e-08 | 5.63e-01 | 0.2564 |
| 8904 | CPNE1 | LZE4T | Human | Esophagus | ESCC | 3.18e-16 | 7.18e-01 | 0.0811 |
| 8904 | CPNE1 | LZE7T | Human | Esophagus | ESCC | 7.66e-05 | 6.22e-01 | 0.0667 |
| 8904 | CPNE1 | LZE8T | Human | Esophagus | ESCC | 2.12e-14 | 5.68e-01 | 0.067 |
| 8904 | CPNE1 | LZE20T | Human | Esophagus | ESCC | 6.47e-05 | 4.30e-01 | 0.0662 |
| 8904 | CPNE1 | LZE24T | Human | Esophagus | ESCC | 1.52e-44 | 1.89e+00 | 0.0596 |
| 8904 | CPNE1 | LZE21T | Human | Esophagus | ESCC | 2.60e-03 | 4.14e-02 | 0.0655 |
| 8904 | CPNE1 | LZE6T | Human | Esophagus | ESCC | 4.46e-10 | 9.36e-01 | 0.0845 |
| 8904 | CPNE1 | P1T-E | Human | Esophagus | ESCC | 4.00e-08 | 6.63e-01 | 0.0875 |
| 8904 | CPNE1 | P2T-E | Human | Esophagus | ESCC | 8.23e-60 | 1.13e+00 | 0.1177 |
| Page: 1 2 3 4 5 6 7 |
| Tissue | Expression Dynamics | Abbreviation |
| Colorectum (GSE201348) |  | FAP: Familial adenomatous polyposis |
| CRC: Colorectal cancer | ||
| Colorectum (HTA11) |  | AD: Adenomas |
| SER: Sessile serrated lesions | ||
| MSI-H: Microsatellite-high colorectal cancer | ||
| MSS: Microsatellite stable colorectal cancer | ||
| Esophagus | 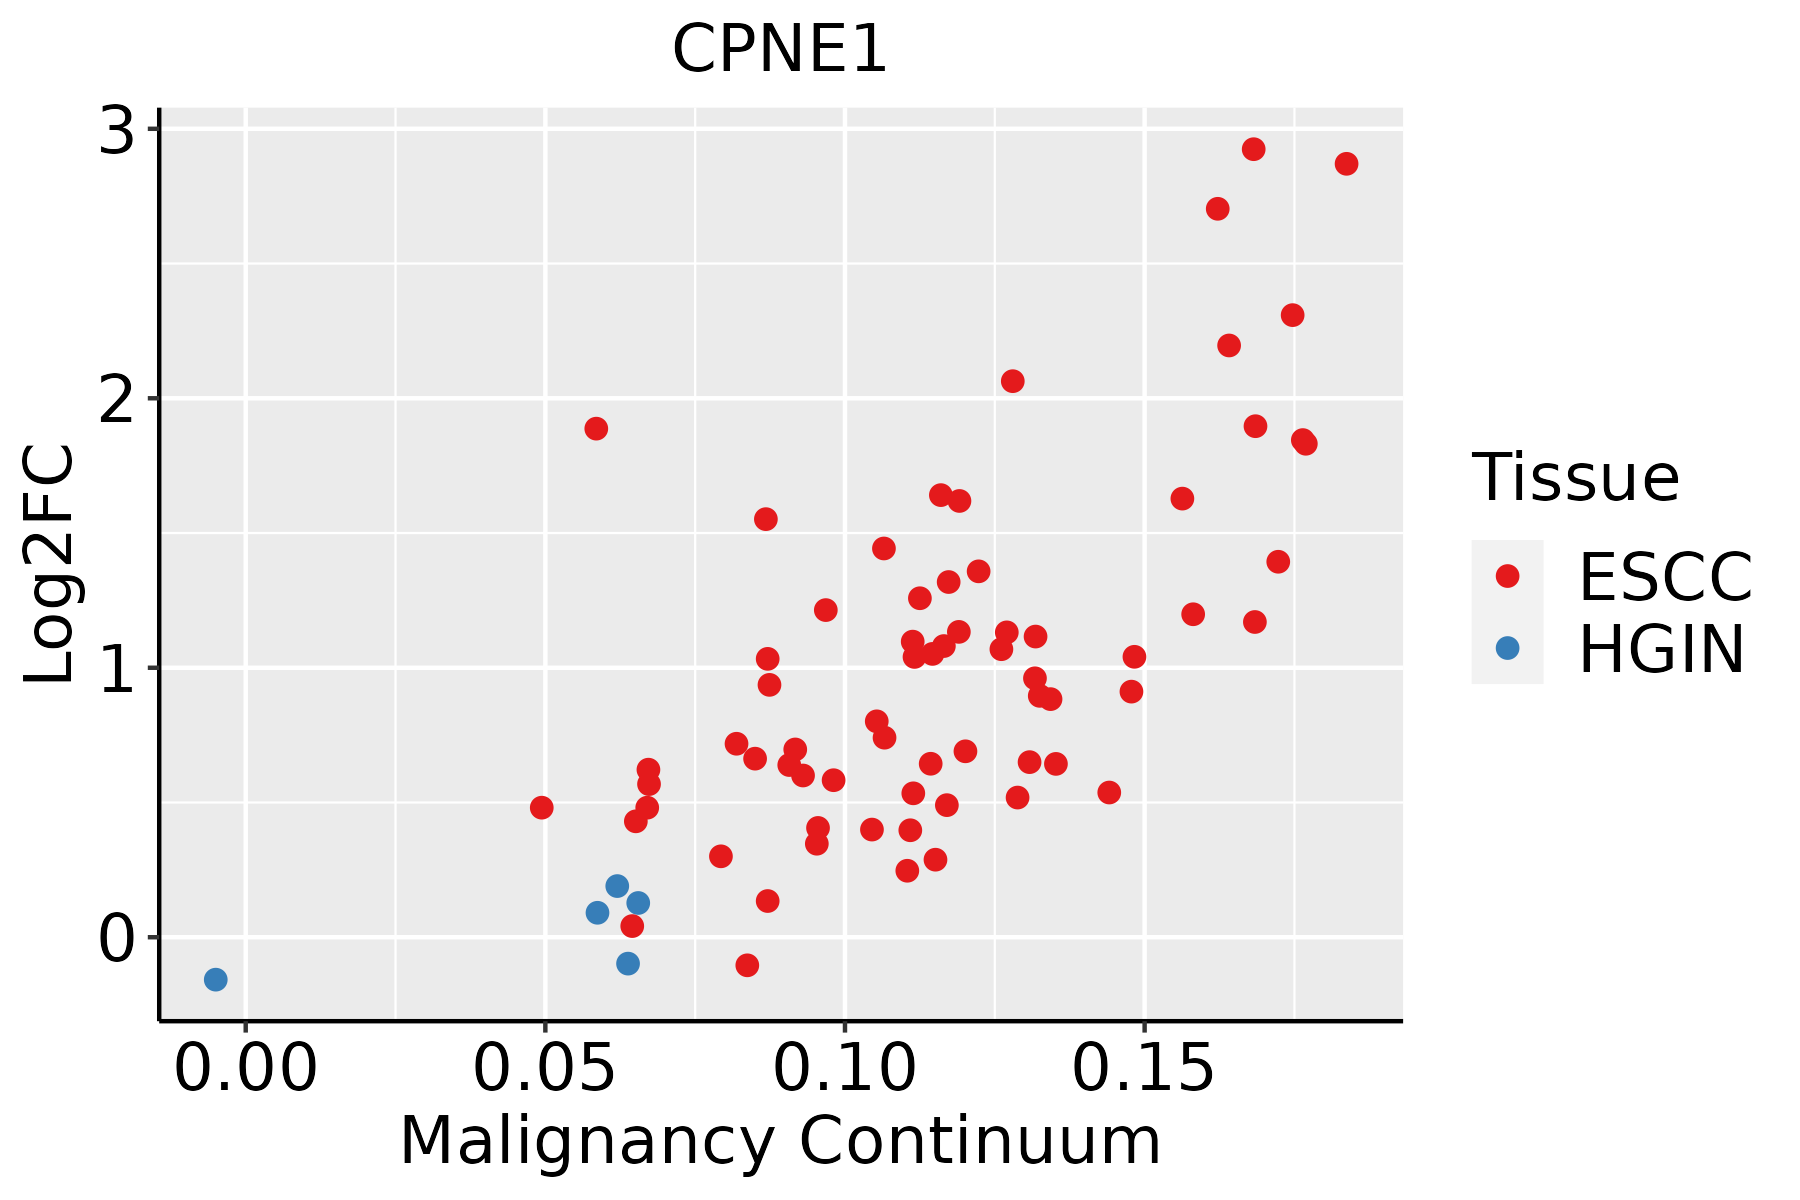 | ESCC: Esophageal squamous cell carcinoma |
| HGIN: High-grade intraepithelial neoplasias | ||
| LGIN: Low-grade intraepithelial neoplasias | ||
| Liver |  | HCC: Hepatocellular carcinoma |
| NAFLD: Non-alcoholic fatty liver disease | ||
| Oral Cavity | 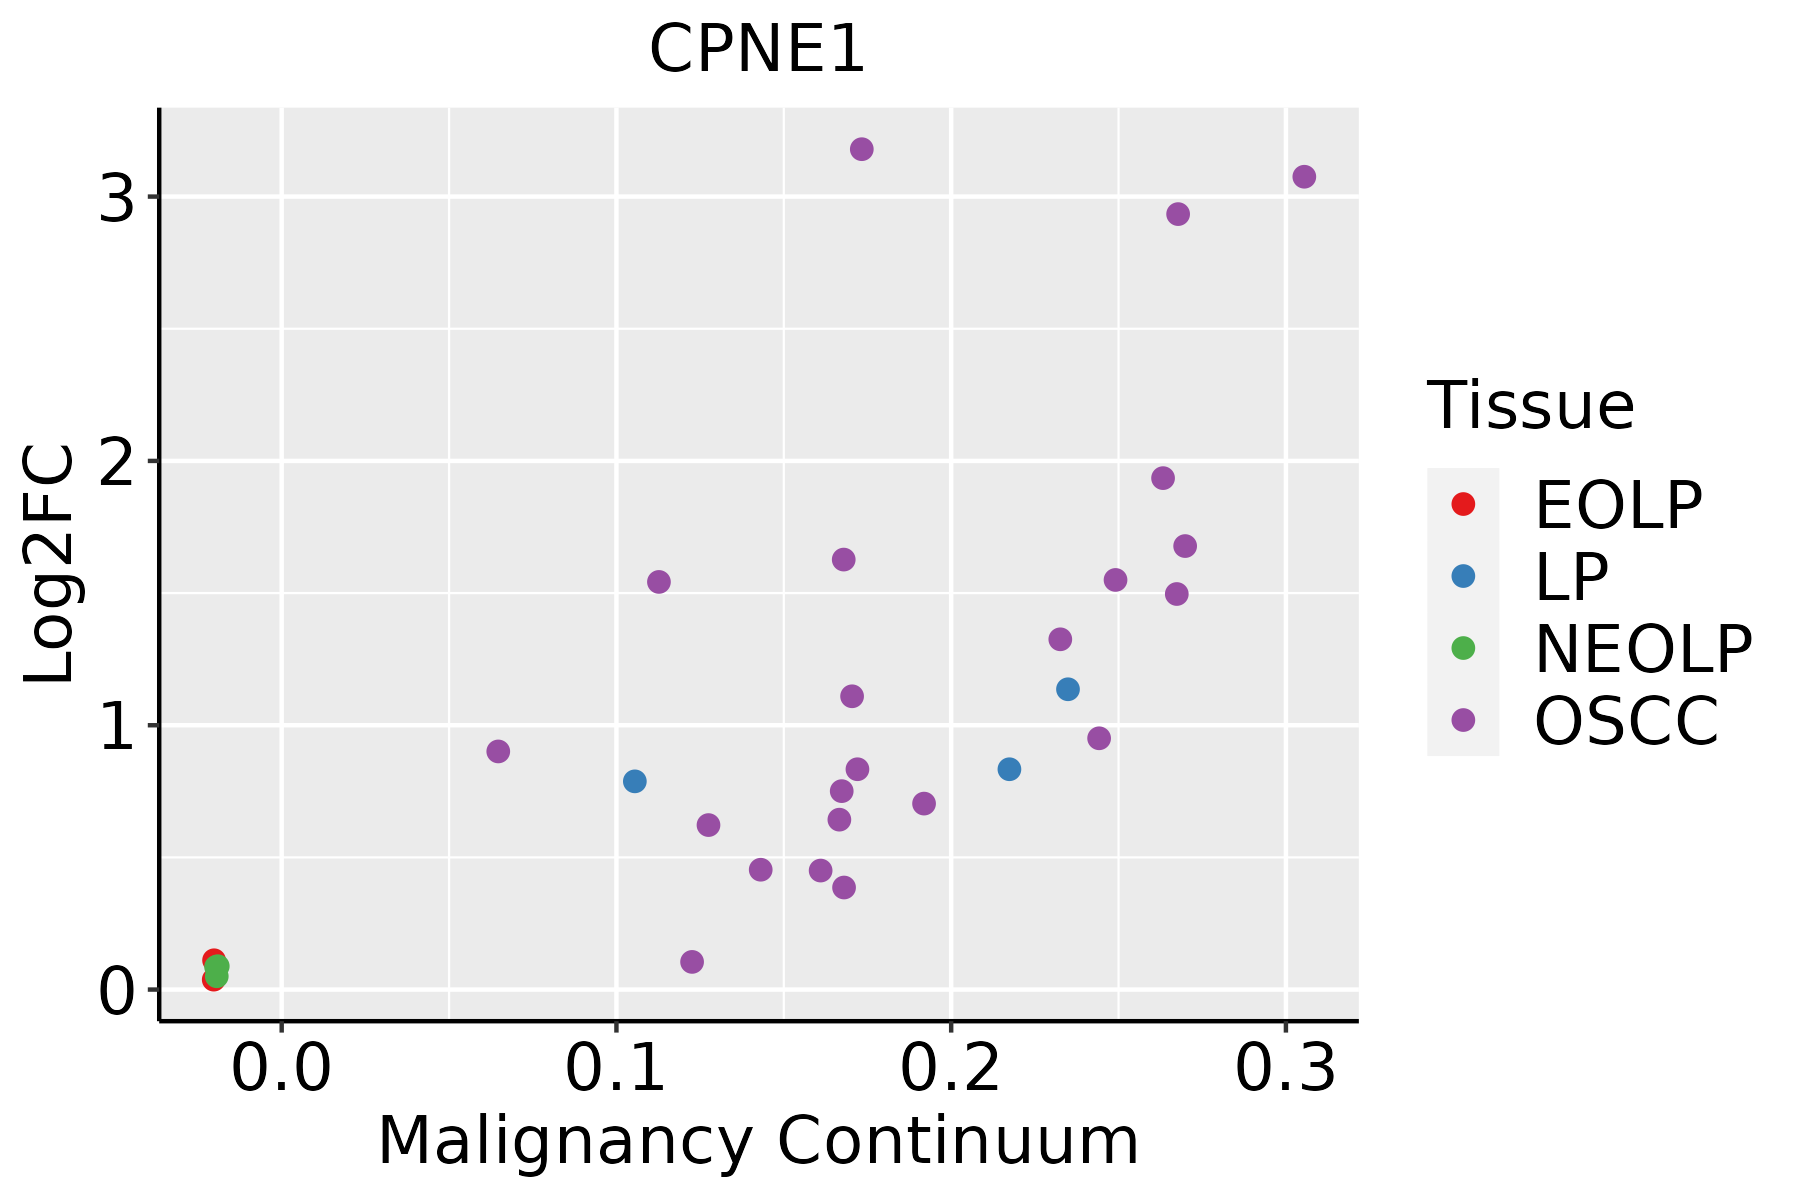 | EOLP: Erosive Oral lichen planus |
| LP: leukoplakia | ||
| NEOLP: Non-erosive oral lichen planus | ||
| OSCC: Oral squamous cell carcinoma | ||
| Skin | 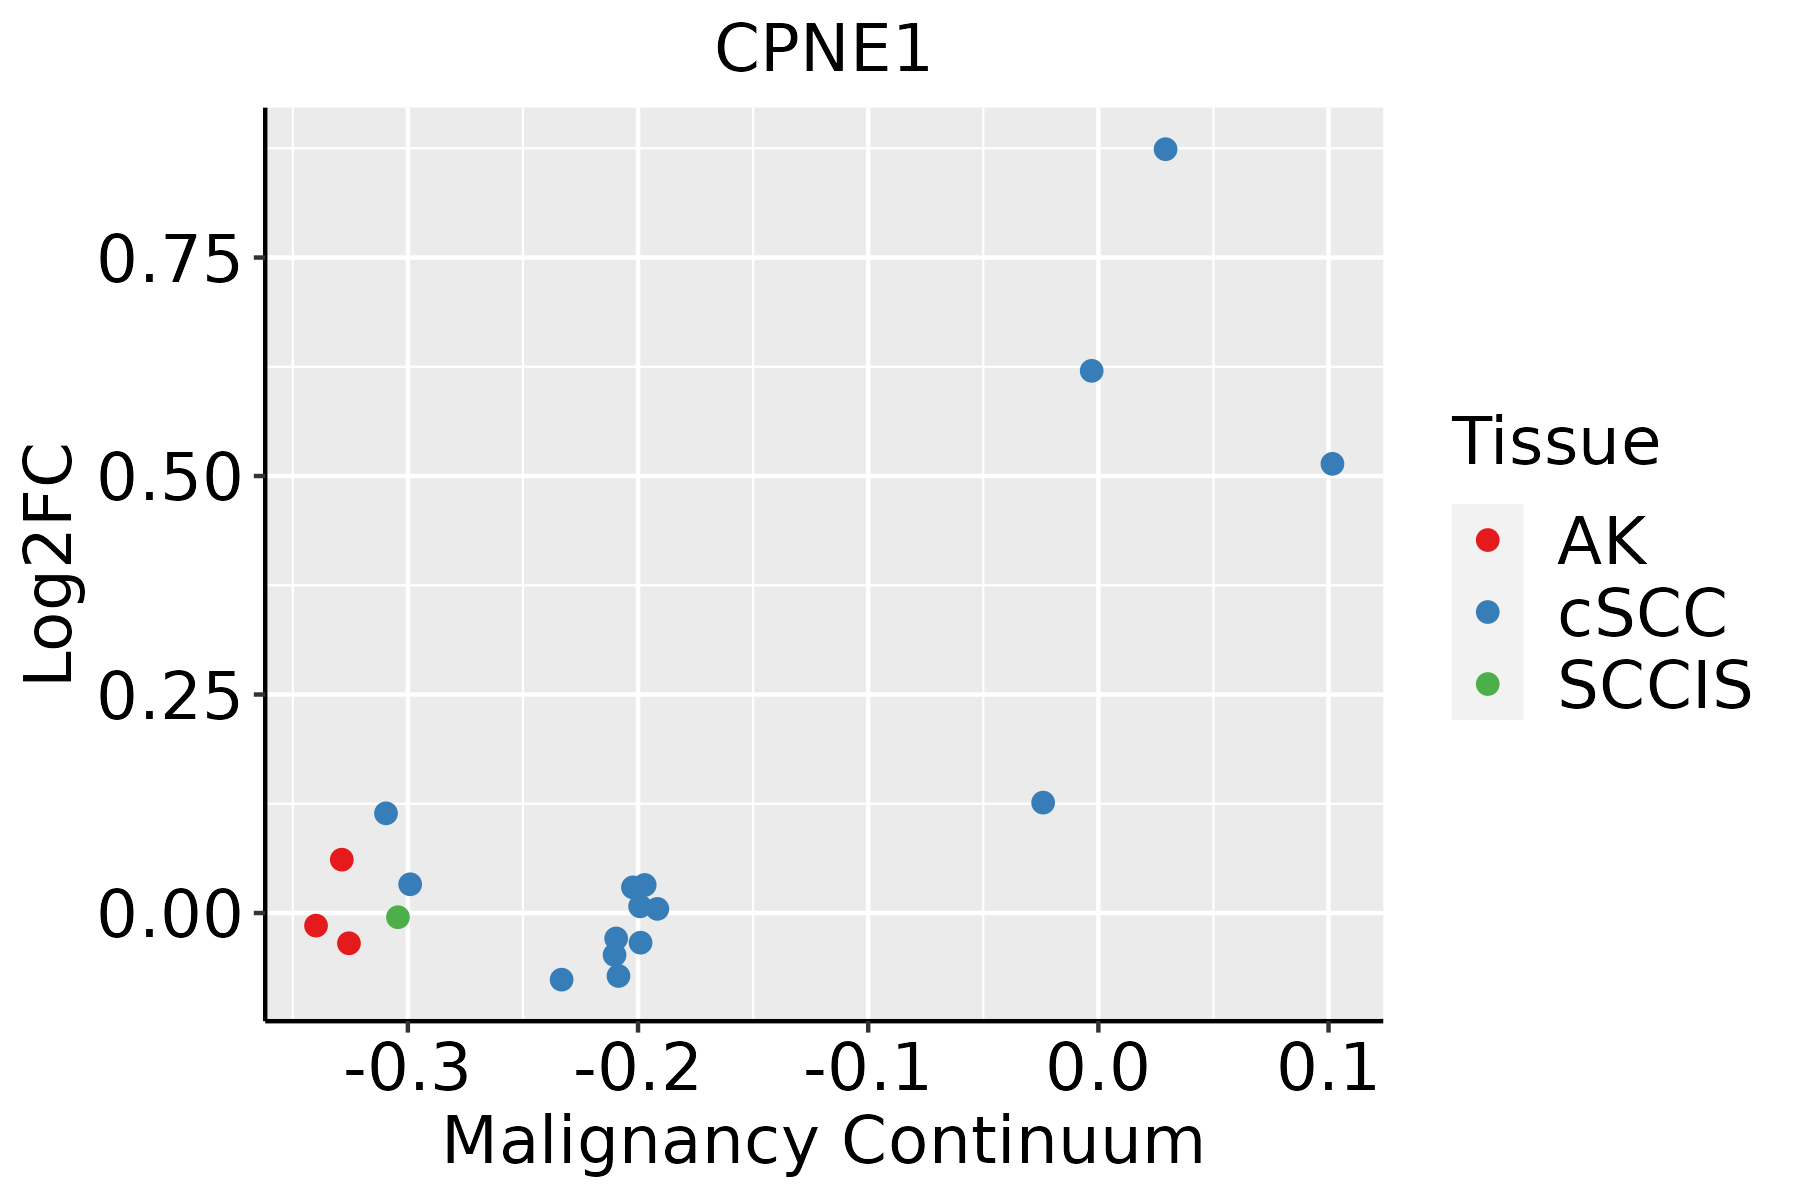 | AK: Actinic keratosis |
| cSCC: Cutaneous squamous cell carcinoma | ||
| SCCIS:squamous cell carcinoma in situ | ||
| Thyroid | 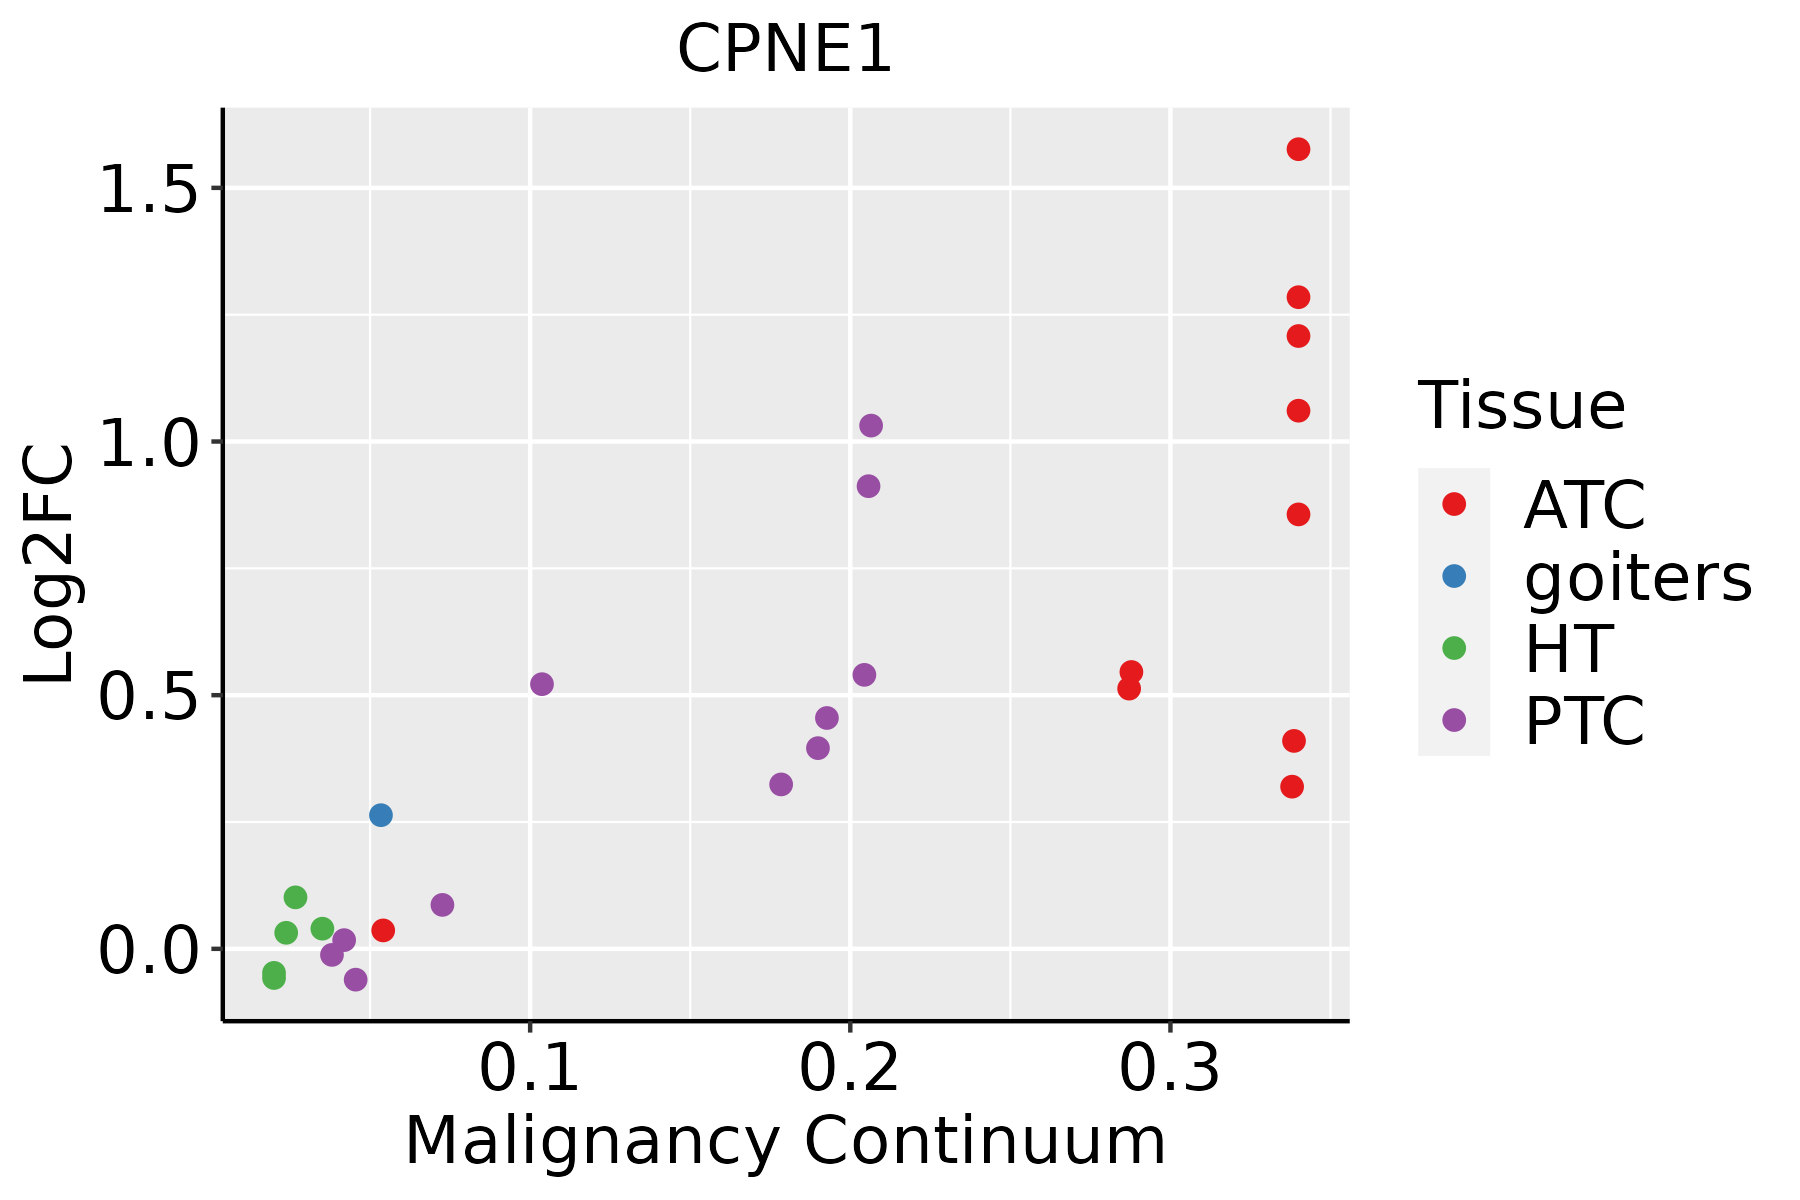 | ATC: Anaplastic thyroid cancer |
| HT: Hashimoto's thyroiditis | ||
| PTC: Papillary thyroid cancer |
| ∗log2FC in expression of this searched gene in stem-like cells from each diseased tissue sample relative to stem-like cells in normal samples in each tissue plotted against the malignancy continuum. Samples are colored based on if they are from different disease stage. |
Top |
Malignant transformation related pathway analysis |
| Find out the enriched GO biological processes and KEGG pathways involved in transition from healthy to precancer to cancer |
| Tissue | Disease Stage | Enriched GO biological Processes |
| Colorectum | AD |  |
| Colorectum | SER |  |
| Colorectum | MSS |  |
| Colorectum | MSI-H |  |
| Colorectum | FAP |  |
| ∗Top 15 enriched GO BP terms are showed in the bar plot of each disease state in each tissue. Each row represents a significant GO biological process which is colored according to the -log10(p.adjust). |
| Page: 1 2 3 4 5 6 7 8 9 |
| GO ID | Tissue | Disease Stage | Description | Gene Ratio | Bg Ratio | pvalue | p.adjust | Count |
| GO:006075912 | Thyroid | ATC | regulation of response to cytokine stimulus | 76/6293 | 162/18723 | 2.92e-04 | 1.85e-03 | 76 |
| GO:004339214 | Thyroid | ATC | negative regulation of DNA binding | 30/6293 | 52/18723 | 3.08e-04 | 1.94e-03 | 30 |
| GO:000195912 | Thyroid | ATC | regulation of cytokine-mediated signaling pathway | 71/6293 | 150/18723 | 3.28e-04 | 2.04e-03 | 71 |
| GO:000196112 | Thyroid | ATC | positive regulation of cytokine-mediated signaling pathway | 29/6293 | 50/18723 | 3.42e-04 | 2.12e-03 | 29 |
| GO:007135627 | Thyroid | ATC | cellular response to tumor necrosis factor | 102/6293 | 229/18723 | 3.52e-04 | 2.18e-03 | 102 |
| GO:005159225 | Thyroid | ATC | response to calcium ion | 69/6293 | 149/18723 | 8.43e-04 | 4.62e-03 | 69 |
| GO:007124124 | Thyroid | ATC | cellular response to inorganic substance | 98/6293 | 226/18723 | 1.35e-03 | 7.02e-03 | 98 |
| GO:003320917 | Thyroid | ATC | tumor necrosis factor-mediated signaling pathway | 48/6293 | 99/18723 | 1.51e-03 | 7.70e-03 | 48 |
| GO:003806122 | Thyroid | ATC | NIK/NF-kappaB signaling | 64/6293 | 143/18723 | 3.53e-03 | 1.57e-02 | 64 |
| GO:190122232 | Thyroid | ATC | regulation of NIK/NF-kappaB signaling | 51/6293 | 112/18723 | 5.68e-03 | 2.30e-02 | 51 |
| GO:19032656 | Thyroid | ATC | positive regulation of tumor necrosis factor-mediated signaling pathway | 8/6293 | 11/18723 | 9.31e-03 | 3.44e-02 | 8 |
| GO:007124823 | Thyroid | ATC | cellular response to metal ion | 82/6293 | 197/18723 | 1.11e-02 | 3.99e-02 | 82 |
| GO:004349116 | Thyroid | ATC | protein kinase B signaling | 87/6293 | 211/18723 | 1.20e-02 | 4.27e-02 | 87 |
| Page: 1 2 3 4 5 6 7 8 9 10 |
| Pathway ID | Tissue | Disease Stage | Description | Gene Ratio | Bg Ratio | pvalue | p.adjust | qvalue | Count |
| Page: 1 |
Top |
Cell-cell communication analysis |
| Identification of potential cell-cell interactions between two cell types and their ligand-receptor pairs for different disease states |
| Ligand | Receptor | LRpair | Pathway | Tissue | Disease Stage |
| Page: 1 |
Top |
Single-cell gene regulatory network inference analysis |
| Find out the significant the regulons (TFs) and the target genes of each regulon across cell types for different disease states |
| TF | Cell Type | Tissue | Disease Stage | Target Gene | RSS | Regulon Activity |
| ∗The dot plots of a searched regulon are shown for all cell subpopulations in each disease state of each tissue based on the regulon specific score inferred using pySCENIC and by calculating the average expression. |
| Page: 1 |
Top |
Somatic mutation of malignant transformation related genes |
| Annotation of somatic variants for genes involved in malignant transformation |
| Hugo Symbol | Variant Class | Variant Classification | dbSNP RS | HGVSc | HGVSp | HGVSp Short | SWISSPROT | BIOTYPE | SIFT | PolyPhen | Tumor Sample Barcode | Tissue | Histology | Sex | Age | Stage | Therapy Types | Drugs | Outcome |
| CPNE1 | SNV | Missense_Mutation | c.1263N>A | p.Met421Ile | p.M421I | protein_coding | tolerated(0.7) | benign(0) | TCGA-BH-A0HF-01 | Breast | breast invasive carcinoma | Female | >=65 | I/II | Hormone Therapy | arimidex | SD | ||
| CPNE1 | SNV | Missense_Mutation | c.820N>C | p.Glu274Gln | p.E274Q | protein_coding | tolerated(0.27) | benign(0.007) | TCGA-D8-A147-01 | Breast | breast invasive carcinoma | Female | <65 | I/II | Chemotherapy | doxorubicine | SD | ||
| CPNE1 | SNV | Missense_Mutation | c.1000G>A | p.Asp334Asn | p.D334N | protein_coding | deleterious(0.03) | probably_damaging(0.995) | TCGA-E9-A243-01 | Breast | breast invasive carcinoma | Female | <65 | I/II | Chemotherapy | 5-fluorouracil | PD | ||
| CPNE1 | SNV | Missense_Mutation | novel | c.833N>A | p.Ser278Tyr | p.S278Y | protein_coding | deleterious(0) | probably_damaging(0.929) | TCGA-LL-A440-01 | Breast | breast invasive carcinoma | Female | <65 | I/II | Chemotherapy | cytoxan | CR | |
| CPNE1 | insertion | Frame_Shift_Ins | novel | c.811_812insTGAGACAGAGTCTGGCCCTCTCACCCAGGCTGGAGTGTGGTGGCGTG | p.Cys271LeufsTer19 | p.C271Lfs*19 | protein_coding | TCGA-A1-A0SQ-01 | Breast | breast invasive carcinoma | Female | <65 | I/II | Chemotherapy | ac | SD | |||
| CPNE1 | insertion | In_Frame_Ins | novel | c.967_968insGTGCGG | p.Met323delinsSerAlaVal | p.M323delinsSAV | protein_coding | TCGA-AN-A03X-01 | Breast | breast invasive carcinoma | Female | >=65 | I/II | Unknown | Unknown | SD | |||
| CPNE1 | insertion | Nonsense_Mutation | novel | c.965_966insTTTTTGAGAAAGAGTCTTGCTCTGTCACCCAGGCTG | p.Leu322_Met323insPheTerGluArgValLeuLeuCysHisProGlyTrp | p.L322_M323insF*ERVLLCHPGW | protein_coding | TCGA-AN-A03X-01 | Breast | breast invasive carcinoma | Female | >=65 | I/II | Unknown | Unknown | SD | |||
| CPNE1 | SNV | Missense_Mutation | novel | c.1086N>C | p.Leu362Phe | p.L362F | protein_coding | deleterious(0) | possibly_damaging(0.714) | TCGA-DG-A2KM-01 | Cervix | cervical & endocervical cancer | Female | <65 | I/II | Chemotherapy | cisplatin | SD | |
| CPNE1 | SNV | Missense_Mutation | c.550G>A | p.Glu184Lys | p.E184K | protein_coding | deleterious(0) | probably_damaging(0.98) | TCGA-MU-A5YI-01 | Cervix | cervical & endocervical cancer | Female | <65 | I/II | Unknown | Unknown | PD | ||
| CPNE1 | SNV | Missense_Mutation | c.841N>C | p.Asp281His | p.D281H | protein_coding | deleterious(0) | probably_damaging(0.973) | TCGA-AA-3494-01 | Colorectum | colon adenocarcinoma | Male | <65 | III/IV | Chemotherapy | folinic | PR |
| Page: 1 2 3 4 5 |
Top |
Related drugs of malignant transformation related genes |
| Identification of chemicals and drugs interact with genes involved in malignant transfromation |
| (DGIdb 4.0) |
| Entrez ID | Symbol | Category | Interaction Types | Drug Claim Name | Drug Name | PMIDs |
| Page: 1 |

Copyright 2023-Present -The University of Texas Health Science Center at Houston |