
|
|||||
|
 | |
| |
| |
| |
| |
| |
|
Gene: CORO1A |
Gene summary for CORO1A |
| Gene information | Species | Human | Gene symbol | CORO1A | Gene ID | 11151 |
| Gene name | coronin 1A | |
| Gene Alias | CLABP | |
| Cytomap | 16p11.2 | |
| Gene Type | protein-coding | GO ID | GO:0000902 | UniProtAcc | A0A024R611 |
Top |
Malignant transformation analysis |
| Identification of the aberrant gene expression in precancerous and cancerous lesions by comparing the gene expression of stem-like cells in diseased tissues with normal stem cells |
| Entrez ID | Symbol | Replicates | Species | Organ | Tissue | Adj P-value | Log2FC | Malignancy |
| 11151 | CORO1A | LZE4T | Human | Esophagus | ESCC | 1.10e-14 | 7.34e-01 | 0.0811 |
| 11151 | CORO1A | LZE7T | Human | Esophagus | ESCC | 4.34e-12 | 1.04e+00 | 0.0667 |
| 11151 | CORO1A | LZE8T | Human | Esophagus | ESCC | 9.44e-08 | 6.73e-01 | 0.067 |
| 11151 | CORO1A | LZE22T | Human | Esophagus | ESCC | 1.65e-08 | 4.05e-01 | 0.068 |
| 11151 | CORO1A | LZE24T | Human | Esophagus | ESCC | 1.04e-06 | 2.82e-01 | 0.0596 |
| 11151 | CORO1A | LZE6T | Human | Esophagus | ESCC | 5.13e-27 | 1.84e+00 | 0.0845 |
| 11151 | CORO1A | P2T-E | Human | Esophagus | ESCC | 3.99e-05 | 1.68e-01 | 0.1177 |
| 11151 | CORO1A | P4T-E | Human | Esophagus | ESCC | 5.86e-04 | 1.47e-01 | 0.1323 |
| 11151 | CORO1A | P21T-E | Human | Esophagus | ESCC | 4.36e-03 | 1.29e-01 | 0.1617 |
| 11151 | CORO1A | P28T-E | Human | Esophagus | ESCC | 3.33e-03 | 1.06e-01 | 0.1149 |
| 11151 | CORO1A | P49T-E | Human | Esophagus | ESCC | 4.01e-02 | 3.95e-01 | 0.1768 |
| 11151 | CORO1A | P74T-E | Human | Esophagus | ESCC | 2.40e-08 | 2.94e-01 | 0.1479 |
| 11151 | CORO1A | P75T-E | Human | Esophagus | ESCC | 2.38e-09 | 2.83e-01 | 0.1125 |
| 11151 | CORO1A | P76T-E | Human | Esophagus | ESCC | 3.66e-02 | 9.70e-02 | 0.1207 |
| 11151 | CORO1A | P79T-E | Human | Esophagus | ESCC | 1.05e-03 | 1.56e-01 | 0.1154 |
| 11151 | CORO1A | P83T-E | Human | Esophagus | ESCC | 1.12e-02 | 1.76e-01 | 0.1738 |
| 11151 | CORO1A | P91T-E | Human | Esophagus | ESCC | 8.78e-03 | 2.70e-01 | 0.1828 |
| 11151 | CORO1A | P130T-E | Human | Esophagus | ESCC | 6.55e-08 | 2.63e-01 | 0.1676 |
| 11151 | CORO1A | C04 | Human | Oral cavity | OSCC | 5.38e-05 | 4.11e-01 | 0.2633 |
| 11151 | CORO1A | C21 | Human | Oral cavity | OSCC | 1.83e-23 | 9.88e-01 | 0.2678 |
| Page: 1 2 |
| Tissue | Expression Dynamics | Abbreviation |
| Esophagus |  | ESCC: Esophageal squamous cell carcinoma |
| HGIN: High-grade intraepithelial neoplasias | ||
| LGIN: Low-grade intraepithelial neoplasias | ||
| Oral Cavity | 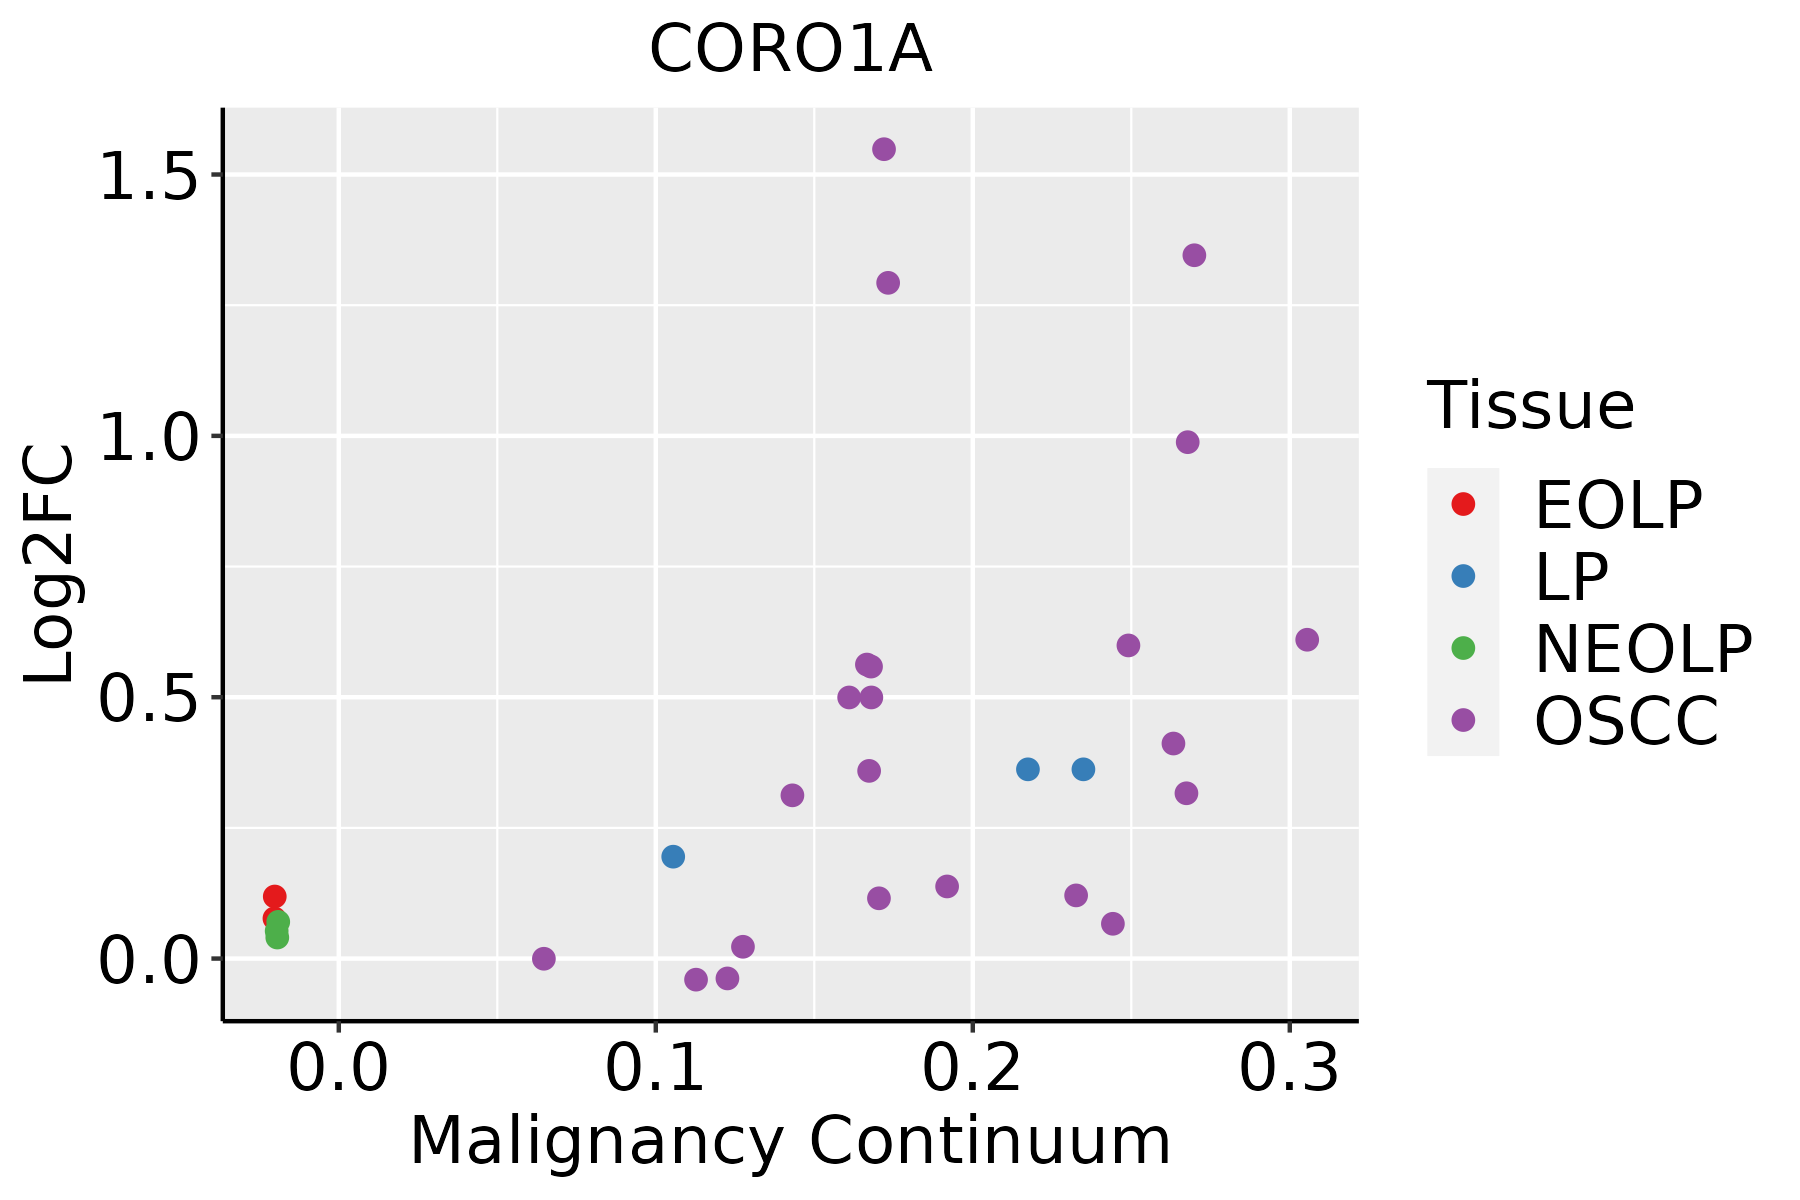 | EOLP: Erosive Oral lichen planus |
| LP: leukoplakia | ||
| NEOLP: Non-erosive oral lichen planus | ||
| OSCC: Oral squamous cell carcinoma | ||
| Skin | 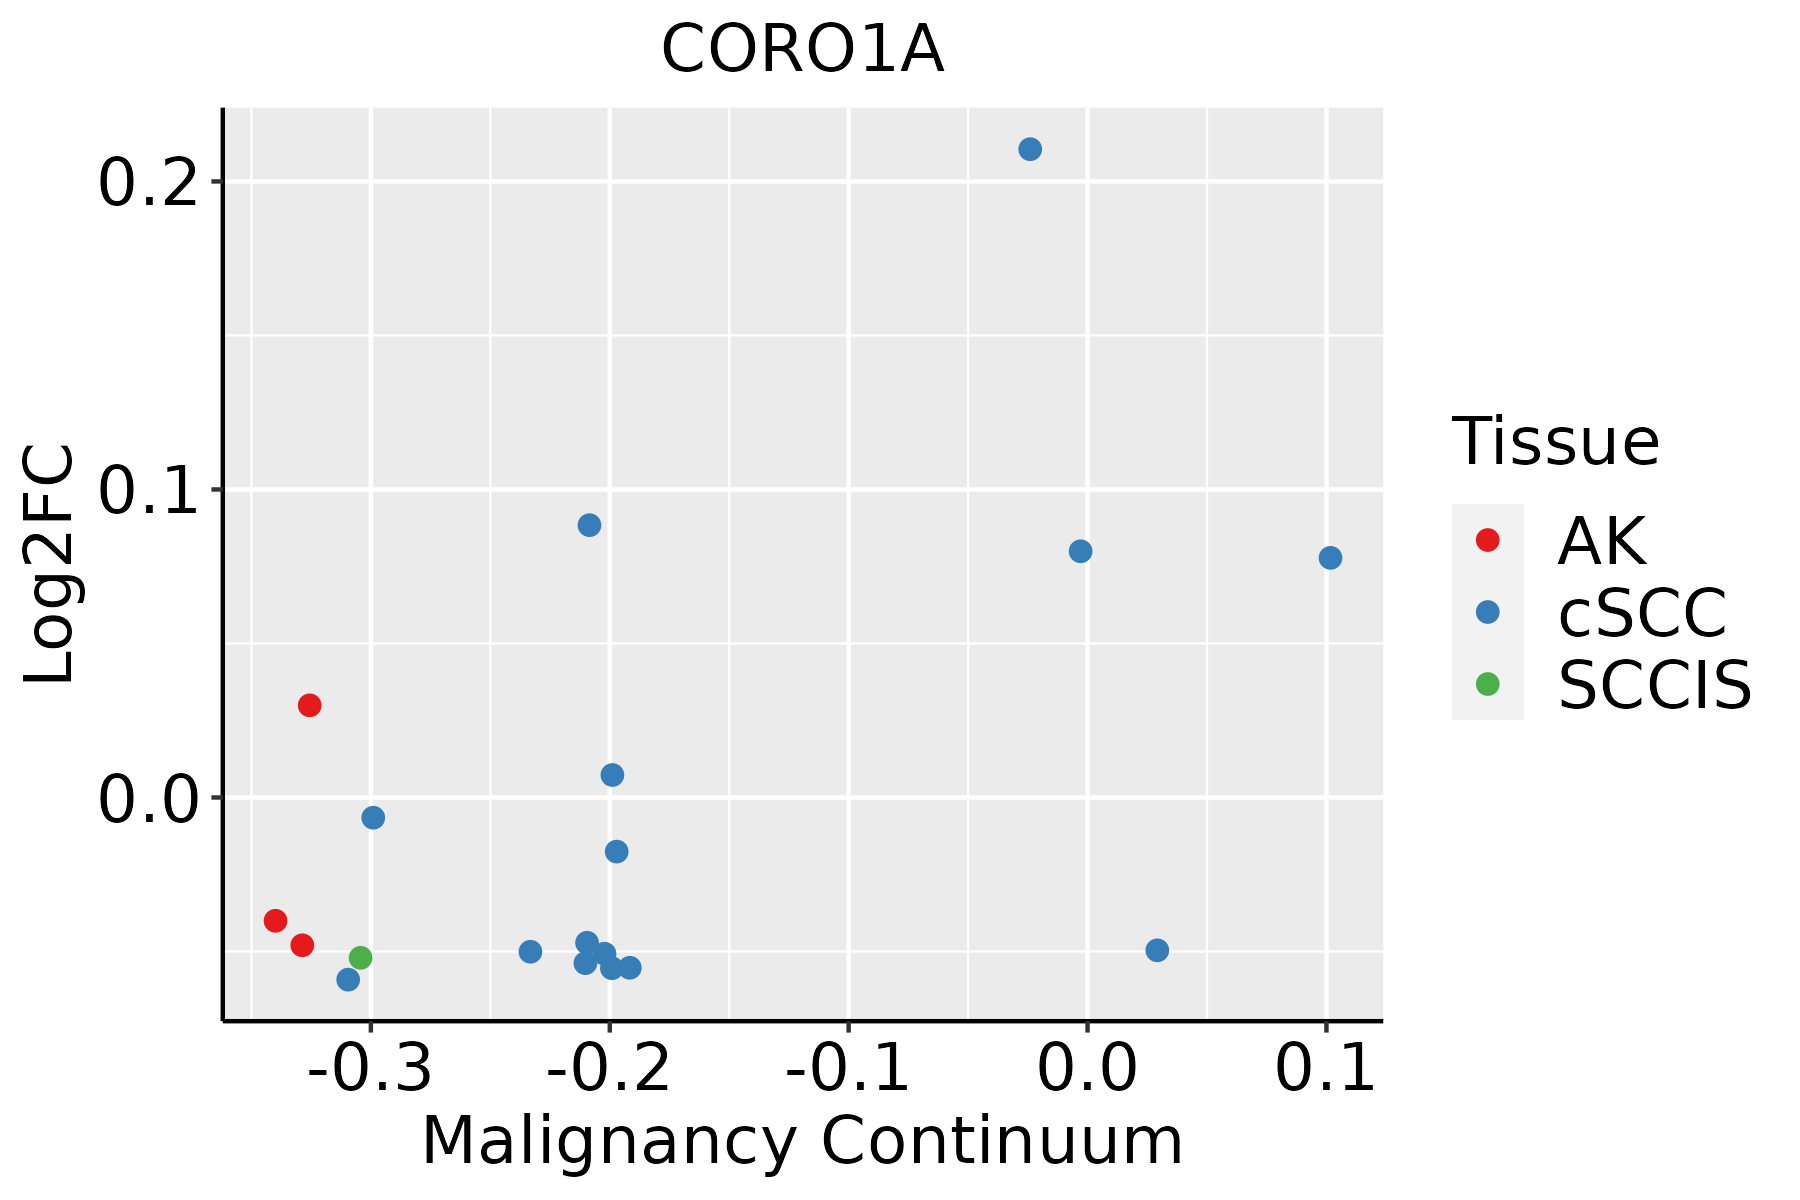 | AK: Actinic keratosis |
| cSCC: Cutaneous squamous cell carcinoma | ||
| SCCIS:squamous cell carcinoma in situ |
| ∗log2FC in expression of this searched gene in stem-like cells from each diseased tissue sample relative to stem-like cells in normal samples in each tissue plotted against the malignancy continuum. Samples are colored based on if they are from different disease stage. |
Top |
Malignant transformation related pathway analysis |
| Find out the enriched GO biological processes and KEGG pathways involved in transition from healthy to precancer to cancer |
| Tissue | Disease Stage | Enriched GO biological Processes |
| Colorectum | AD |  |
| Colorectum | SER |  |
| Colorectum | MSS |  |
| Colorectum | MSI-H |  |
| Colorectum | FAP |  |
| ∗Top 15 enriched GO BP terms are showed in the bar plot of each disease state in each tissue. Each row represents a significant GO biological process which is colored according to the -log10(p.adjust). |
| Page: 1 2 3 4 5 6 7 8 9 |
| GO ID | Tissue | Disease Stage | Description | Gene Ratio | Bg Ratio | pvalue | p.adjust | Count |
| GO:190303716 | Oral cavity | EOLP | regulation of leukocyte cell-cell adhesion | 77/2218 | 336/18723 | 6.89e-09 | 3.53e-07 | 77 |
| GO:005123525 | Oral cavity | EOLP | maintenance of location | 75/2218 | 327/18723 | 1.04e-08 | 4.98e-07 | 75 |
| GO:003253523 | Oral cavity | EOLP | regulation of cellular component size | 83/2218 | 383/18723 | 2.73e-08 | 1.12e-06 | 83 |
| GO:002240719 | Oral cavity | EOLP | regulation of cell-cell adhesion | 93/2218 | 448/18723 | 3.65e-08 | 1.41e-06 | 93 |
| GO:005165125 | Oral cavity | EOLP | maintenance of location in cell | 54/2218 | 214/18723 | 4.26e-08 | 1.64e-06 | 54 |
| GO:011005326 | Oral cavity | EOLP | regulation of actin filament organization | 65/2218 | 278/18723 | 4.55e-08 | 1.72e-06 | 65 |
| GO:005149524 | Oral cavity | EOLP | positive regulation of cytoskeleton organization | 55/2218 | 226/18723 | 1.19e-07 | 3.99e-06 | 55 |
| GO:002260425 | Oral cavity | EOLP | regulation of cell morphogenesis | 69/2218 | 309/18723 | 1.21e-07 | 4.01e-06 | 69 |
| GO:000815424 | Oral cavity | EOLP | actin polymerization or depolymerization | 53/2218 | 218/18723 | 2.08e-07 | 6.55e-06 | 53 |
| GO:001648223 | Oral cavity | EOLP | cytosolic transport | 44/2218 | 168/18723 | 2.40e-07 | 7.45e-06 | 44 |
| GO:003004123 | Oral cavity | EOLP | actin filament polymerization | 48/2218 | 191/18723 | 2.68e-07 | 8.16e-06 | 48 |
| GO:000806422 | Oral cavity | EOLP | regulation of actin polymerization or depolymerization | 47/2218 | 188/18723 | 4.19e-07 | 1.19e-05 | 47 |
| GO:003083324 | Oral cavity | EOLP | regulation of actin filament polymerization | 44/2218 | 172/18723 | 4.90e-07 | 1.34e-05 | 44 |
| GO:003083222 | Oral cavity | EOLP | regulation of actin filament length | 47/2218 | 189/18723 | 4.95e-07 | 1.34e-05 | 47 |
| GO:001605022 | Oral cavity | EOLP | vesicle organization | 65/2218 | 300/18723 | 8.62e-07 | 2.15e-05 | 65 |
| GO:005090014 | Oral cavity | EOLP | leukocyte migration | 74/2218 | 369/18723 | 3.40e-06 | 7.35e-05 | 74 |
| GO:00512517 | Oral cavity | EOLP | positive regulation of lymphocyte activation | 72/2218 | 362/18723 | 6.21e-06 | 1.22e-04 | 72 |
| GO:007066112 | Oral cavity | EOLP | leukocyte proliferation | 65/2218 | 318/18723 | 6.86e-06 | 1.33e-04 | 65 |
| GO:190303915 | Oral cavity | EOLP | positive regulation of leukocyte cell-cell adhesion | 52/2218 | 239/18723 | 9.14e-06 | 1.70e-04 | 52 |
| GO:000836024 | Oral cavity | EOLP | regulation of cell shape | 37/2218 | 154/18723 | 1.80e-05 | 2.90e-04 | 37 |
| Page: 1 2 3 4 5 6 7 8 9 10 11 12 13 |
| Pathway ID | Tissue | Disease Stage | Description | Gene Ratio | Bg Ratio | pvalue | p.adjust | qvalue | Count |
| hsa0414530 | Esophagus | ESCC | Phagosome | 100/4205 | 152/8465 | 3.81e-05 | 1.72e-04 | 8.82e-05 | 100 |
| hsa051527 | Esophagus | ESCC | Tuberculosis | 111/4205 | 180/8465 | 7.14e-04 | 2.32e-03 | 1.19e-03 | 111 |
| hsa04145114 | Esophagus | ESCC | Phagosome | 100/4205 | 152/8465 | 3.81e-05 | 1.72e-04 | 8.82e-05 | 100 |
| hsa0515212 | Esophagus | ESCC | Tuberculosis | 111/4205 | 180/8465 | 7.14e-04 | 2.32e-03 | 1.19e-03 | 111 |
| hsa051526 | Oral cavity | OSCC | Tuberculosis | 105/3704 | 180/8465 | 5.00e-05 | 2.04e-04 | 1.04e-04 | 105 |
| hsa0414528 | Oral cavity | OSCC | Phagosome | 88/3704 | 152/8465 | 2.83e-04 | 9.13e-04 | 4.65e-04 | 88 |
| hsa0515211 | Oral cavity | OSCC | Tuberculosis | 105/3704 | 180/8465 | 5.00e-05 | 2.04e-04 | 1.04e-04 | 105 |
| hsa04145113 | Oral cavity | OSCC | Phagosome | 88/3704 | 152/8465 | 2.83e-04 | 9.13e-04 | 4.65e-04 | 88 |
| hsa0414529 | Oral cavity | LP | Phagosome | 73/2418 | 152/8465 | 2.37e-07 | 3.29e-06 | 2.12e-06 | 73 |
| hsa0515221 | Oral cavity | LP | Tuberculosis | 65/2418 | 180/8465 | 1.60e-02 | 4.92e-02 | 3.17e-02 | 65 |
| hsa0414536 | Oral cavity | LP | Phagosome | 73/2418 | 152/8465 | 2.37e-07 | 3.29e-06 | 2.12e-06 | 73 |
| hsa0515231 | Oral cavity | LP | Tuberculosis | 65/2418 | 180/8465 | 1.60e-02 | 4.92e-02 | 3.17e-02 | 65 |
| hsa0515241 | Oral cavity | EOLP | Tuberculosis | 47/1218 | 180/8465 | 2.19e-05 | 1.18e-04 | 6.96e-05 | 47 |
| hsa0414543 | Oral cavity | EOLP | Phagosome | 38/1218 | 152/8465 | 3.42e-04 | 1.42e-03 | 8.35e-04 | 38 |
| hsa0515251 | Oral cavity | EOLP | Tuberculosis | 47/1218 | 180/8465 | 2.19e-05 | 1.18e-04 | 6.96e-05 | 47 |
| hsa0414553 | Oral cavity | EOLP | Phagosome | 38/1218 | 152/8465 | 3.42e-04 | 1.42e-03 | 8.35e-04 | 38 |
| Page: 1 |
Top |
Cell-cell communication analysis |
| Identification of potential cell-cell interactions between two cell types and their ligand-receptor pairs for different disease states |
| Ligand | Receptor | LRpair | Pathway | Tissue | Disease Stage |
| Page: 1 |
Top |
Single-cell gene regulatory network inference analysis |
| Find out the significant the regulons (TFs) and the target genes of each regulon across cell types for different disease states |
| TF | Cell Type | Tissue | Disease Stage | Target Gene | RSS | Regulon Activity |
| ∗The dot plots of a searched regulon are shown for all cell subpopulations in each disease state of each tissue based on the regulon specific score inferred using pySCENIC and by calculating the average expression. |
| Page: 1 |
Top |
Somatic mutation of malignant transformation related genes |
| Annotation of somatic variants for genes involved in malignant transformation |
| Hugo Symbol | Variant Class | Variant Classification | dbSNP RS | HGVSc | HGVSp | HGVSp Short | SWISSPROT | BIOTYPE | SIFT | PolyPhen | Tumor Sample Barcode | Tissue | Histology | Sex | Age | Stage | Therapy Types | Drugs | Outcome |
| CORO1A | SNV | Missense_Mutation | c.337G>C | p.Asp113His | p.D113H | P31146 | protein_coding | deleterious(0) | benign(0.255) | TCGA-BH-A1FU-01 | Breast | breast invasive carcinoma | Female | <65 | I/II | Unknown | Unknown | PD | |
| CORO1A | SNV | Missense_Mutation | c.1102G>A | p.Ala368Thr | p.A368T | P31146 | protein_coding | tolerated(0.08) | benign(0.051) | TCGA-C5-A7X5-01 | Cervix | cervical & endocervical cancer | Female | >=65 | I/II | Chemotherapy | carboplatin | PD | |
| CORO1A | SNV | Missense_Mutation | novel | c.686N>C | p.Val229Ala | p.V229A | P31146 | protein_coding | deleterious(0.02) | benign(0.007) | TCGA-DG-A2KM-01 | Cervix | cervical & endocervical cancer | Female | <65 | I/II | Chemotherapy | cisplatin | SD |
| CORO1A | SNV | Missense_Mutation | c.844N>A | p.Val282Ile | p.V282I | P31146 | protein_coding | tolerated(0.45) | benign(0.01) | TCGA-A6-2686-01 | Colorectum | colon adenocarcinoma | Female | >=65 | I/II | Unknown | Unknown | SD | |
| CORO1A | SNV | Missense_Mutation | c.1102N>A | p.Ala368Thr | p.A368T | P31146 | protein_coding | tolerated(0.08) | benign(0.051) | TCGA-AA-A022-01 | Colorectum | colon adenocarcinoma | Female | >=65 | I/II | Unknown | Unknown | SD | |
| CORO1A | SNV | Missense_Mutation | rs143294920 | c.373N>A | p.Val125Ile | p.V125I | P31146 | protein_coding | tolerated(0.15) | benign(0.086) | TCGA-AZ-4313-01 | Colorectum | colon adenocarcinoma | Female | <65 | I/II | Unknown | Unknown | SD |
| CORO1A | SNV | Missense_Mutation | c.62C>T | p.Ala21Val | p.A21V | P31146 | protein_coding | deleterious(0.02) | benign(0.099) | TCGA-CK-4951-01 | Colorectum | colon adenocarcinoma | Female | >=65 | I/II | Unknown | Unknown | PD | |
| CORO1A | SNV | Missense_Mutation | c.418C>A | p.His140Asn | p.H140N | P31146 | protein_coding | deleterious(0.03) | probably_damaging(0.973) | TCGA-D5-5540-01 | Colorectum | colon adenocarcinoma | Male | >=65 | I/II | Unknown | Unknown | SD | |
| CORO1A | SNV | Missense_Mutation | c.549N>G | p.Asp183Glu | p.D183E | P31146 | protein_coding | tolerated(0.05) | benign(0) | TCGA-D5-6530-01 | Colorectum | colon adenocarcinoma | Male | <65 | I/II | Unknown | Unknown | SD | |
| CORO1A | SNV | Missense_Mutation | novel | c.776N>C | p.Leu259Pro | p.L259P | P31146 | protein_coding | deleterious(0) | probably_damaging(0.985) | TCGA-DM-A1D6-01 | Colorectum | colon adenocarcinoma | Male | >=65 | I/II | Unknown | Unknown | SD |
| Page: 1 2 3 4 |
Top |
Related drugs of malignant transformation related genes |
| Identification of chemicals and drugs interact with genes involved in malignant transfromation |
| (DGIdb 4.0) |
| Entrez ID | Symbol | Category | Interaction Types | Drug Claim Name | Drug Name | PMIDs |
| Page: 1 |

Copyright 2023-Present -The University of Texas Health Science Center at Houston |