| Tissue | Expression Dynamics | Abbreviation |
| Cervix | 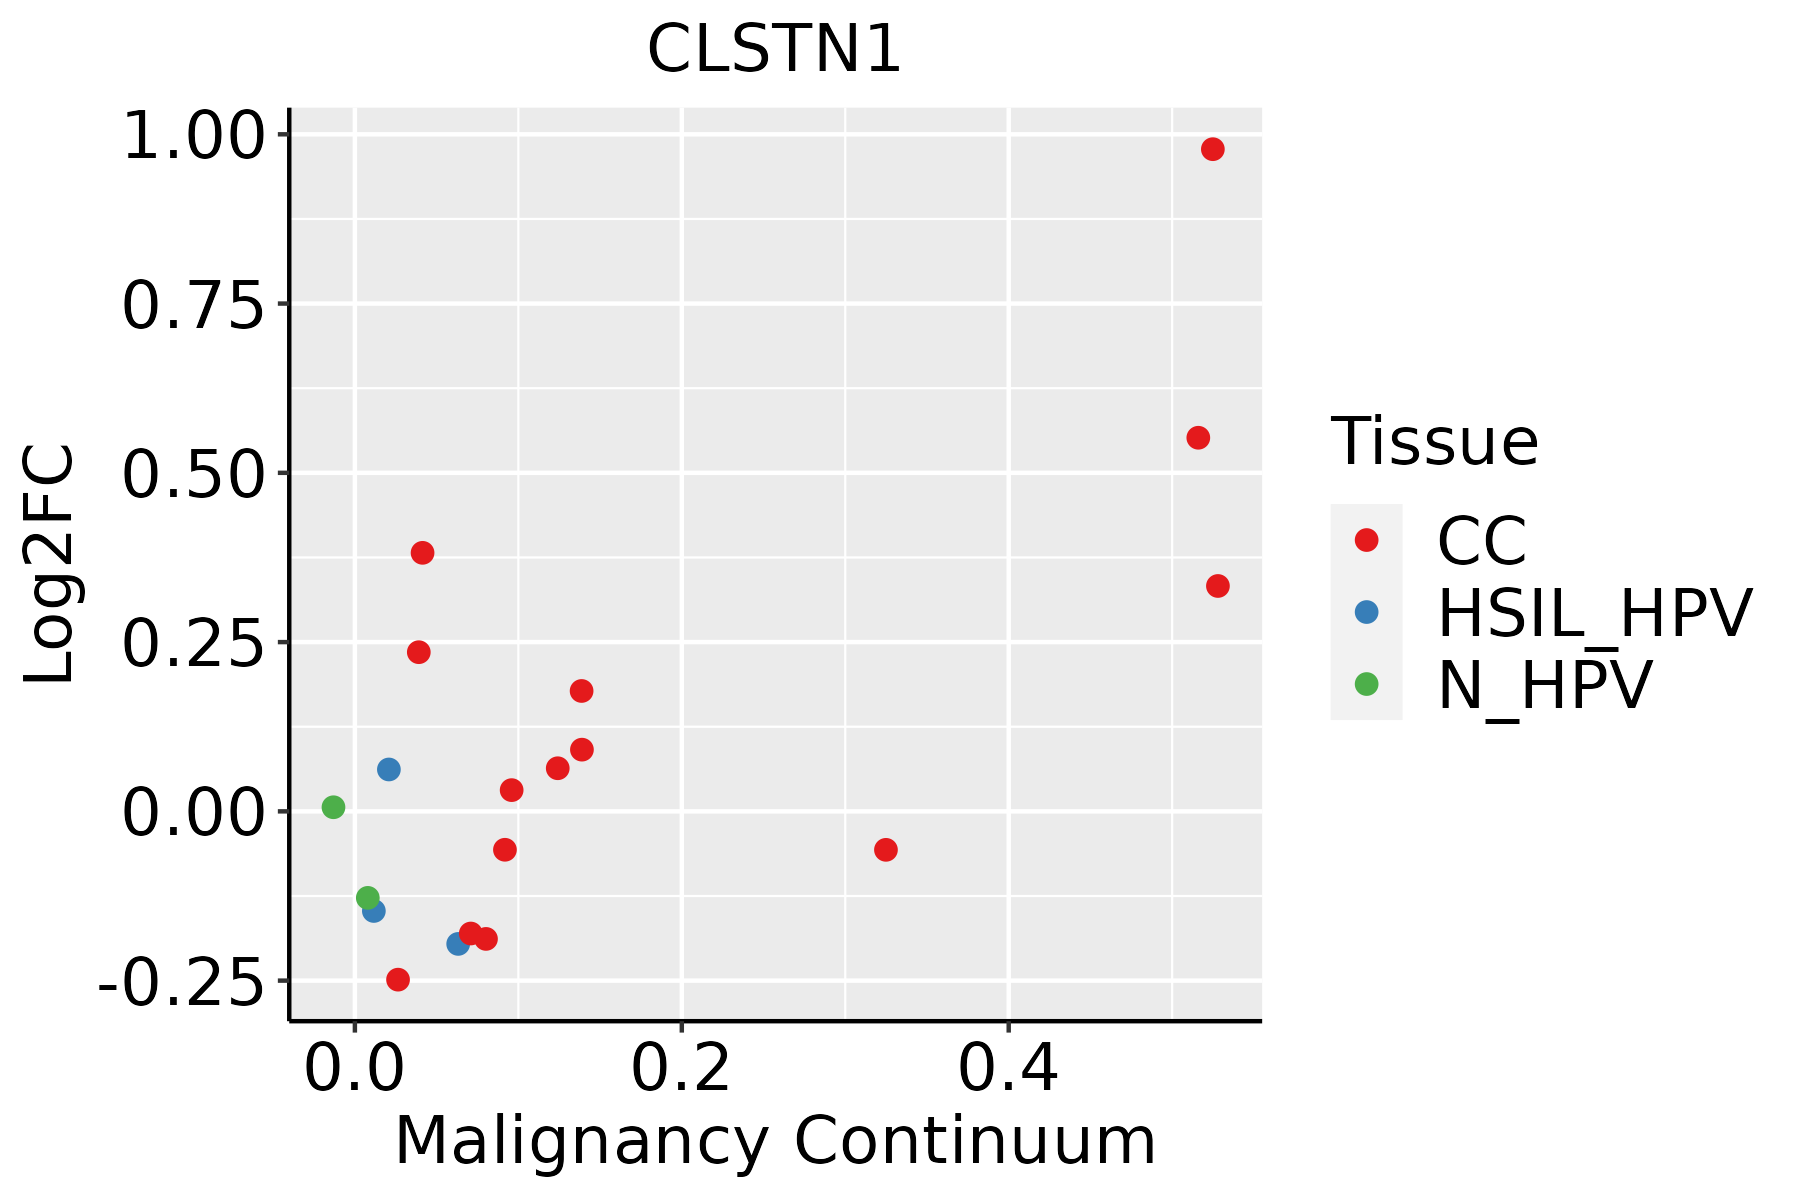 | CC: Cervix cancer |
| HSIL_HPV: HPV-infected high-grade squamous intraepithelial lesions |
| N_HPV: HPV-infected normal cervix |
| Colorectum (GSE201348) | 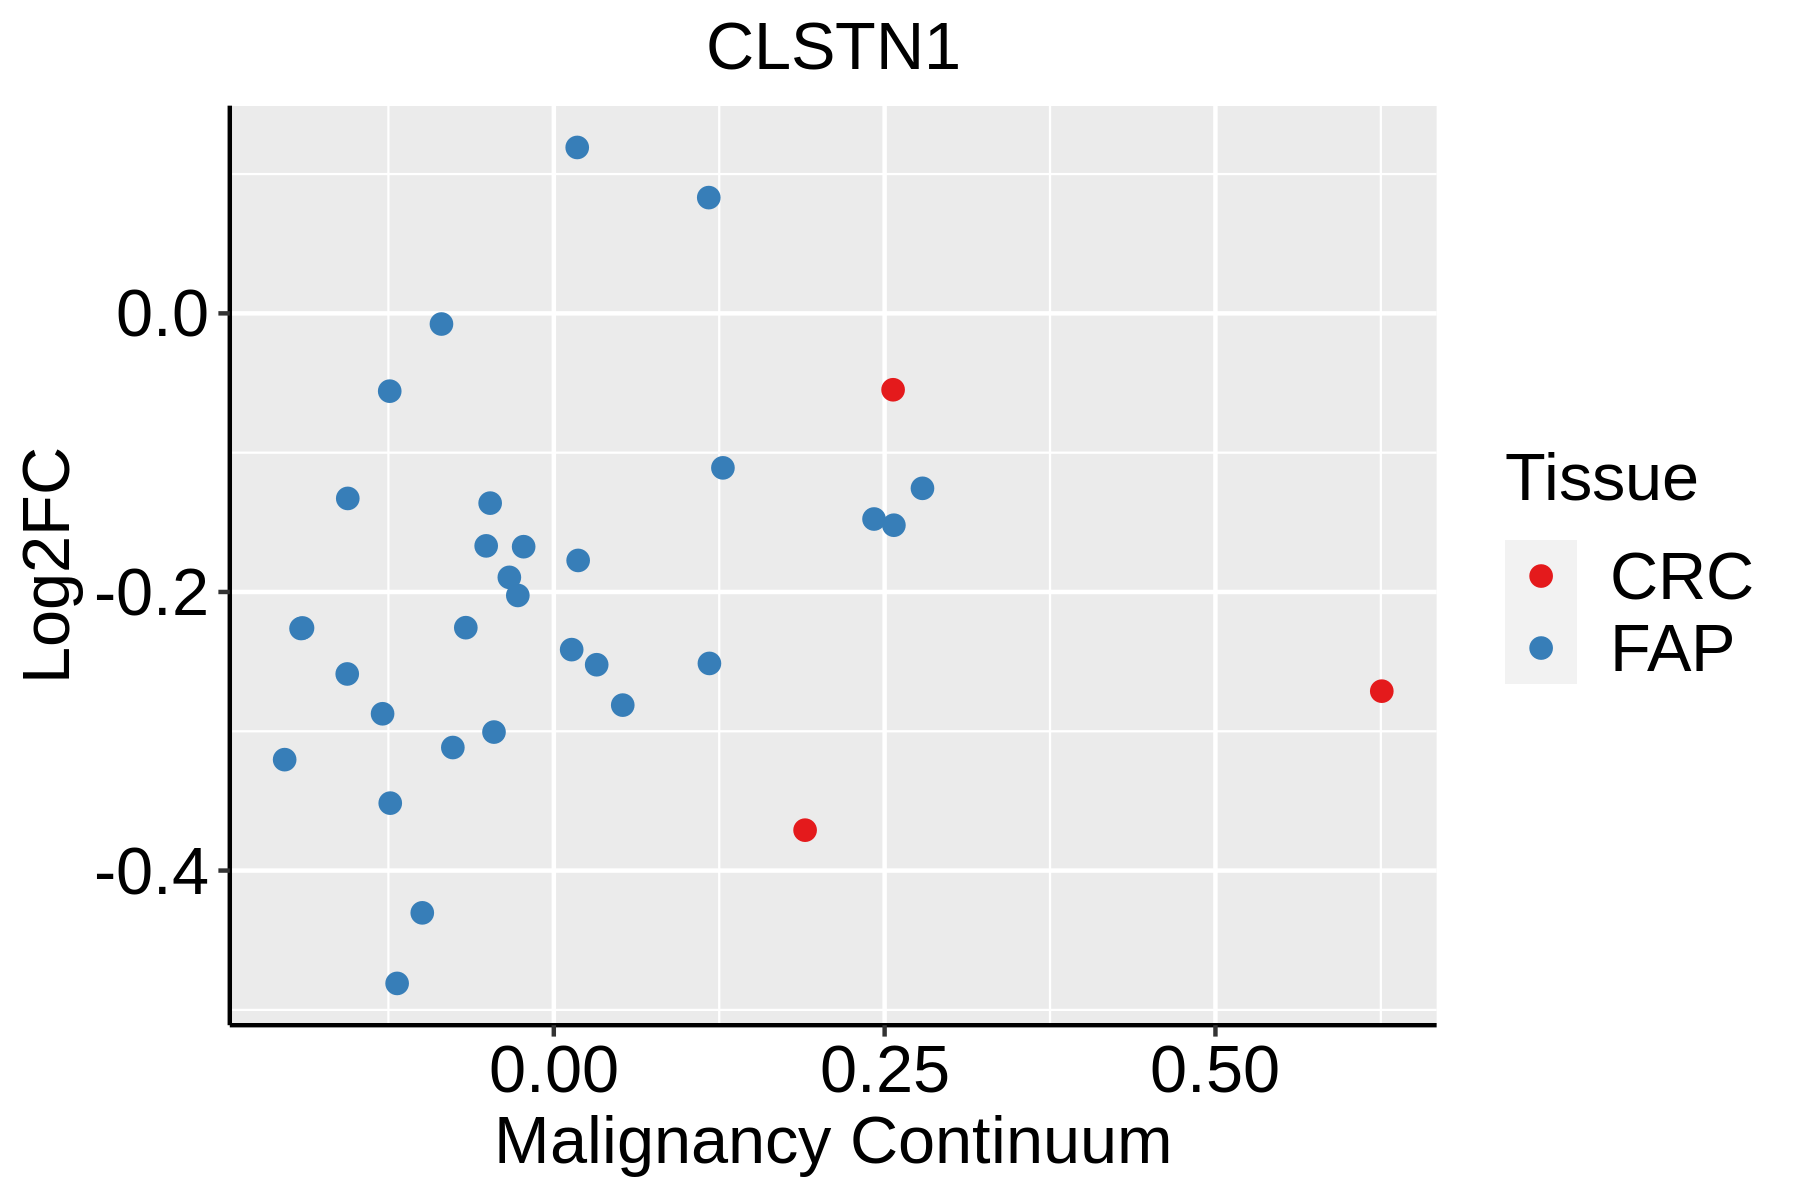 | FAP: Familial adenomatous polyposis |
| CRC: Colorectal cancer |
| Colorectum (HTA11) |  | AD: Adenomas |
| SER: Sessile serrated lesions |
| MSI-H: Microsatellite-high colorectal cancer |
| MSS: Microsatellite stable colorectal cancer |
| Esophagus | 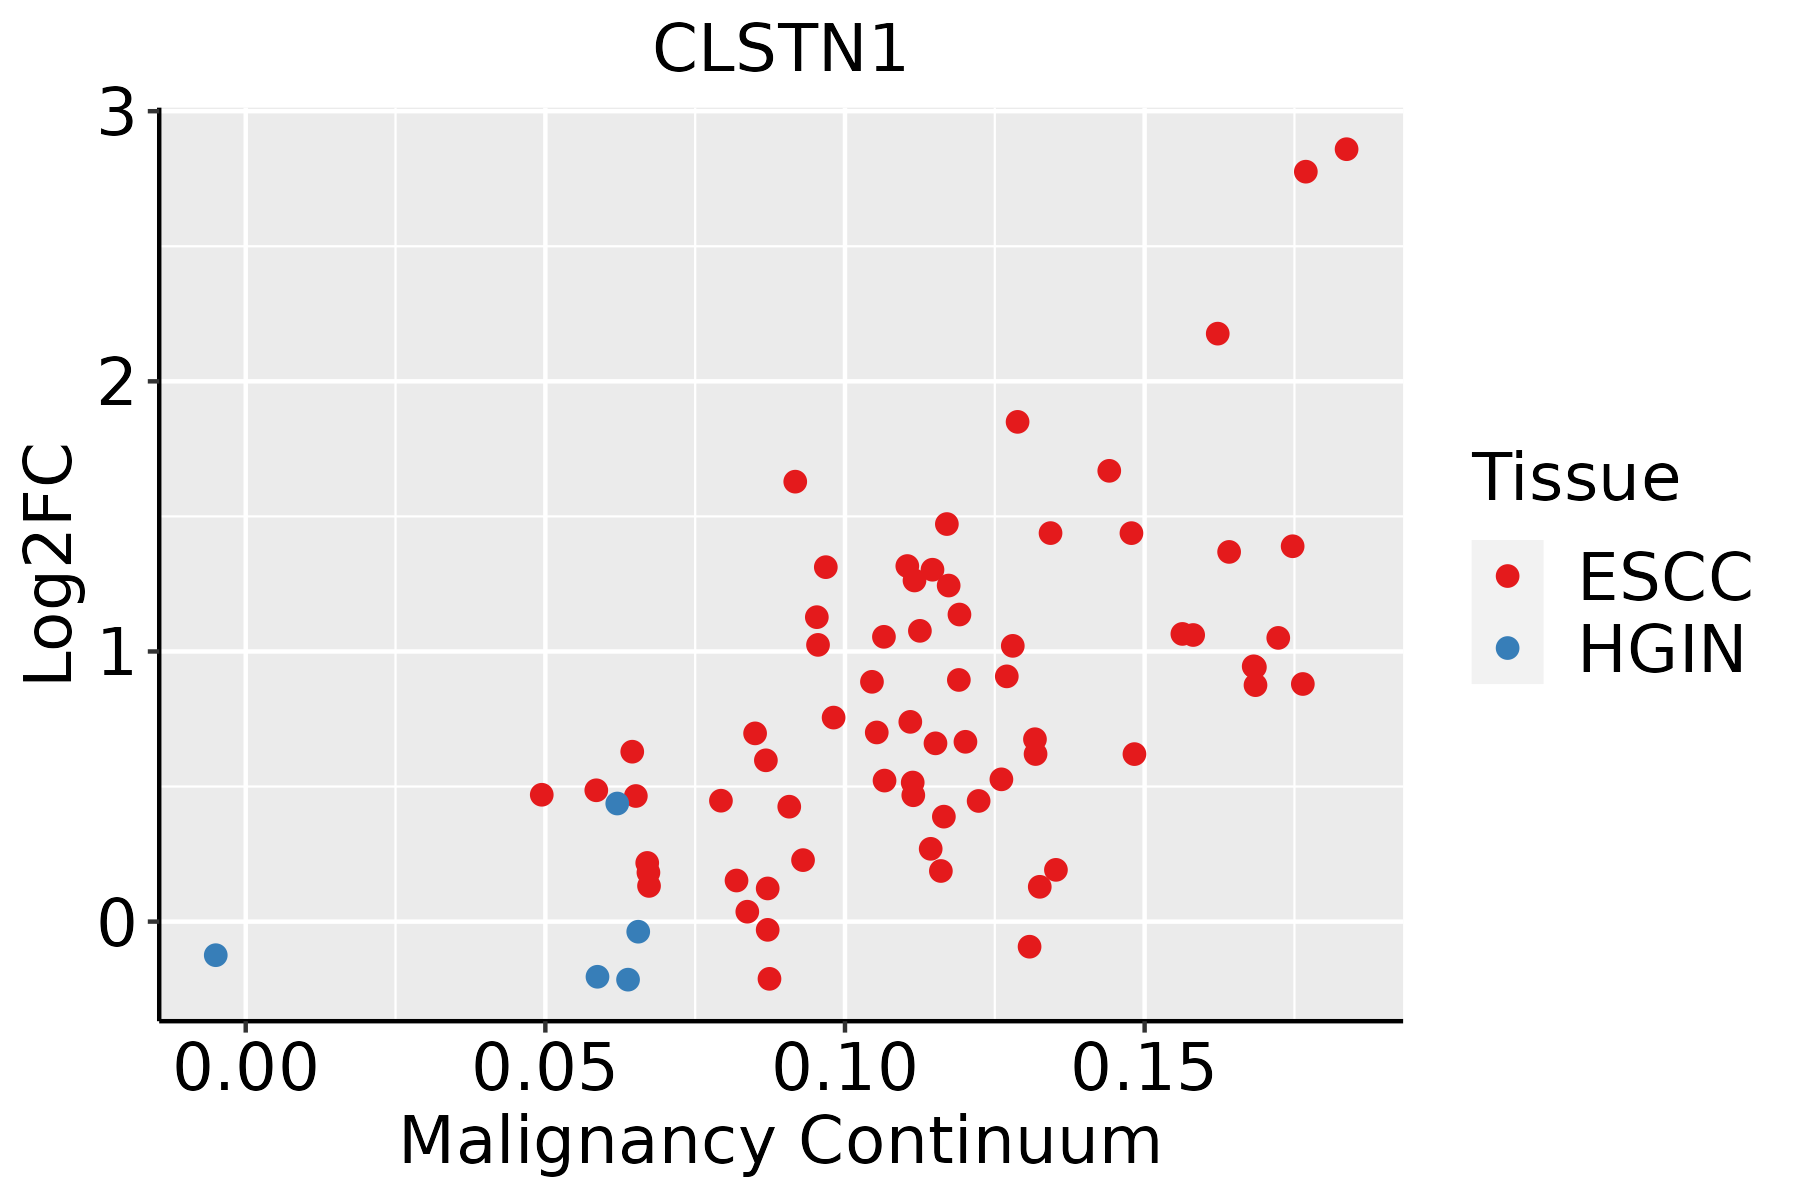 | ESCC: Esophageal squamous cell carcinoma |
| HGIN: High-grade intraepithelial neoplasias |
| LGIN: Low-grade intraepithelial neoplasias |
| Liver |  | HCC: Hepatocellular carcinoma |
| NAFLD: Non-alcoholic fatty liver disease |
| Oral Cavity | 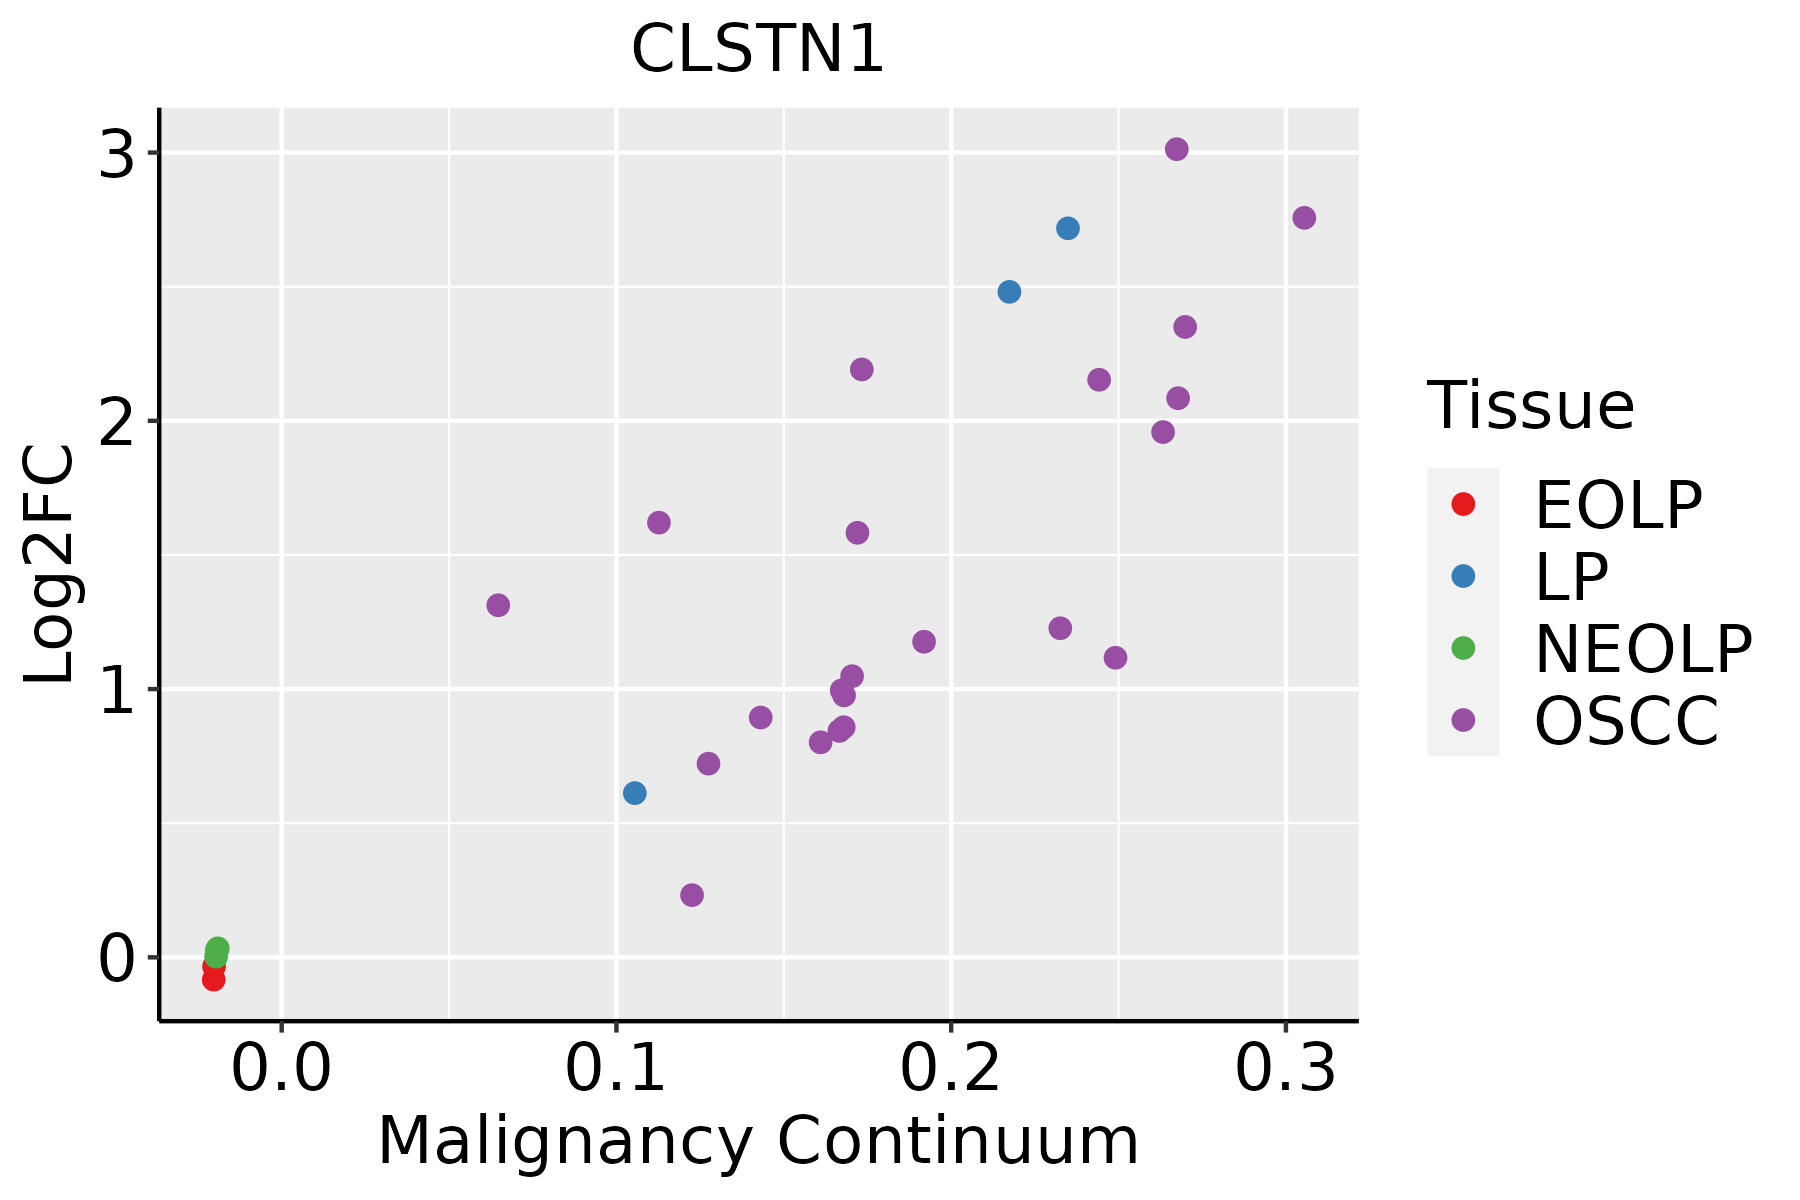 | EOLP: Erosive Oral lichen planus |
| LP: leukoplakia |
| NEOLP: Non-erosive oral lichen planus |
| OSCC: Oral squamous cell carcinoma |
| Prostate | 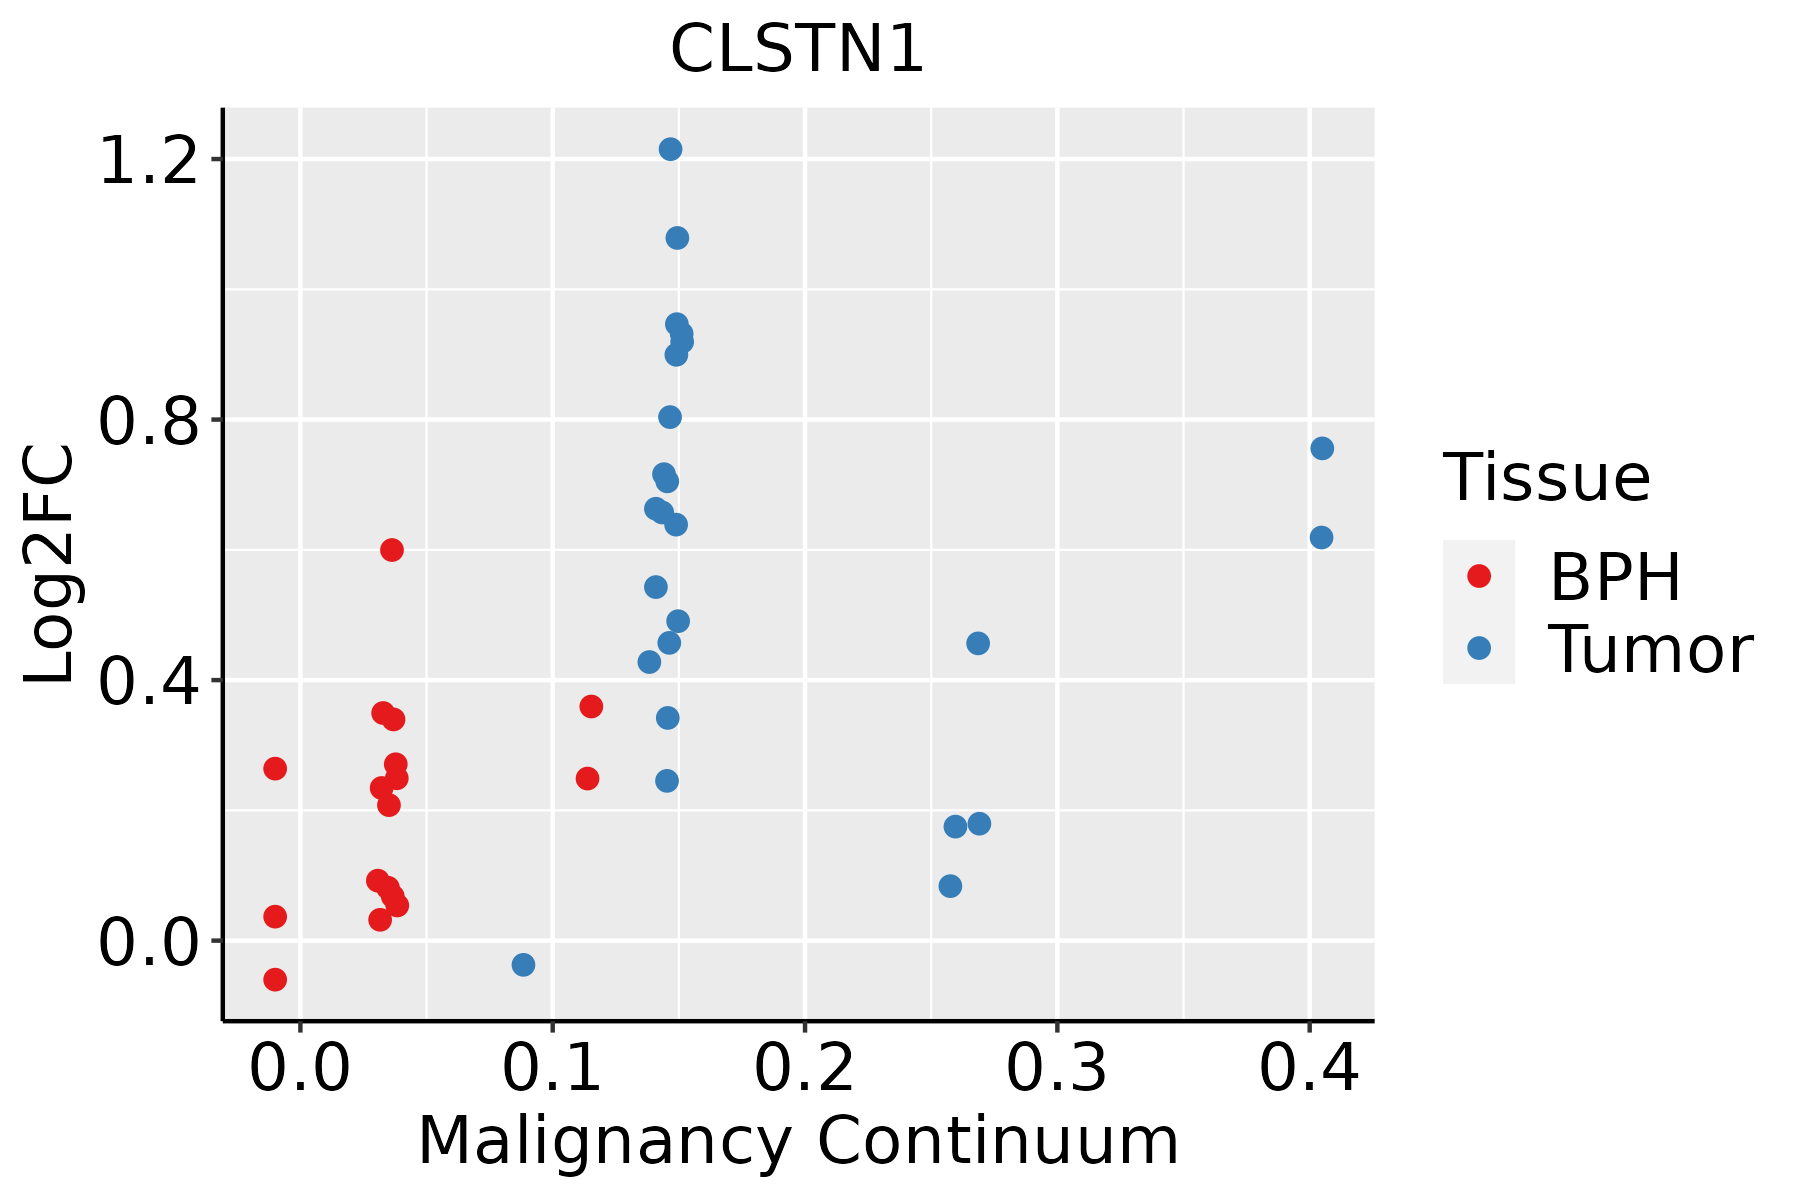 | BPH: Benign Prostatic Hyperplasia |
| Skin | 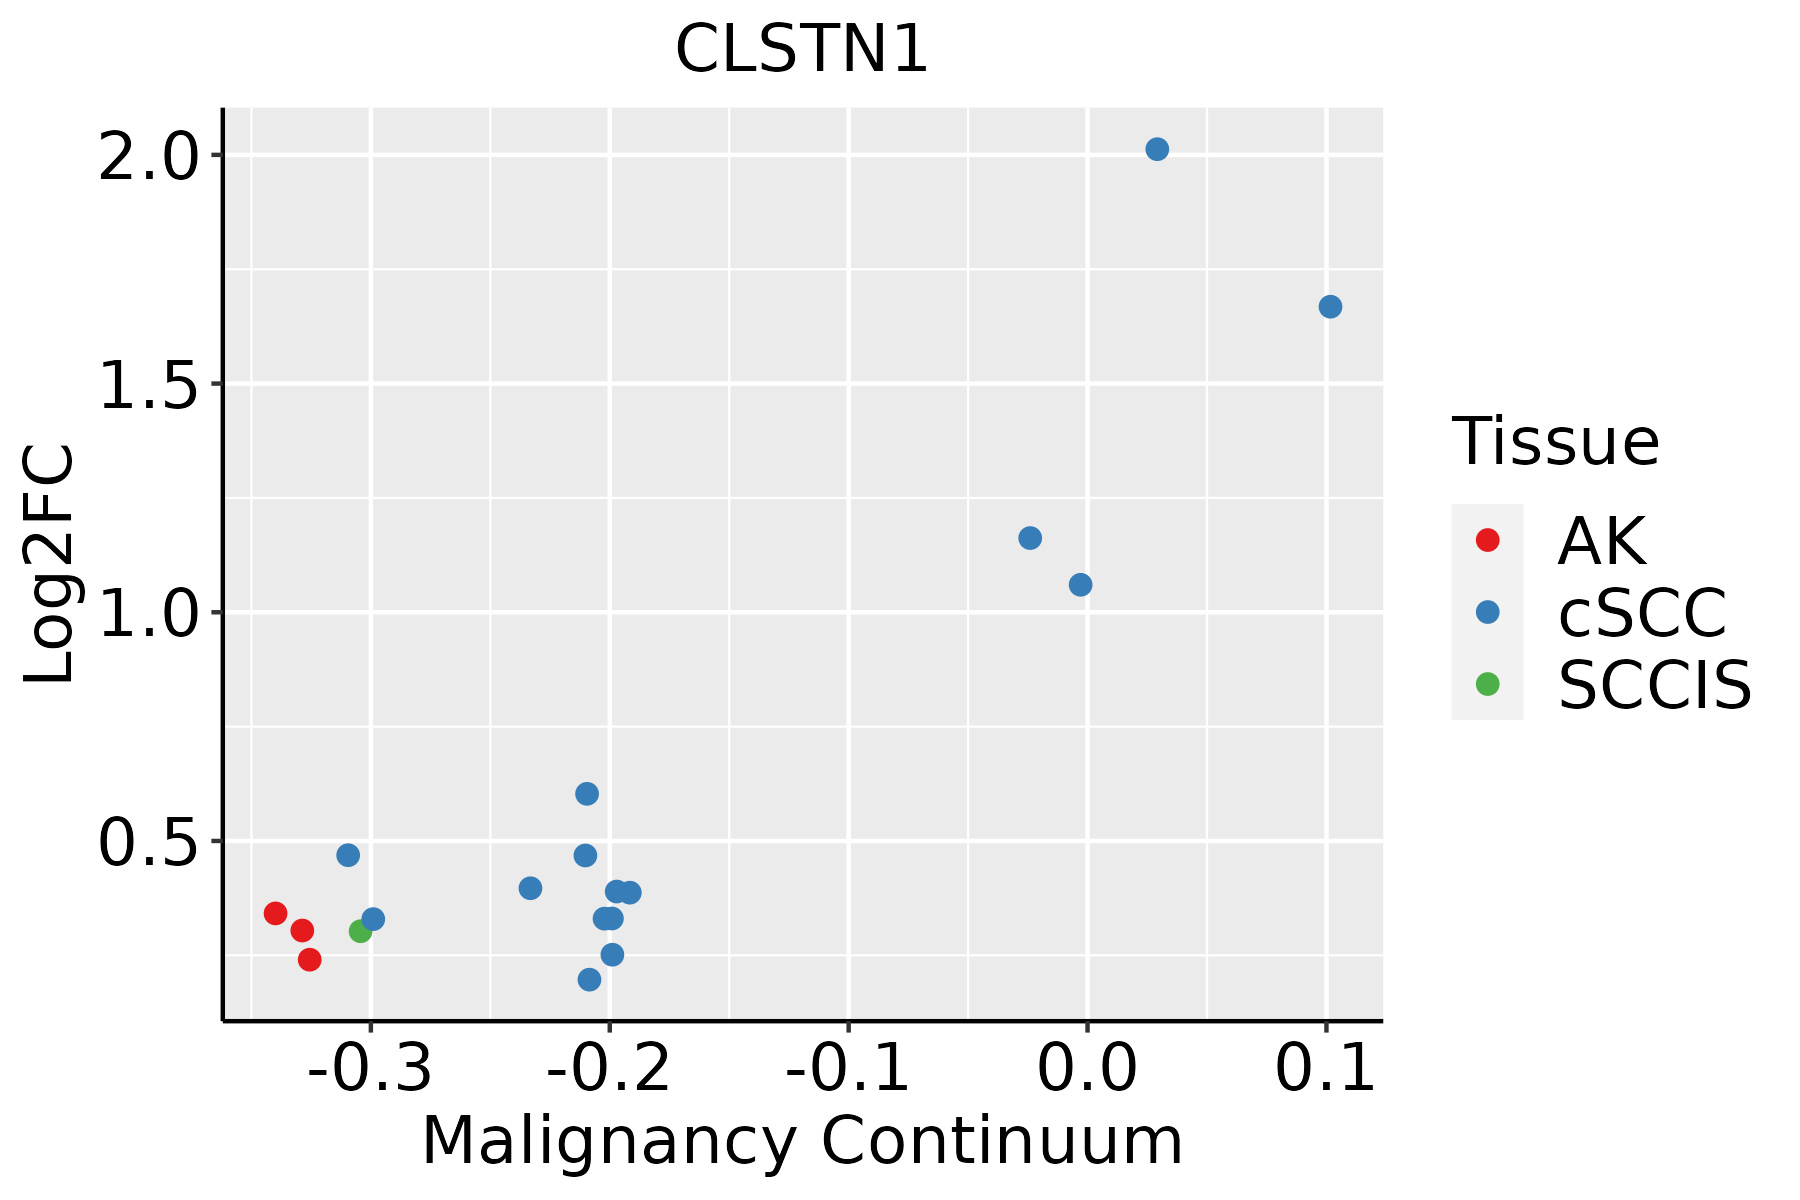 | AK: Actinic keratosis |
| cSCC: Cutaneous squamous cell carcinoma |
| SCCIS:squamous cell carcinoma in situ |
| Thyroid | 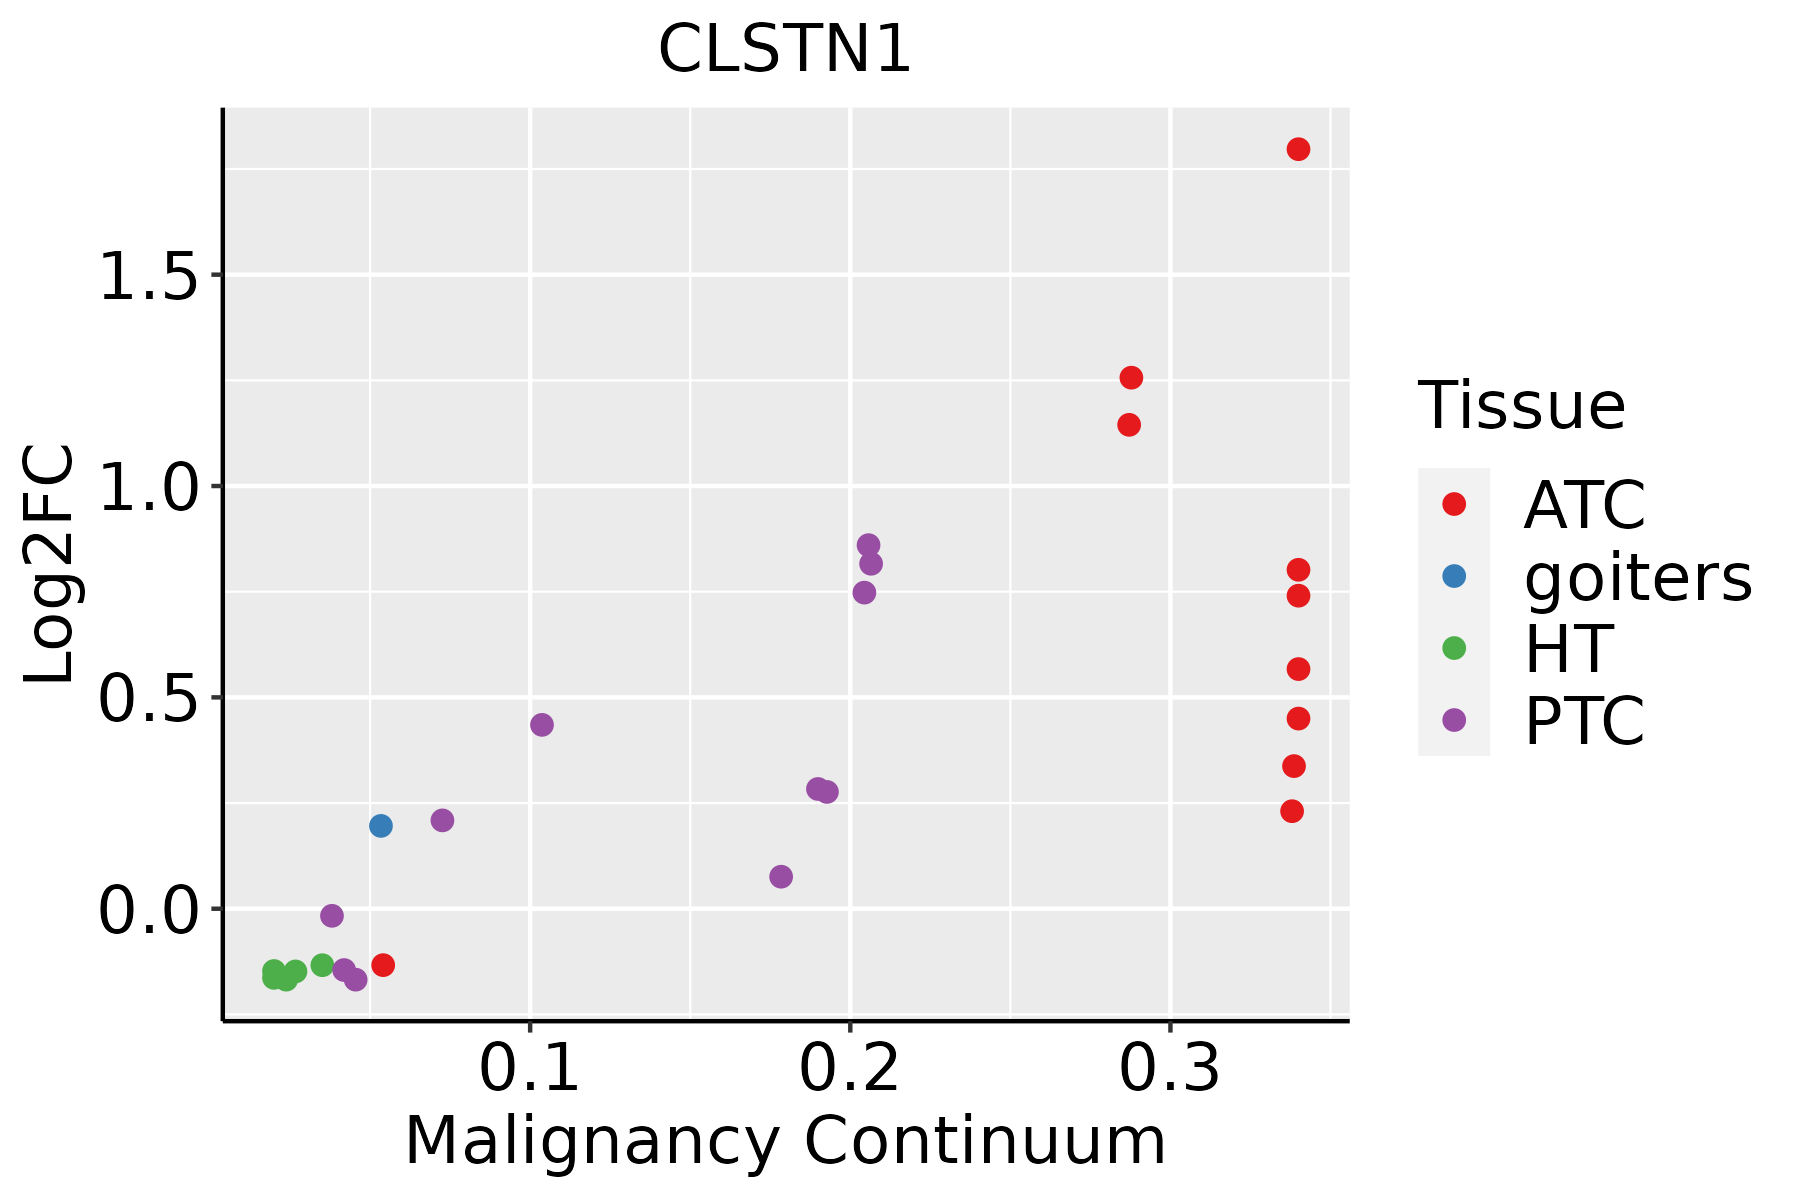 | ATC: Anaplastic thyroid cancer |
| HT: Hashimoto's thyroiditis |
| PTC: Papillary thyroid cancer |
| GO ID | Tissue | Disease Stage | Description | Gene Ratio | Bg Ratio | pvalue | p.adjust | Count |
| GO:000155825 | Thyroid | HT | regulation of cell growth | 47/1272 | 414/18723 | 3.77e-04 | 4.76e-03 | 47 |
| GO:199077825 | Thyroid | HT | protein localization to cell periphery | 39/1272 | 333/18723 | 6.29e-04 | 7.21e-03 | 39 |
| GO:00519627 | Thyroid | HT | positive regulation of nervous system development | 31/1272 | 272/18723 | 3.27e-03 | 2.58e-02 | 31 |
| GO:0090150112 | Thyroid | PTC | establishment of protein localization to membrane | 149/5968 | 260/18723 | 1.64e-17 | 1.59e-15 | 149 |
| GO:1990778111 | Thyroid | PTC | protein localization to cell periphery | 172/5968 | 333/18723 | 3.71e-14 | 2.30e-12 | 172 |
| GO:0016049112 | Thyroid | PTC | cell growth | 225/5968 | 482/18723 | 4.75e-12 | 2.07e-10 | 225 |
| GO:0001558111 | Thyroid | PTC | regulation of cell growth | 188/5968 | 414/18723 | 4.13e-09 | 1.09e-07 | 188 |
| GO:009887618 | Thyroid | PTC | vesicle-mediated transport to the plasma membrane | 74/5968 | 136/18723 | 4.20e-08 | 9.08e-07 | 74 |
| GO:00315037 | Thyroid | PTC | protein-containing complex localization | 107/5968 | 220/18723 | 1.47e-07 | 2.82e-06 | 107 |
| GO:0034329111 | Thyroid | PTC | cell junction assembly | 180/5968 | 420/18723 | 1.17e-06 | 1.69e-05 | 180 |
| GO:005196214 | Thyroid | PTC | positive regulation of nervous system development | 117/5968 | 272/18723 | 6.72e-05 | 5.89e-04 | 117 |
| GO:00519608 | Thyroid | PTC | regulation of nervous system development | 177/5968 | 443/18723 | 1.72e-04 | 1.32e-03 | 177 |
| GO:190188817 | Thyroid | PTC | regulation of cell junction assembly | 88/5968 | 204/18723 | 4.50e-04 | 2.97e-03 | 88 |
| GO:19024145 | Thyroid | PTC | protein localization to cell junction | 43/5968 | 94/18723 | 3.32e-03 | 1.62e-02 | 43 |
| GO:00508089 | Thyroid | PTC | synapse organization | 161/5968 | 426/18723 | 5.11e-03 | 2.36e-02 | 161 |
| GO:00508074 | Thyroid | PTC | regulation of synapse organization | 84/5968 | 211/18723 | 8.72e-03 | 3.64e-02 | 84 |
| GO:00508032 | Thyroid | PTC | regulation of synapse structure or activity | 86/5968 | 218/18723 | 1.05e-02 | 4.23e-02 | 86 |
| GO:009015031 | Thyroid | ATC | establishment of protein localization to membrane | 150/6293 | 260/18723 | 1.05e-15 | 7.96e-14 | 150 |
| GO:199077826 | Thyroid | ATC | protein localization to cell periphery | 181/6293 | 333/18723 | 3.72e-15 | 2.56e-13 | 181 |
| GO:001604927 | Thyroid | ATC | cell growth | 241/6293 | 482/18723 | 4.27e-14 | 2.35e-12 | 241 |
| Hugo Symbol | Variant Class | Variant Classification | dbSNP RS | HGVSc | HGVSp | HGVSp Short | SWISSPROT | BIOTYPE | SIFT | PolyPhen | Tumor Sample Barcode | Tissue | Histology | Sex | Age | Stage | Therapy Types | Drugs | Outcome |
| CLSTN1 | SNV | Missense_Mutation | rs751480577 | c.1498N>A | p.Val500Met | p.V500M | O94985 | protein_coding | tolerated(0.35) | probably_damaging(0.942) | TCGA-A2-A3XV-01 | Breast | breast invasive carcinoma | Female | <65 | I/II | Chemotherapy | carboplatin | CR |
| CLSTN1 | SNV | Missense_Mutation | rs201194236 | c.2146N>A | p.Asp716Asn | p.D716N | O94985 | protein_coding | tolerated(1) | benign(0.003) | TCGA-BH-A0HP-01 | Breast | breast invasive carcinoma | Female | >=65 | III/IV | Chemotherapy | doxorubicin | SD |
| CLSTN1 | SNV | Missense_Mutation | rs749257979 | c.2896N>A | p.Ala966Thr | p.A966T | O94985 | protein_coding | tolerated(0.32) | benign(0.001) | TCGA-D8-A1JA-01 | Breast | breast invasive carcinoma | Female | <65 | III/IV | Chemotherapy | adriamycin | PD |
| CLSTN1 | SNV | Missense_Mutation | | c.1270N>T | p.Gly424Trp | p.G424W | O94985 | protein_coding | deleterious(0) | probably_damaging(0.994) | TCGA-EW-A6S9-01 | Breast | breast invasive carcinoma | Female | <65 | I/II | Unknown | Unknown | SD |
| CLSTN1 | insertion | Frame_Shift_Ins | novel | c.1656dupG | p.Lys553GlufsTer48 | p.K553Efs*48 | O94985 | protein_coding | | | TCGA-BH-A0DP-01 | Breast | breast invasive carcinoma | Female | <65 | I/II | Hormone Therapy | arimidex | SD |
| CLSTN1 | insertion | In_Frame_Ins | novel | c.1654_1655insCGCCAGTGCTTCCCAAACGACCCATGGGGA | p.Asp551_Lys552insThrProValLeuProLysArgProMetGly | p.D551_K552insTPVLPKRPMG | O94985 | protein_coding | | | TCGA-BH-A0DP-01 | Breast | breast invasive carcinoma | Female | <65 | I/II | Hormone Therapy | arimidex | SD |
| CLSTN1 | insertion | Frame_Shift_Ins | novel | c.774_775insG | p.Pro259AlafsTer15 | p.P259Afs*15 | O94985 | protein_coding | | | TCGA-BH-A0H7-01 | Breast | breast invasive carcinoma | Female | >=65 | III/IV | Chemotherapy | doxorubicin | SD |
| CLSTN1 | insertion | Frame_Shift_Ins | novel | c.772_773insGACAGAGTCTCACTCTGTCACCC | p.Lys258ArgfsTer56 | p.K258Rfs*56 | O94985 | protein_coding | | | TCGA-BH-A0H7-01 | Breast | breast invasive carcinoma | Female | >=65 | III/IV | Chemotherapy | doxorubicin | SD |
| CLSTN1 | deletion | Frame_Shift_Del | novel | c.755delT | p.Leu252TrpfsTer2 | p.L252Wfs*2 | O94985 | protein_coding | | | TCGA-D8-A27V-01 | Breast | breast invasive carcinoma | Female | <65 | I/II | Hormone Therapy | tamoxiphen | SD |
| CLSTN1 | SNV | Missense_Mutation | rs778535987 | c.709G>A | p.Val237Ile | p.V237I | O94985 | protein_coding | tolerated(0.07) | probably_damaging(0.997) | TCGA-2W-A8YY-01 | Cervix | cervical & endocervical cancer | Female | <65 | I/II | Chemotherapy | cisplatin | CR |


