
|
|||||
|
 | |
| |
| |
| |
| |
| |
|
Gene: CLOCK |
Gene summary for CLOCK |
| Gene information | Species | Human | Gene symbol | CLOCK | Gene ID | 9575 |
| Gene name | clock circadian regulator | |
| Gene Alias | KAT13D | |
| Cytomap | 4q12 | |
| Gene Type | protein-coding | GO ID | GO:0000003 | UniProtAcc | O15516 |
Top |
Malignant transformation analysis |
| Identification of the aberrant gene expression in precancerous and cancerous lesions by comparing the gene expression of stem-like cells in diseased tissues with normal stem cells |
| Entrez ID | Symbol | Replicates | Species | Organ | Tissue | Adj P-value | Log2FC | Malignancy |
| 9575 | CLOCK | LZE7T | Human | Esophagus | ESCC | 3.67e-02 | 3.49e-01 | 0.0667 |
| 9575 | CLOCK | LZE24T | Human | Esophagus | ESCC | 1.39e-10 | 1.05e-01 | 0.0596 |
| 9575 | CLOCK | P1T-E | Human | Esophagus | ESCC | 2.82e-08 | 4.13e-01 | 0.0875 |
| 9575 | CLOCK | P2T-E | Human | Esophagus | ESCC | 3.42e-16 | 2.87e-01 | 0.1177 |
| 9575 | CLOCK | P4T-E | Human | Esophagus | ESCC | 3.37e-10 | 2.44e-01 | 0.1323 |
| 9575 | CLOCK | P5T-E | Human | Esophagus | ESCC | 1.34e-03 | 7.07e-02 | 0.1327 |
| 9575 | CLOCK | P8T-E | Human | Esophagus | ESCC | 2.60e-19 | 3.46e-01 | 0.0889 |
| 9575 | CLOCK | P9T-E | Human | Esophagus | ESCC | 1.56e-06 | 1.17e-01 | 0.1131 |
| 9575 | CLOCK | P10T-E | Human | Esophagus | ESCC | 3.17e-10 | 1.65e-01 | 0.116 |
| 9575 | CLOCK | P11T-E | Human | Esophagus | ESCC | 6.32e-03 | 1.71e-01 | 0.1426 |
| 9575 | CLOCK | P12T-E | Human | Esophagus | ESCC | 7.28e-13 | 2.50e-01 | 0.1122 |
| 9575 | CLOCK | P15T-E | Human | Esophagus | ESCC | 8.50e-10 | 1.54e-01 | 0.1149 |
| 9575 | CLOCK | P20T-E | Human | Esophagus | ESCC | 1.08e-08 | 1.72e-01 | 0.1124 |
| 9575 | CLOCK | P21T-E | Human | Esophagus | ESCC | 5.73e-10 | 2.97e-01 | 0.1617 |
| 9575 | CLOCK | P22T-E | Human | Esophagus | ESCC | 3.43e-18 | 2.44e-01 | 0.1236 |
| 9575 | CLOCK | P23T-E | Human | Esophagus | ESCC | 5.65e-14 | 3.16e-01 | 0.108 |
| 9575 | CLOCK | P24T-E | Human | Esophagus | ESCC | 1.37e-12 | 1.03e-01 | 0.1287 |
| 9575 | CLOCK | P26T-E | Human | Esophagus | ESCC | 4.82e-17 | 2.01e-01 | 0.1276 |
| 9575 | CLOCK | P27T-E | Human | Esophagus | ESCC | 9.54e-14 | 1.93e-01 | 0.1055 |
| 9575 | CLOCK | P28T-E | Human | Esophagus | ESCC | 5.67e-26 | 6.06e-01 | 0.1149 |
| Page: 1 2 3 4 5 |
| Tissue | Expression Dynamics | Abbreviation |
| Esophagus | 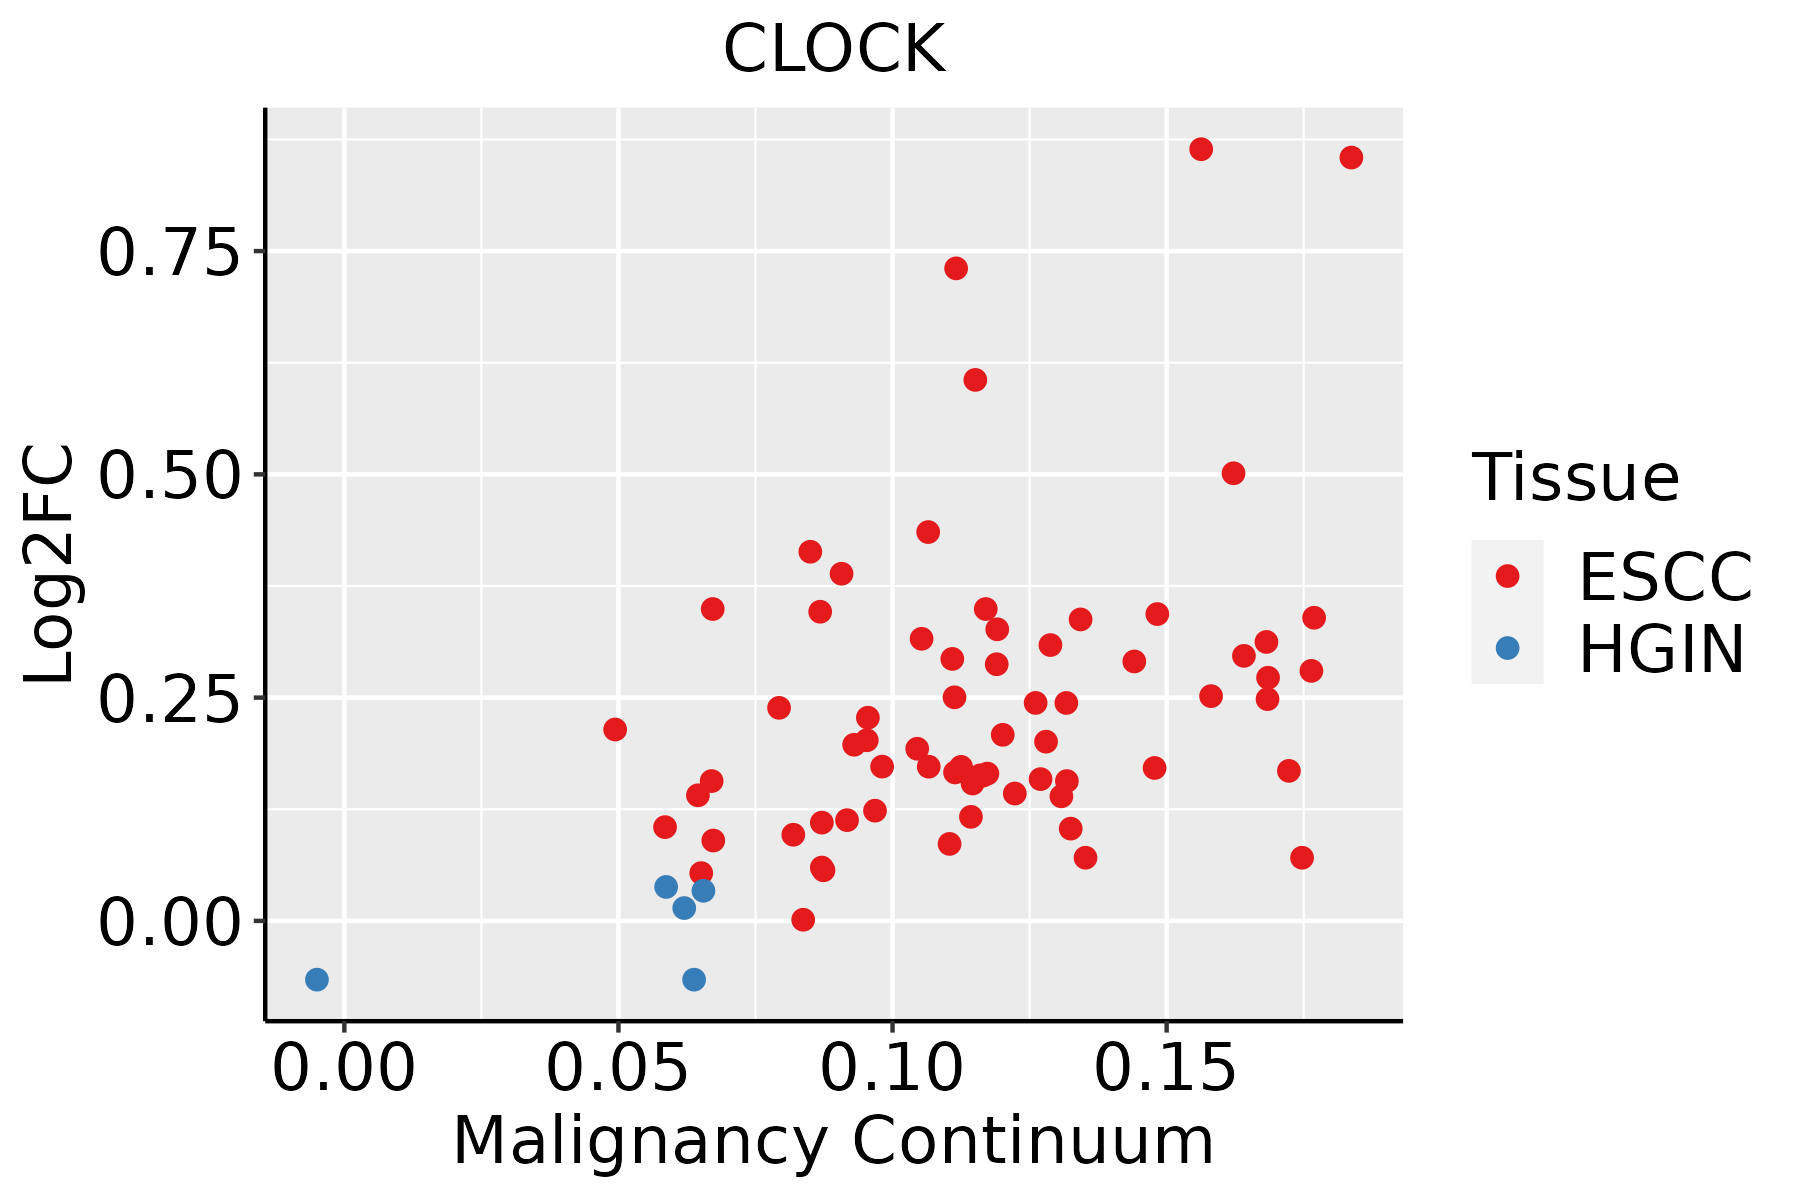 | ESCC: Esophageal squamous cell carcinoma |
| HGIN: High-grade intraepithelial neoplasias | ||
| LGIN: Low-grade intraepithelial neoplasias | ||
| Liver | 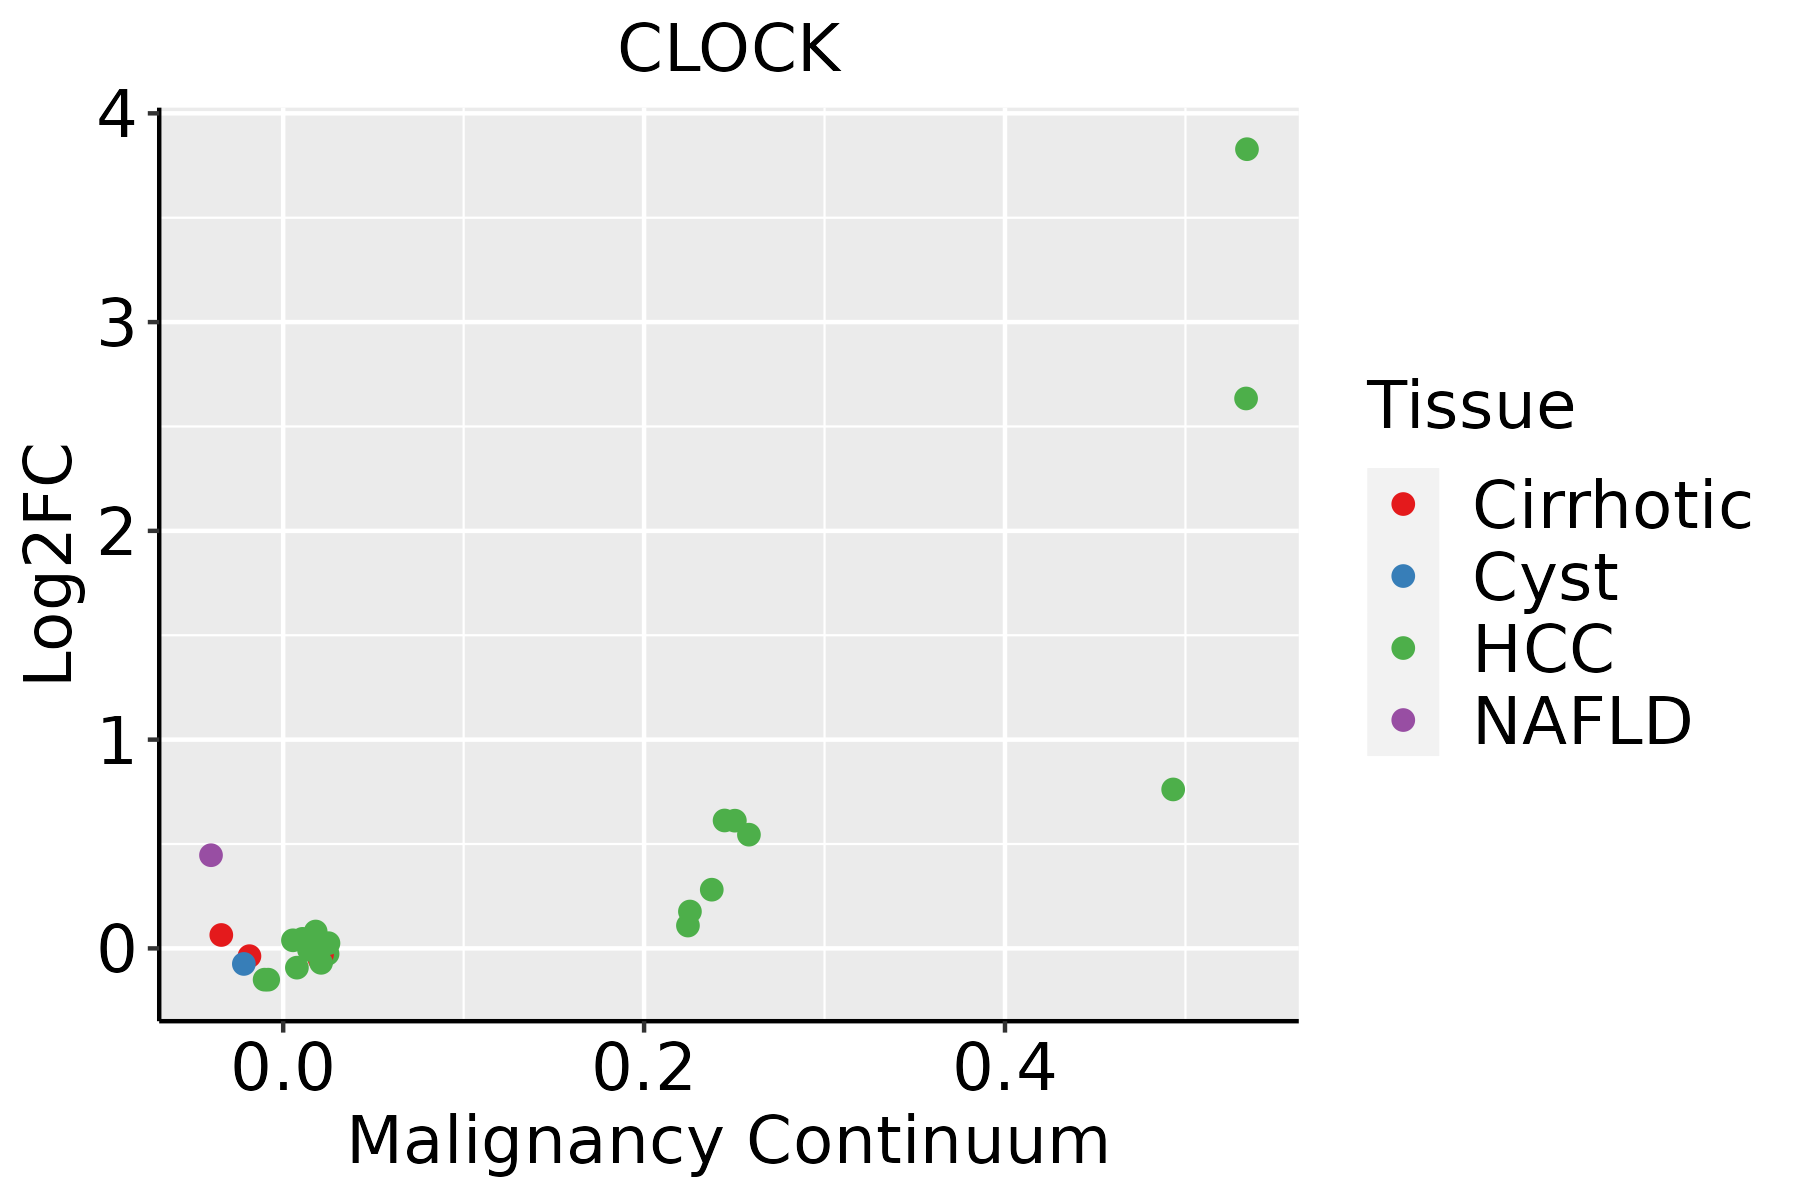 | HCC: Hepatocellular carcinoma |
| NAFLD: Non-alcoholic fatty liver disease | ||
| Lung |  | AAH: Atypical adenomatous hyperplasia |
| AIS: Adenocarcinoma in situ | ||
| IAC: Invasive lung adenocarcinoma | ||
| MIA: Minimally invasive adenocarcinoma | ||
| Skin | 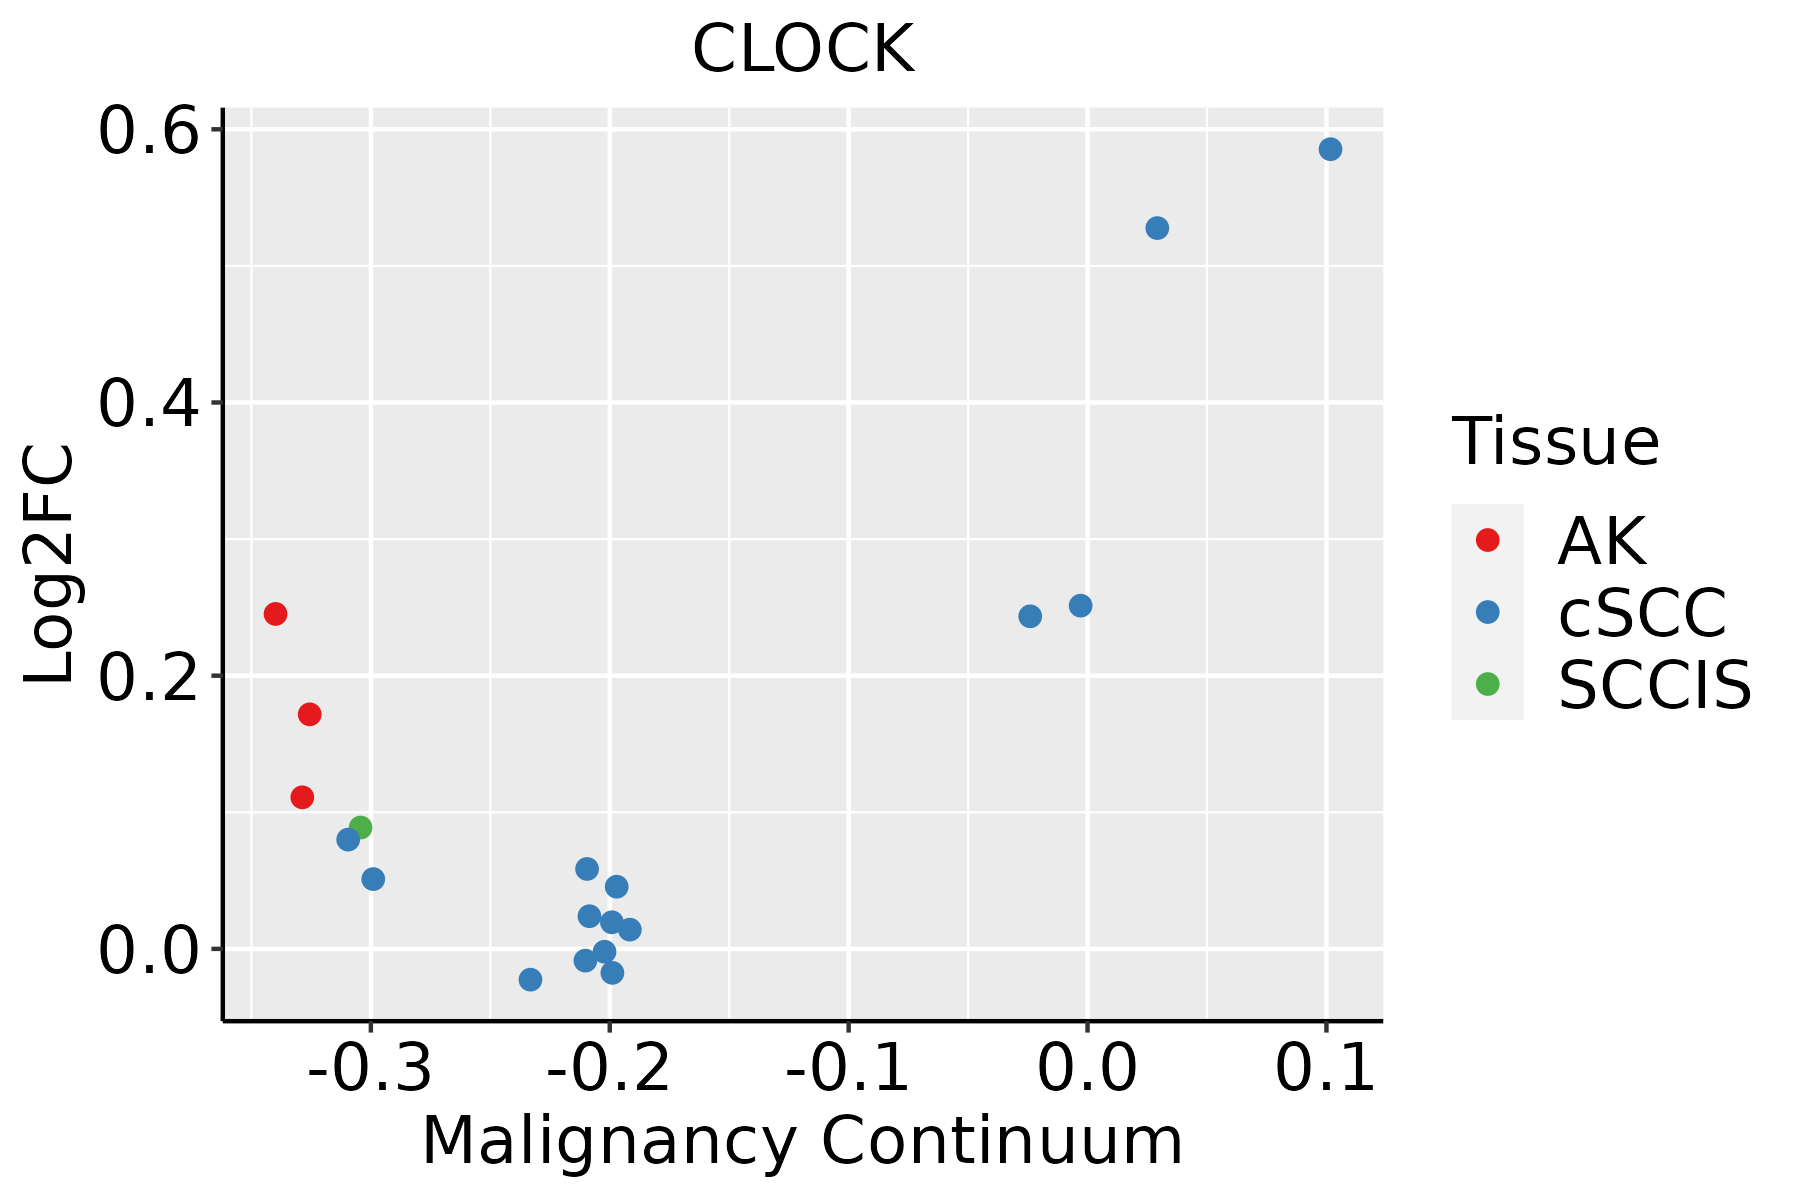 | AK: Actinic keratosis |
| cSCC: Cutaneous squamous cell carcinoma | ||
| SCCIS:squamous cell carcinoma in situ | ||
| Thyroid |  | ATC: Anaplastic thyroid cancer |
| HT: Hashimoto's thyroiditis | ||
| PTC: Papillary thyroid cancer |
| ∗log2FC in expression of this searched gene in stem-like cells from each diseased tissue sample relative to stem-like cells in normal samples in each tissue plotted against the malignancy continuum. Samples are colored based on if they are from different disease stage. |
Top |
Malignant transformation related pathway analysis |
| Find out the enriched GO biological processes and KEGG pathways involved in transition from healthy to precancer to cancer |
| Tissue | Disease Stage | Enriched GO biological Processes |
| Colorectum | AD |  |
| Colorectum | SER |  |
| Colorectum | MSS |  |
| Colorectum | MSI-H |  |
| Colorectum | FAP |  |
| ∗Top 15 enriched GO BP terms are showed in the bar plot of each disease state in each tissue. Each row represents a significant GO biological process which is colored according to the -log10(p.adjust). |
| Page: 1 2 3 4 5 6 7 8 9 |
| GO ID | Tissue | Disease Stage | Description | Gene Ratio | Bg Ratio | pvalue | p.adjust | Count |
| GO:007121412 | Lung | AIS | cellular response to abiotic stimulus | 51/1849 | 331/18723 | 9.10e-04 | 1.21e-02 | 51 |
| GO:010400412 | Lung | AIS | cellular response to environmental stimulus | 51/1849 | 331/18723 | 9.10e-04 | 1.21e-02 | 51 |
| GO:000975512 | Lung | AIS | hormone-mediated signaling pathway | 33/1849 | 190/18723 | 9.44e-04 | 1.25e-02 | 33 |
| GO:005109011 | Lung | AIS | regulation of DNA-binding transcription factor activity | 64/1849 | 440/18723 | 1.04e-03 | 1.36e-02 | 64 |
| GO:005109111 | Lung | AIS | positive regulation of DNA-binding transcription factor activity | 41/1849 | 260/18723 | 1.77e-03 | 2.01e-02 | 41 |
| GO:000007711 | Lung | AIS | DNA damage checkpoint | 22/1849 | 115/18723 | 1.82e-03 | 2.05e-02 | 22 |
| GO:001021212 | Lung | AIS | response to ionizing radiation | 26/1849 | 148/18723 | 2.64e-03 | 2.68e-02 | 26 |
| GO:00094162 | Lung | AIS | response to light stimulus | 47/1849 | 320/18723 | 3.72e-03 | 3.48e-02 | 47 |
| GO:00315701 | Lung | AIS | DNA integrity checkpoint | 22/1849 | 123/18723 | 4.32e-03 | 3.86e-02 | 22 |
| GO:000206423 | Lung | AAH | epithelial cell development | 17/613 | 220/18723 | 9.62e-04 | 2.94e-02 | 17 |
| GO:000931421 | Lung | AAH | response to radiation | 27/613 | 456/18723 | 2.33e-03 | 4.92e-02 | 27 |
| GO:007147922 | Lung | AAH | cellular response to ionizing radiation | 8/613 | 72/18723 | 2.39e-03 | 4.98e-02 | 8 |
| GO:001049827 | Skin | AK | proteasomal protein catabolic process | 97/1910 | 490/18723 | 9.65e-11 | 1.54e-08 | 97 |
| GO:004851119 | Skin | AK | rhythmic process | 67/1910 | 298/18723 | 3.47e-10 | 4.37e-08 | 67 |
| GO:004316127 | Skin | AK | proteasome-mediated ubiquitin-dependent protein catabolic process | 84/1910 | 412/18723 | 3.96e-10 | 4.88e-08 | 84 |
| GO:004854528 | Skin | AK | response to steroid hormone | 73/1910 | 339/18723 | 4.51e-10 | 5.24e-08 | 73 |
| GO:000762320 | Skin | AK | circadian rhythm | 51/1910 | 210/18723 | 2.80e-09 | 2.40e-07 | 51 |
| GO:000206425 | Skin | AK | epithelial cell development | 51/1910 | 220/18723 | 1.50e-08 | 9.13e-07 | 51 |
| GO:007121420 | Skin | AK | cellular response to abiotic stimulus | 67/1910 | 331/18723 | 3.15e-08 | 1.71e-06 | 67 |
| GO:010400420 | Skin | AK | cellular response to environmental stimulus | 67/1910 | 331/18723 | 3.15e-08 | 1.71e-06 | 67 |
| Page: 1 2 3 4 5 6 7 8 9 10 11 12 13 14 15 16 17 18 19 |
| Pathway ID | Tissue | Disease Stage | Description | Gene Ratio | Bg Ratio | pvalue | p.adjust | qvalue | Count |
| hsa047105 | Esophagus | ESCC | Circadian rhythm | 24/4205 | 34/8465 | 1.09e-02 | 2.51e-02 | 1.29e-02 | 24 |
| hsa0471012 | Esophagus | ESCC | Circadian rhythm | 24/4205 | 34/8465 | 1.09e-02 | 2.51e-02 | 1.29e-02 | 24 |
| hsa04710 | Lung | IAC | Circadian rhythm | 10/1053 | 34/8465 | 6.70e-03 | 2.76e-02 | 1.83e-02 | 10 |
| hsa047101 | Lung | IAC | Circadian rhythm | 10/1053 | 34/8465 | 6.70e-03 | 2.76e-02 | 1.83e-02 | 10 |
| hsa047102 | Lung | AIS | Circadian rhythm | 11/961 | 34/8465 | 9.22e-04 | 7.11e-03 | 4.55e-03 | 11 |
| hsa047103 | Lung | AIS | Circadian rhythm | 11/961 | 34/8465 | 9.22e-04 | 7.11e-03 | 4.55e-03 | 11 |
| Page: 1 |
Top |
Cell-cell communication analysis |
| Identification of potential cell-cell interactions between two cell types and their ligand-receptor pairs for different disease states |
| Ligand | Receptor | LRpair | Pathway | Tissue | Disease Stage |
| Page: 1 |
Top |
Single-cell gene regulatory network inference analysis |
| Find out the significant the regulons (TFs) and the target genes of each regulon across cell types for different disease states |
| TF | Cell Type | Tissue | Disease Stage | Target Gene | RSS | Regulon Activity |
| CLOCK | CD8TEX | Breast | DCIS | DHX30,BCAS3,MTMR4, etc. | 3.82e-02 |  |
| CLOCK | CD4TN | Breast | Healthy | DHX30,BCAS3,MTMR4, etc. | 2.09e-02 |  |
| CLOCK | CD8TEX | Breast | IDC | DHX30,BCAS3,MTMR4, etc. | 3.95e-02 |  |
| CLOCK | KER | Esophagus | ADJ | KRT13,KRT5,TMEM165, etc. | 2.21e-01 |  |
| CLOCK | CD8TEXP | Esophagus | ADJ | SMIM10L2B,CDC42SE2,CLEC7A, etc. | 4.89e-02 | |
| CLOCK | CD8TEXP | Esophagus | ESCC | SMIM10L2B,CDC42SE2,CLEC7A, etc. | 7.66e-02 |  |
| CLOCK | INMON | Esophagus | ESCC | SMIM10L2B,CDC42SE2,CLEC7A, etc. | 8.35e-02 | |
| CLOCK | AT2L | Lung | MIAC | TMEM165,SYT8,SPTSSA, etc. | 6.38e-01 |  |
| CLOCK | CD8TEXINT | Lung | AAH | TICAM2,HSPA1B,ZHX3, etc. | 3.56e-01 |  |
| CLOCK | ECM | Oral cavity | EOLP | GLIS2,LUZP2,AL078604.4, etc. | 0.00e+00 |  |
| ∗The dot plots of a searched regulon are shown for all cell subpopulations in each disease state of each tissue based on the regulon specific score inferred using pySCENIC and by calculating the average expression. |
| Page: 1 2 3 |
Top |
Somatic mutation of malignant transformation related genes |
| Annotation of somatic variants for genes involved in malignant transformation |
| Hugo Symbol | Variant Class | Variant Classification | dbSNP RS | HGVSc | HGVSp | HGVSp Short | SWISSPROT | BIOTYPE | SIFT | PolyPhen | Tumor Sample Barcode | Tissue | Histology | Sex | Age | Stage | Therapy Types | Drugs | Outcome |
| CLOCK | SNV | Missense_Mutation | c.496N>A | p.Val166Ile | p.V166I | O15516 | protein_coding | tolerated(0.13) | benign(0.042) | TCGA-AN-A0AK-01 | Breast | breast invasive carcinoma | Female | >=65 | I/II | Unknown | Unknown | SD | |
| CLOCK | SNV | Missense_Mutation | c.49N>T | p.Asp17Tyr | p.D17Y | O15516 | protein_coding | deleterious(0) | possibly_damaging(0.526) | TCGA-AR-A256-01 | Breast | breast invasive carcinoma | Female | <65 | I/II | Chemotherapy | doxorubicin | PD | |
| CLOCK | SNV | Missense_Mutation | c.35N>T | p.Ser12Leu | p.S12L | O15516 | protein_coding | deleterious(0.03) | benign(0.001) | TCGA-EW-A1IZ-01 | Breast | breast invasive carcinoma | Female | <65 | III/IV | Chemotherapy | taxotere | SD | |
| CLOCK | insertion | Nonsense_Mutation | novel | c.1840_1841insTAATTT | p.Gly614delinsValIleTer | p.G614delinsVI* | O15516 | protein_coding | TCGA-B6-A0IB-01 | Breast | breast invasive carcinoma | Female | <65 | III/IV | Unknown | Unknown | PD | ||
| CLOCK | insertion | Frame_Shift_Ins | novel | c.1839_1840insCACGTTCCCACCAGCAGTGT | p.Gly614HisfsTer16 | p.G614Hfs*16 | O15516 | protein_coding | TCGA-B6-A0IB-01 | Breast | breast invasive carcinoma | Female | <65 | III/IV | Unknown | Unknown | PD | ||
| CLOCK | SNV | Missense_Mutation | novel | c.677N>G | p.Ser226Cys | p.S226C | O15516 | protein_coding | deleterious(0) | possibly_damaging(0.447) | TCGA-C5-A907-01 | Cervix | cervical & endocervical cancer | Female | <65 | I/II | Chemotherapy | cisplatin | SD |
| CLOCK | SNV | Missense_Mutation | novel | c.142N>A | p.Asp48Asn | p.D48N | O15516 | protein_coding | deleterious(0) | probably_damaging(0.999) | TCGA-ZJ-AAX8-01 | Cervix | cervical & endocervical cancer | Female | <65 | III/IV | Unknown | Unknown | SD |
| CLOCK | SNV | Missense_Mutation | novel | c.1174N>A | p.Glu392Lys | p.E392K | O15516 | protein_coding | deleterious(0.04) | benign(0.043) | TCGA-ZJ-AAXU-01 | Cervix | cervical & endocervical cancer | Female | <65 | I/II | Unknown | Unknown | SD |
| CLOCK | SNV | Missense_Mutation | c.2355N>G | p.Phe785Leu | p.F785L | O15516 | protein_coding | tolerated(0.08) | benign(0.007) | TCGA-AA-3977-01 | Colorectum | colon adenocarcinoma | Male | >=65 | I/II | Unknown | Unknown | SD | |
| CLOCK | SNV | Missense_Mutation | rs779397098 | c.1460N>T | p.Ser487Phe | p.S487F | O15516 | protein_coding | deleterious(0.01) | possibly_damaging(0.887) | TCGA-AA-A00N-01 | Colorectum | colon adenocarcinoma | Male | >=65 | I/II | Unknown | Unknown | PD |
| Page: 1 2 3 4 5 6 7 8 |
Top |
Related drugs of malignant transformation related genes |
| Identification of chemicals and drugs interact with genes involved in malignant transfromation |
| (DGIdb 4.0) |
| Entrez ID | Symbol | Category | Interaction Types | Drug Claim Name | Drug Name | PMIDs |
| 9575 | CLOCK | ENZYME, TRANSCRIPTION FACTOR, NUCLEAR HORMONE RECEPTOR, TRANSCRIPTION FACTOR COMPLEX | salbutamol | ALBUTEROL | 23508266 | |
| 9575 | CLOCK | ENZYME, TRANSCRIPTION FACTOR, NUCLEAR HORMONE RECEPTOR, TRANSCRIPTION FACTOR COMPLEX | lithium | LITHIUM | 21047205 |
| Page: 1 |

Copyright 2023-Present -The University of Texas Health Science Center at Houston |