
|
|||||
|
 | |
| |
| |
| |
| |
| |
|
Gene: CCT8 |
Gene summary for CCT8 |
| Gene information | Species | Human | Gene symbol | CCT8 | Gene ID | 10694 |
| Gene name | chaperonin containing TCP1 subunit 8 | |
| Gene Alias | C21orf112 | |
| Cytomap | 21q21.3 | |
| Gene Type | protein-coding | GO ID | GO:0000003 | UniProtAcc | P50990 |
Top |
Malignant transformation analysis |
| Identification of the aberrant gene expression in precancerous and cancerous lesions by comparing the gene expression of stem-like cells in diseased tissues with normal stem cells |
| Entrez ID | Symbol | Replicates | Species | Organ | Tissue | Adj P-value | Log2FC | Malignancy |
| 10694 | CCT8 | GSM4909280 | Human | Breast | Precancer | 9.43e-03 | -3.17e-01 | 0.0305 |
| 10694 | CCT8 | GSM4909282 | Human | Breast | IDC | 3.95e-02 | 2.04e-01 | -0.0288 |
| 10694 | CCT8 | GSM4909285 | Human | Breast | IDC | 8.32e-38 | 6.89e-01 | 0.21 |
| 10694 | CCT8 | GSM4909286 | Human | Breast | IDC | 5.34e-04 | -2.85e-01 | 0.1081 |
| 10694 | CCT8 | GSM4909291 | Human | Breast | IDC | 9.15e-06 | -3.95e-01 | 0.1753 |
| 10694 | CCT8 | GSM4909294 | Human | Breast | IDC | 1.11e-08 | 1.48e-01 | 0.2022 |
| 10694 | CCT8 | GSM4909296 | Human | Breast | IDC | 1.14e-24 | -5.06e-01 | 0.1524 |
| 10694 | CCT8 | GSM4909297 | Human | Breast | IDC | 3.68e-18 | -2.13e-01 | 0.1517 |
| 10694 | CCT8 | GSM4909301 | Human | Breast | IDC | 1.25e-06 | -3.32e-01 | 0.1577 |
| 10694 | CCT8 | GSM4909302 | Human | Breast | IDC | 9.31e-07 | -3.24e-01 | 0.1545 |
| 10694 | CCT8 | GSM4909304 | Human | Breast | IDC | 4.46e-04 | -3.50e-01 | 0.1636 |
| 10694 | CCT8 | GSM4909307 | Human | Breast | IDC | 6.41e-07 | -3.71e-01 | 0.1569 |
| 10694 | CCT8 | GSM4909309 | Human | Breast | IDC | 8.53e-08 | -3.46e-01 | 0.0483 |
| 10694 | CCT8 | GSM4909311 | Human | Breast | IDC | 1.25e-31 | -3.91e-01 | 0.1534 |
| 10694 | CCT8 | GSM4909312 | Human | Breast | IDC | 1.50e-12 | -8.45e-02 | 0.1552 |
| 10694 | CCT8 | GSM4909313 | Human | Breast | IDC | 6.45e-08 | -3.70e-01 | 0.0391 |
| 10694 | CCT8 | GSM4909318 | Human | Breast | IDC | 3.41e-03 | -3.41e-01 | 0.2031 |
| 10694 | CCT8 | GSM4909319 | Human | Breast | IDC | 3.94e-43 | -4.94e-01 | 0.1563 |
| 10694 | CCT8 | GSM4909320 | Human | Breast | IDC | 3.83e-11 | -5.68e-01 | 0.1575 |
| 10694 | CCT8 | GSM4909321 | Human | Breast | IDC | 9.43e-18 | -3.57e-01 | 0.1559 |
| Page: 1 2 3 4 5 6 7 8 9 10 11 |
| Tissue | Expression Dynamics | Abbreviation |
| Breast | 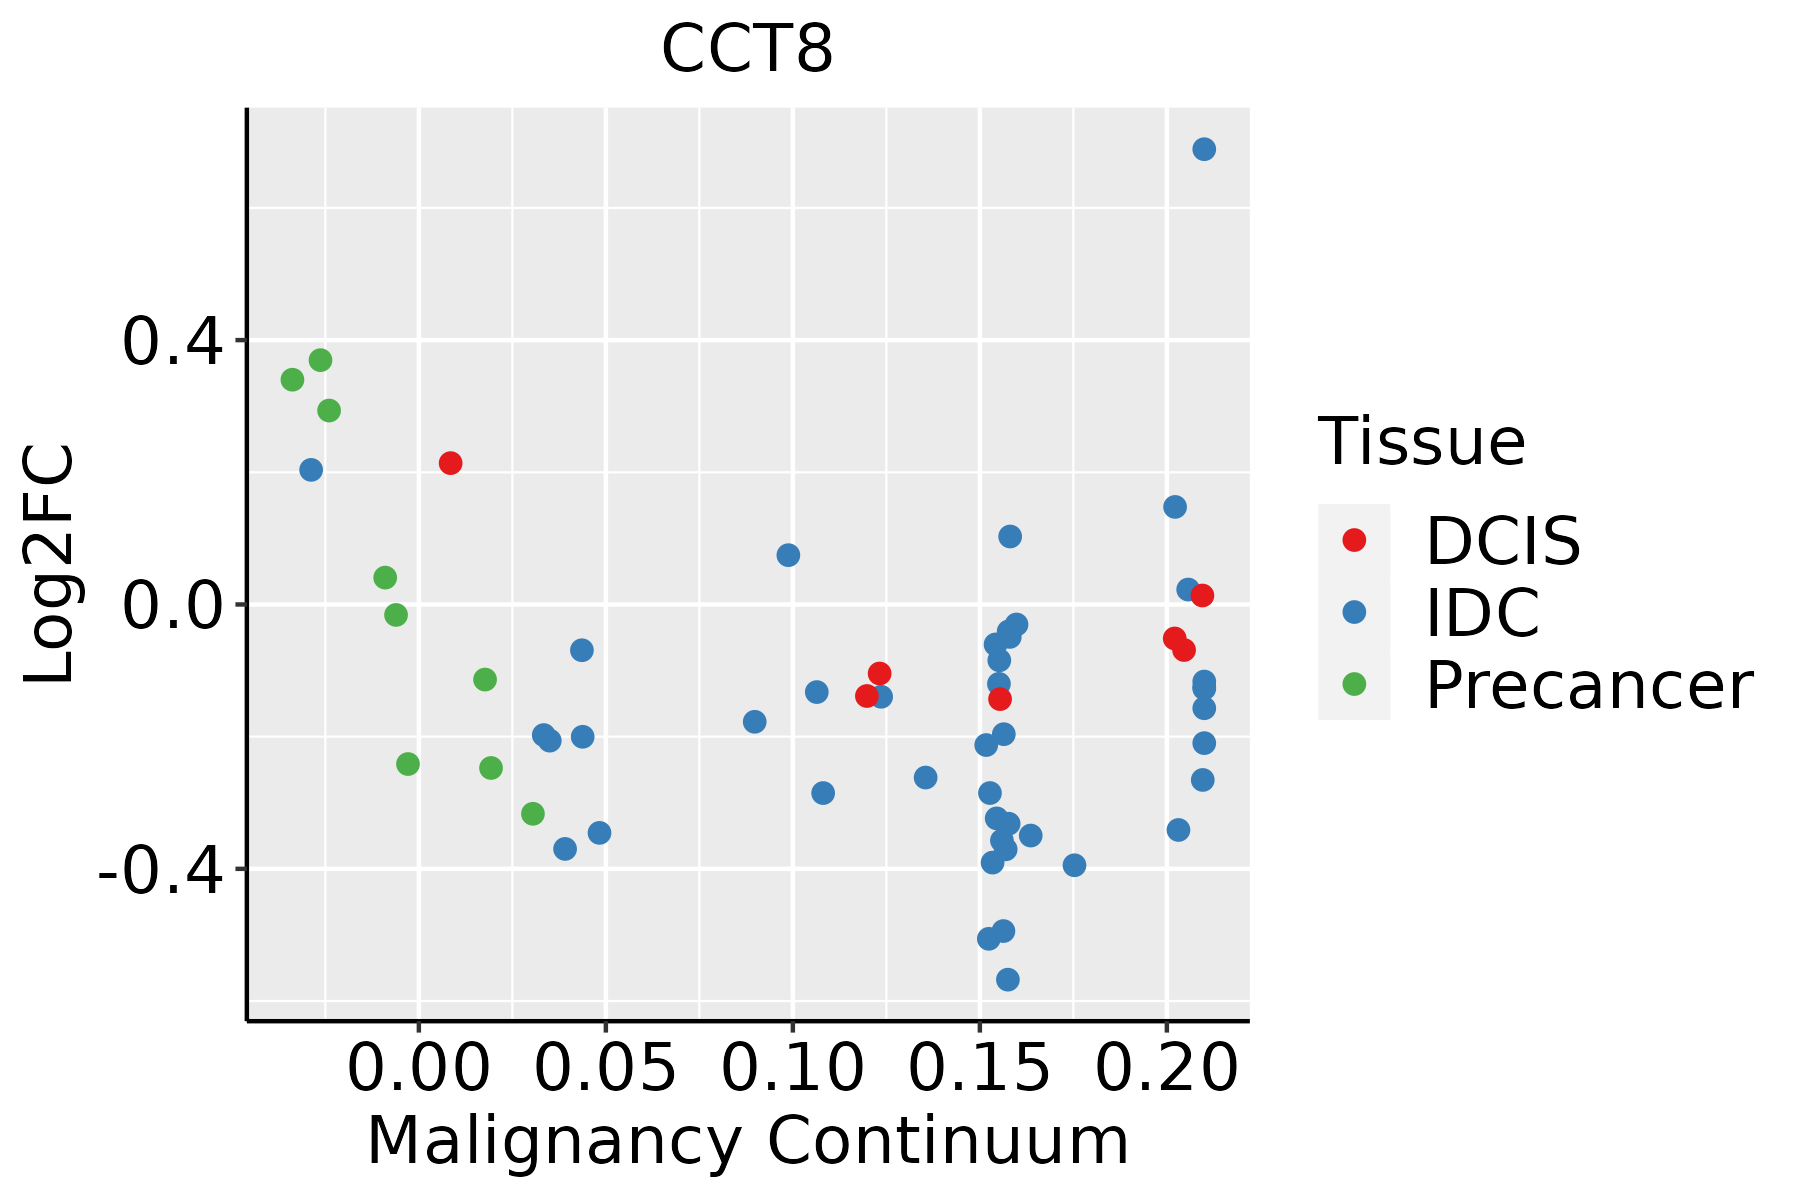 | IDC: Invasive ductal carcinoma |
| DCIS: Ductal carcinoma in situ | ||
| Precancer(BRCA1-mut): Precancerous lesion from BRCA1 mutation carriers | ||
| Colorectum (GSE201348) |  | FAP: Familial adenomatous polyposis |
| CRC: Colorectal cancer | ||
| Colorectum (HTA11) |  | AD: Adenomas |
| SER: Sessile serrated lesions | ||
| MSI-H: Microsatellite-high colorectal cancer | ||
| MSS: Microsatellite stable colorectal cancer | ||
| Endometrium |  | AEH: Atypical endometrial hyperplasia |
| EEC: Endometrioid Cancer | ||
| Esophagus |  | ESCC: Esophageal squamous cell carcinoma |
| HGIN: High-grade intraepithelial neoplasias | ||
| LGIN: Low-grade intraepithelial neoplasias | ||
| Liver | 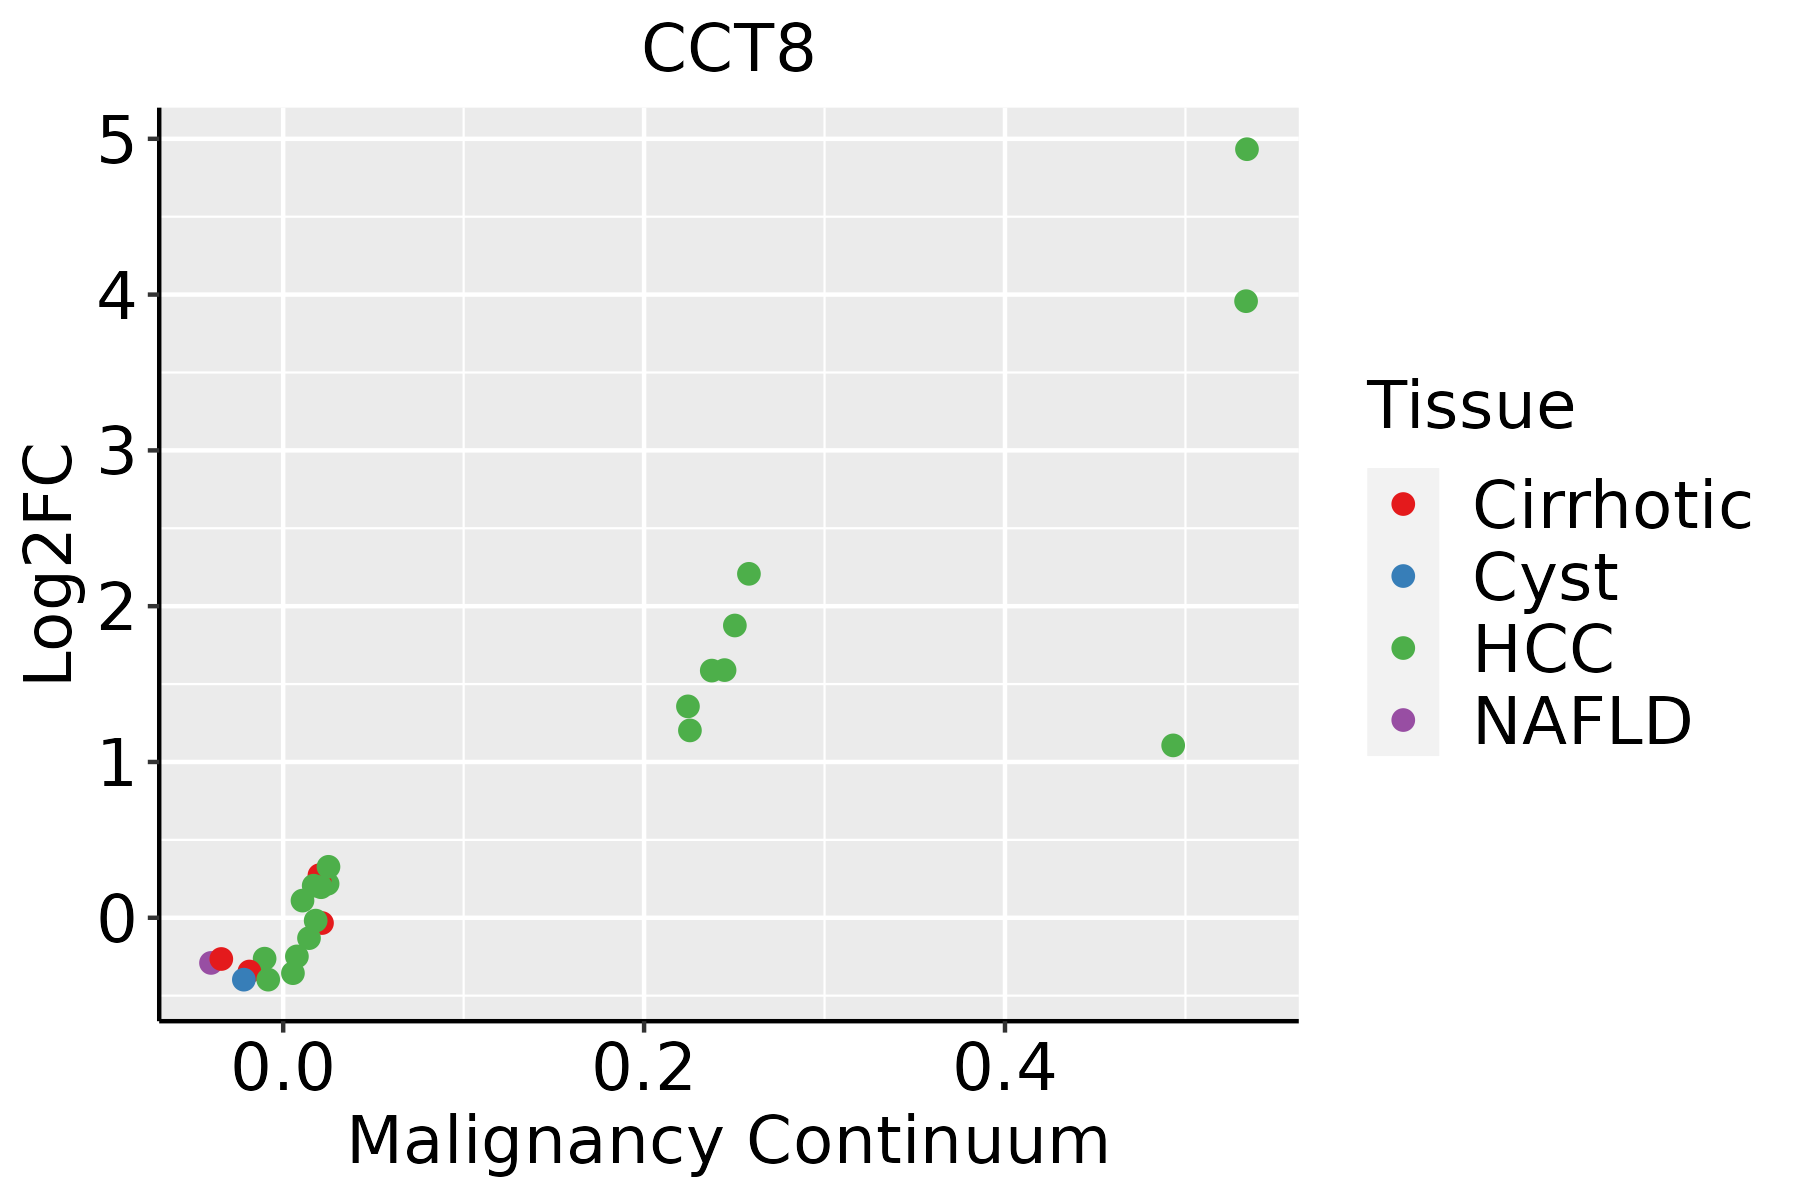 | HCC: Hepatocellular carcinoma |
| NAFLD: Non-alcoholic fatty liver disease | ||
| Oral Cavity | 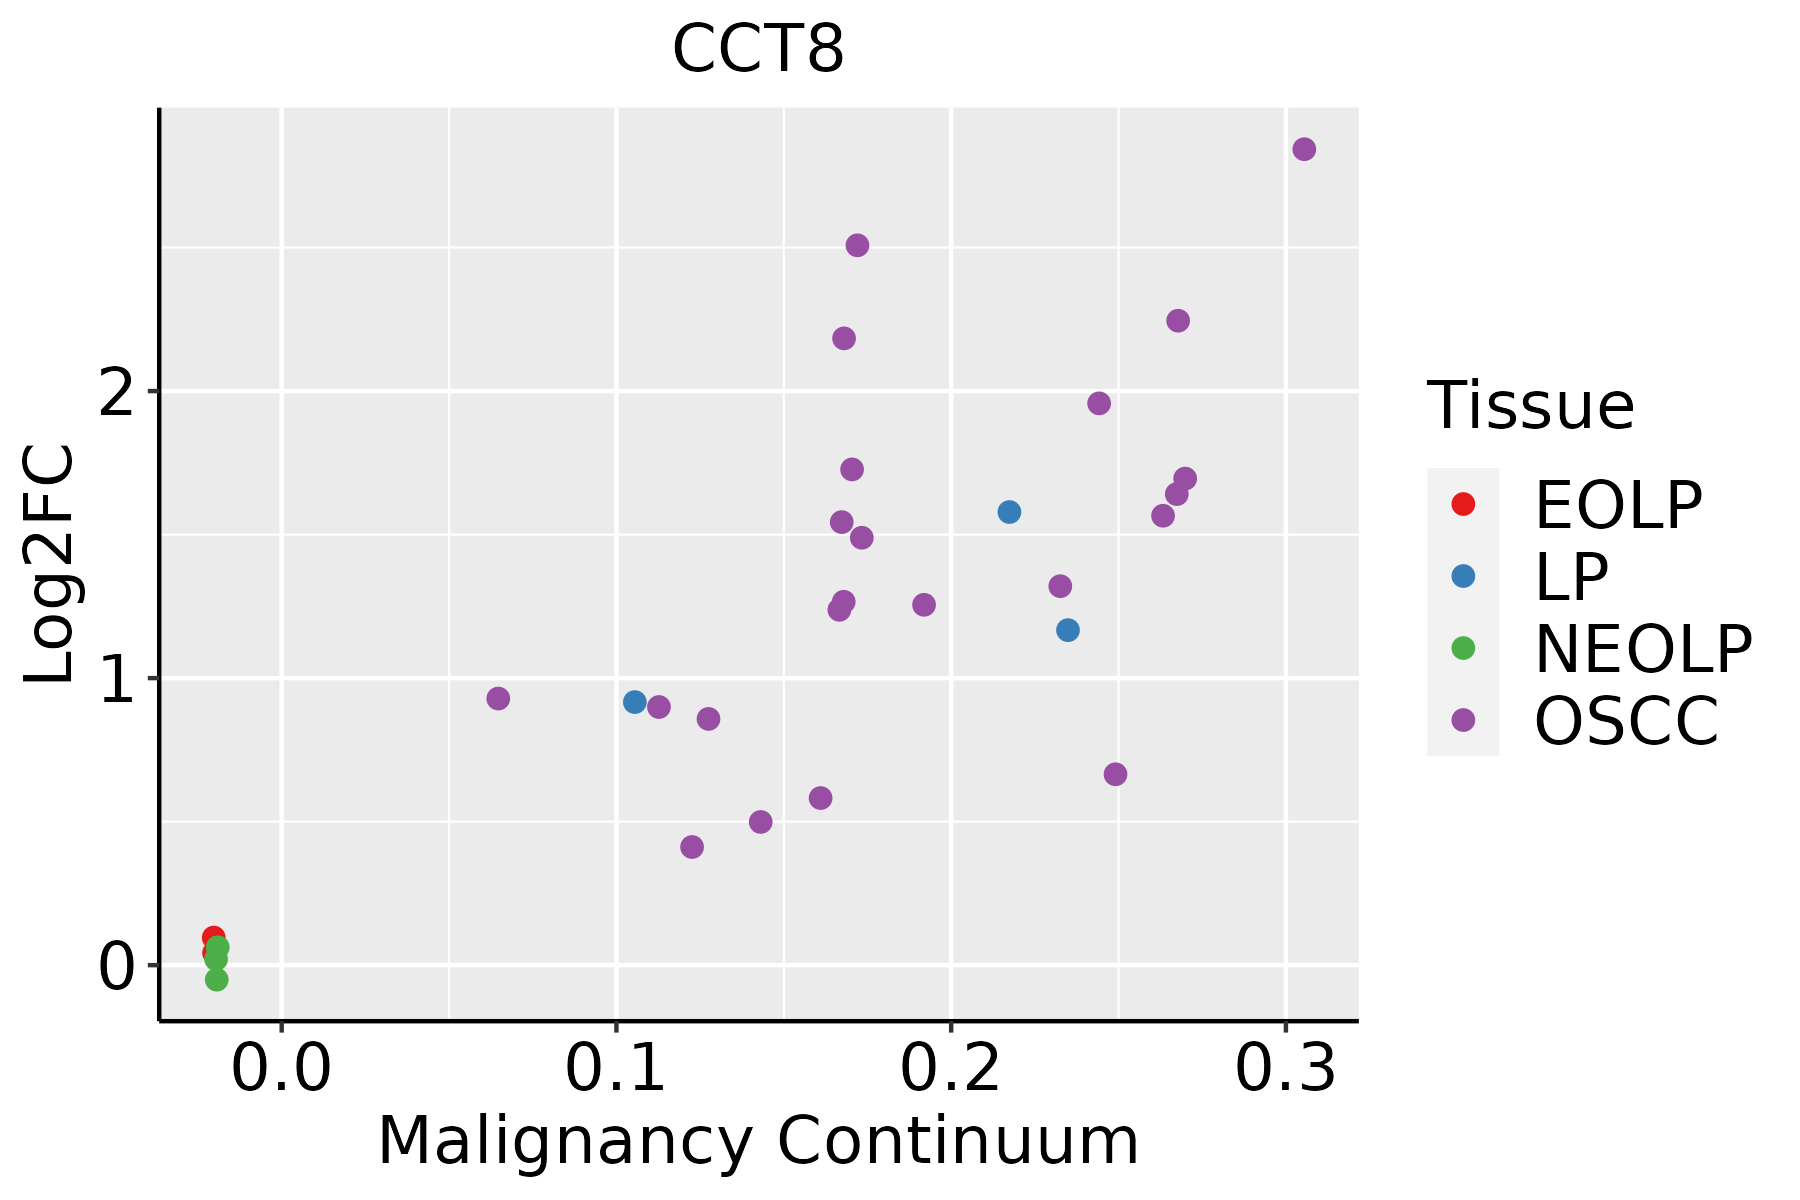 | EOLP: Erosive Oral lichen planus |
| LP: leukoplakia | ||
| NEOLP: Non-erosive oral lichen planus | ||
| OSCC: Oral squamous cell carcinoma | ||
| Prostate | 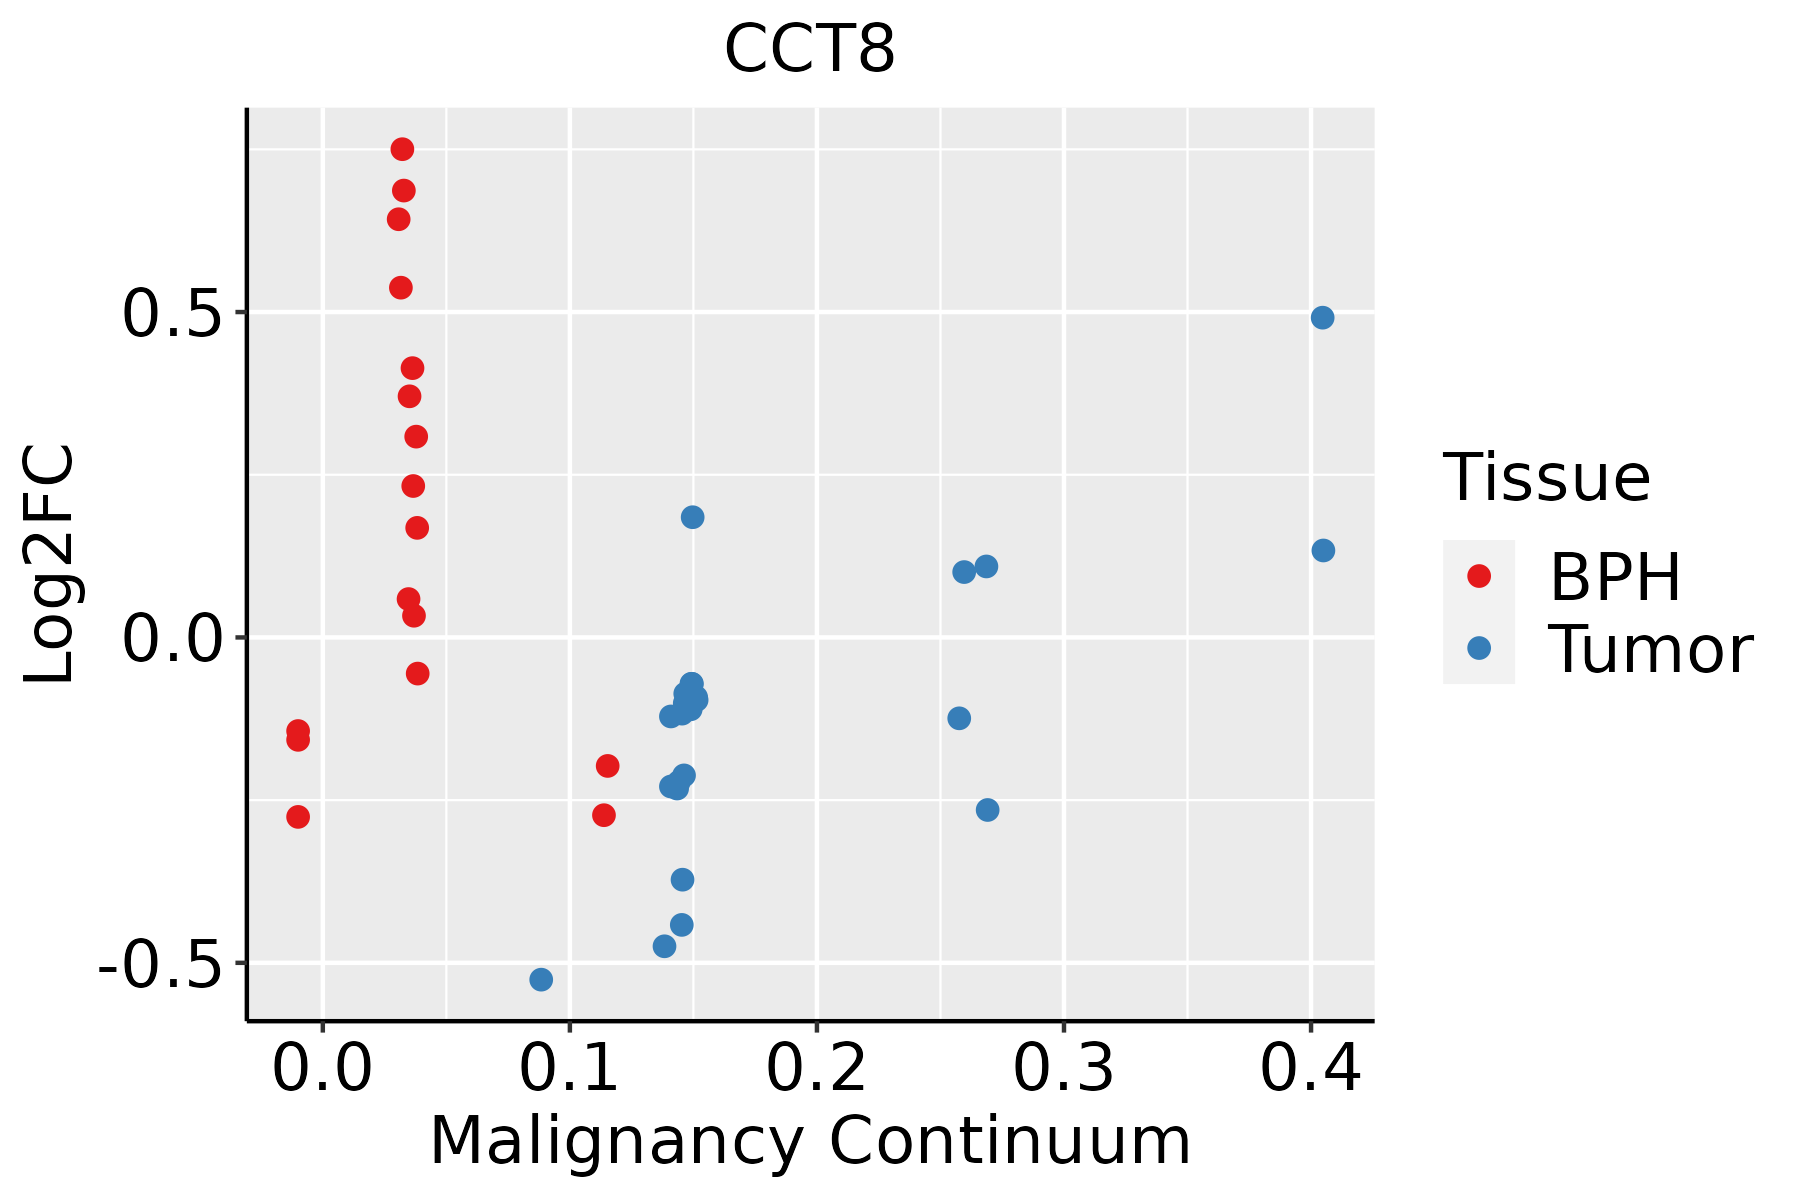 | BPH: Benign Prostatic Hyperplasia |
| Skin | 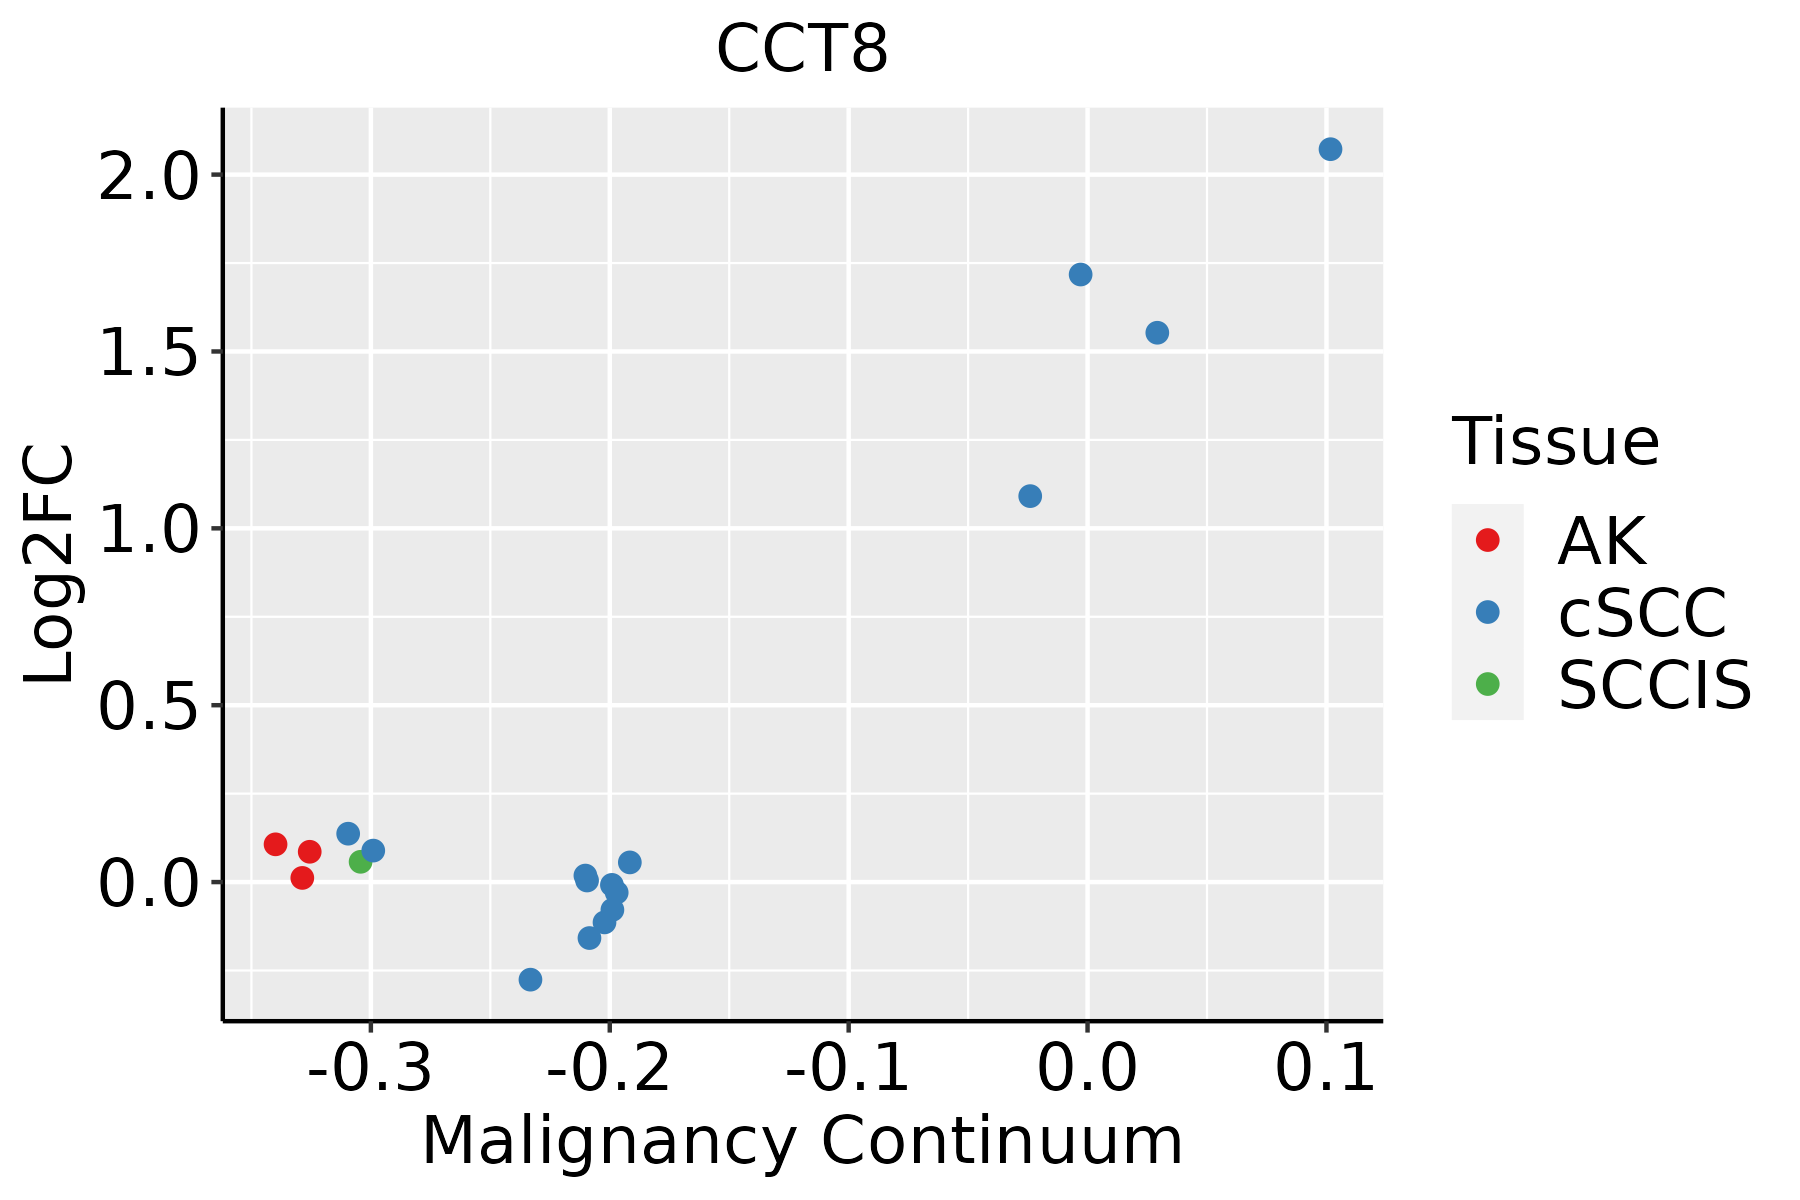 | AK: Actinic keratosis |
| cSCC: Cutaneous squamous cell carcinoma | ||
| SCCIS:squamous cell carcinoma in situ | ||
| Thyroid |  | ATC: Anaplastic thyroid cancer |
| HT: Hashimoto's thyroiditis | ||
| PTC: Papillary thyroid cancer |
| ∗log2FC in expression of this searched gene in stem-like cells from each diseased tissue sample relative to stem-like cells in normal samples in each tissue plotted against the malignancy continuum. Samples are colored based on if they are from different disease stage. |
Top |
Malignant transformation related pathway analysis |
| Find out the enriched GO biological processes and KEGG pathways involved in transition from healthy to precancer to cancer |
| Tissue | Disease Stage | Enriched GO biological Processes |
| Colorectum | AD |  |
| Colorectum | SER |  |
| Colorectum | MSS |  |
| Colorectum | MSI-H |  |
| Colorectum | FAP |  |
| ∗Top 15 enriched GO BP terms are showed in the bar plot of each disease state in each tissue. Each row represents a significant GO biological process which is colored according to the -log10(p.adjust). |
| Page: 1 2 3 4 5 6 7 8 9 |
| GO ID | Tissue | Disease Stage | Description | Gene Ratio | Bg Ratio | pvalue | p.adjust | Count |
| GO:00718971 | Colorectum | SER | DNA biosynthetic process | 43/2897 | 180/18723 | 1.99e-03 | 1.98e-02 | 43 |
| GO:19043581 | Colorectum | SER | positive regulation of telomere maintenance via telomere lengthening | 13/2897 | 37/18723 | 2.60e-03 | 2.40e-02 | 13 |
| GO:1904814 | Colorectum | SER | regulation of protein localization to chromosome, telomeric region | 7/2897 | 14/18723 | 2.64e-03 | 2.41e-02 | 7 |
| GO:1990173 | Colorectum | SER | protein localization to nucleoplasm | 7/2897 | 14/18723 | 2.64e-03 | 2.41e-02 | 7 |
| GO:0070199 | Colorectum | SER | establishment of protein localization to chromosome | 10/2897 | 25/18723 | 2.70e-03 | 2.44e-02 | 10 |
| GO:0070203 | Colorectum | SER | regulation of establishment of protein localization to telomere | 6/2897 | 11/18723 | 3.12e-03 | 2.70e-02 | 6 |
| GO:1904869 | Colorectum | SER | regulation of protein localization to Cajal body | 6/2897 | 11/18723 | 3.12e-03 | 2.70e-02 | 6 |
| GO:1904871 | Colorectum | SER | positive regulation of protein localization to Cajal body | 6/2897 | 11/18723 | 3.12e-03 | 2.70e-02 | 6 |
| GO:00322121 | Colorectum | SER | positive regulation of telomere maintenance via telomerase | 12/2897 | 34/18723 | 3.60e-03 | 3.03e-02 | 12 |
| GO:19043561 | Colorectum | SER | regulation of telomere maintenance via telomere lengthening | 18/2897 | 61/18723 | 4.02e-03 | 3.30e-02 | 18 |
| GO:1904874 | Colorectum | SER | positive regulation of telomerase RNA localization to Cajal body | 7/2897 | 15/18723 | 4.30e-03 | 3.45e-02 | 7 |
| GO:00108331 | Colorectum | SER | telomere maintenance via telomere lengthening | 22/2897 | 81/18723 | 4.85e-03 | 3.79e-02 | 22 |
| GO:00007231 | Colorectum | SER | telomere maintenance | 32/2897 | 131/18723 | 4.90e-03 | 3.82e-02 | 32 |
| GO:1903405 | Colorectum | SER | protein localization to nuclear body | 6/2897 | 12/18723 | 5.42e-03 | 4.03e-02 | 6 |
| GO:1904816 | Colorectum | SER | positive regulation of protein localization to chromosome, telomeric region | 6/2897 | 12/18723 | 5.42e-03 | 4.03e-02 | 6 |
| GO:1904867 | Colorectum | SER | protein localization to Cajal body | 6/2897 | 12/18723 | 5.42e-03 | 4.03e-02 | 6 |
| GO:19038292 | Colorectum | MSS | positive regulation of cellular protein localization | 103/3467 | 276/18723 | 1.12e-13 | 2.67e-11 | 103 |
| GO:00725942 | Colorectum | MSS | establishment of protein localization to organelle | 139/3467 | 422/18723 | 5.75e-13 | 1.12e-10 | 139 |
| GO:19049512 | Colorectum | MSS | positive regulation of establishment of protein localization | 110/3467 | 319/18723 | 6.30e-12 | 9.83e-10 | 110 |
| GO:00316472 | Colorectum | MSS | regulation of protein stability | 103/3467 | 298/18723 | 2.52e-11 | 3.49e-09 | 103 |
| Page: 1 2 3 4 5 6 7 8 9 10 11 12 13 14 15 16 17 18 19 20 21 22 23 24 25 26 27 28 29 30 31 32 33 34 35 36 37 38 39 40 41 42 43 44 45 46 |
| Pathway ID | Tissue | Disease Stage | Description | Gene Ratio | Bg Ratio | pvalue | p.adjust | qvalue | Count |
| Page: 1 |
Top |
Cell-cell communication analysis |
| Identification of potential cell-cell interactions between two cell types and their ligand-receptor pairs for different disease states |
| Ligand | Receptor | LRpair | Pathway | Tissue | Disease Stage |
| Page: 1 |
Top |
Single-cell gene regulatory network inference analysis |
| Find out the significant the regulons (TFs) and the target genes of each regulon across cell types for different disease states |
| TF | Cell Type | Tissue | Disease Stage | Target Gene | RSS | Regulon Activity |
| ∗The dot plots of a searched regulon are shown for all cell subpopulations in each disease state of each tissue based on the regulon specific score inferred using pySCENIC and by calculating the average expression. |
| Page: 1 |
Top |
Somatic mutation of malignant transformation related genes |
| Annotation of somatic variants for genes involved in malignant transformation |
| Hugo Symbol | Variant Class | Variant Classification | dbSNP RS | HGVSc | HGVSp | HGVSp Short | SWISSPROT | BIOTYPE | SIFT | PolyPhen | Tumor Sample Barcode | Tissue | Histology | Sex | Age | Stage | Therapy Types | Drugs | Outcome |
| CCT8 | SNV | Missense_Mutation | c.475N>A | p.Glu159Lys | p.E159K | P50990 | protein_coding | tolerated(0.08) | benign(0.341) | TCGA-A1-A0SH-01 | Breast | breast invasive carcinoma | Female | <65 | I/II | Chemotherapy | tc | SD | |
| CCT8 | SNV | Missense_Mutation | c.1204N>G | p.Leu402Val | p.L402V | P50990 | protein_coding | tolerated(0.08) | possibly_damaging(0.493) | TCGA-A2-A0YK-01 | Breast | breast invasive carcinoma | Female | <65 | I/II | Chemotherapy | cytoxan | SD | |
| CCT8 | SNV | Missense_Mutation | rs776326374 | c.269C>T | p.Ser90Phe | p.S90F | P50990 | protein_coding | deleterious(0) | possibly_damaging(0.674) | TCGA-AO-A0J2-01 | Breast | breast invasive carcinoma | Female | <65 | I/II | Chemotherapy | cyclophosphamide | SD |
| CCT8 | SNV | Missense_Mutation | novel | c.1633N>C | p.Asp545His | p.D545H | P50990 | protein_coding | deleterious(0) | probably_damaging(0.994) | TCGA-BH-A2L8-01 | Breast | breast invasive carcinoma | Female | <65 | I/II | Chemotherapy | cytoxan | CR |
| CCT8 | SNV | Missense_Mutation | c.38N>T | p.Gln13Leu | p.Q13L | P50990 | protein_coding | tolerated(0.2) | benign(0) | TCGA-C8-A1HF-01 | Breast | breast invasive carcinoma | Female | <65 | I/II | Unknown | Unknown | SD | |
| CCT8 | SNV | Missense_Mutation | novel | c.784G>A | p.Ala262Thr | p.A262T | P50990 | protein_coding | deleterious(0) | probably_damaging(0.999) | TCGA-C5-A1MQ-01 | Cervix | cervical & endocervical cancer | Female | <65 | I/II | Chemotherapy | cisplatin | SD |
| CCT8 | SNV | Missense_Mutation | c.553N>G | p.Gln185Glu | p.Q185E | P50990 | protein_coding | tolerated(1) | benign(0) | TCGA-EK-A2PG-01 | Cervix | cervical & endocervical cancer | Female | >=65 | I/II | Unknown | Unknown | SD | |
| CCT8 | SNV | Missense_Mutation | c.1027N>C | p.Glu343Gln | p.E343Q | P50990 | protein_coding | deleterious(0) | probably_damaging(0.961) | TCGA-IR-A3LA-01 | Cervix | cervical & endocervical cancer | Female | <65 | I/II | Chemotherapy | cisplatin | CR | |
| CCT8 | SNV | Missense_Mutation | c.208N>A | p.Ala70Thr | p.A70T | P50990 | protein_coding | deleterious(0) | probably_damaging(0.961) | TCGA-AA-A00N-01 | Colorectum | colon adenocarcinoma | Male | >=65 | I/II | Unknown | Unknown | PD | |
| CCT8 | SNV | Missense_Mutation | c.1525N>G | p.Lys509Glu | p.K509E | P50990 | protein_coding | deleterious(0.02) | possibly_damaging(0.78) | TCGA-AD-6895-01 | Colorectum | colon adenocarcinoma | Male | >=65 | III/IV | Unknown | Unknown | SD |
| Page: 1 2 3 4 |
Top |
Related drugs of malignant transformation related genes |
| Identification of chemicals and drugs interact with genes involved in malignant transfromation |
| (DGIdb 4.0) |
| Entrez ID | Symbol | Category | Interaction Types | Drug Claim Name | Drug Name | PMIDs |
| Page: 1 |

Copyright 2023-Present -The University of Texas Health Science Center at Houston |