
|
|||||
|
 | |
| |
| |
| |
| |
| |
|
Gene: BTG1 |
Gene summary for BTG1 |
| Gene information | Species | Human | Gene symbol | BTG1 | Gene ID | 694 |
| Gene name | BTG anti-proliferation factor 1 | |
| Gene Alias | APRO2 | |
| Cytomap | 12q21.33 | |
| Gene Type | protein-coding | GO ID | GO:0000003 | UniProtAcc | P62324 |
Top |
Malignant transformation analysis |
| Identification of the aberrant gene expression in precancerous and cancerous lesions by comparing the gene expression of stem-like cells in diseased tissues with normal stem cells |
| Entrez ID | Symbol | Replicates | Species | Organ | Tissue | Adj P-value | Log2FC | Malignancy |
| 694 | BTG1 | GSM4909281 | Human | Breast | IDC | 1.61e-17 | -4.82e-01 | 0.21 |
| 694 | BTG1 | GSM4909282 | Human | Breast | IDC | 1.81e-13 | -4.73e-01 | -0.0288 |
| 694 | BTG1 | GSM4909285 | Human | Breast | IDC | 1.81e-08 | -2.11e-01 | 0.21 |
| 694 | BTG1 | GSM4909286 | Human | Breast | IDC | 5.07e-04 | 2.02e-01 | 0.1081 |
| 694 | BTG1 | GSM4909287 | Human | Breast | IDC | 2.11e-17 | -6.22e-01 | 0.2057 |
| 694 | BTG1 | GSM4909288 | Human | Breast | IDC | 3.85e-02 | -4.84e-01 | 0.0988 |
| 694 | BTG1 | GSM4909289 | Human | Breast | IDC | 9.80e-03 | -5.93e-01 | 0.1064 |
| 694 | BTG1 | GSM4909290 | Human | Breast | IDC | 3.97e-14 | -4.94e-01 | 0.2096 |
| 694 | BTG1 | GSM4909291 | Human | Breast | IDC | 6.95e-11 | -5.38e-01 | 0.1753 |
| 694 | BTG1 | GSM4909292 | Human | Breast | IDC | 4.07e-02 | -7.02e-01 | 0.1236 |
| 694 | BTG1 | GSM4909293 | Human | Breast | IDC | 1.30e-03 | -1.58e-01 | 0.1581 |
| 694 | BTG1 | GSM4909294 | Human | Breast | IDC | 2.06e-25 | -6.63e-01 | 0.2022 |
| 694 | BTG1 | GSM4909296 | Human | Breast | IDC | 7.63e-43 | -9.25e-01 | 0.1524 |
| 694 | BTG1 | GSM4909297 | Human | Breast | IDC | 1.24e-11 | -6.58e-02 | 0.1517 |
| 694 | BTG1 | GSM4909298 | Human | Breast | IDC | 4.21e-03 | -1.53e-01 | 0.1551 |
| 694 | BTG1 | GSM4909301 | Human | Breast | IDC | 1.53e-29 | -7.26e-01 | 0.1577 |
| 694 | BTG1 | GSM4909302 | Human | Breast | IDC | 5.21e-16 | -6.05e-01 | 0.1545 |
| 694 | BTG1 | GSM4909304 | Human | Breast | IDC | 1.04e-33 | -6.87e-01 | 0.1636 |
| 694 | BTG1 | GSM4909306 | Human | Breast | IDC | 1.68e-02 | -1.78e-01 | 0.1564 |
| 694 | BTG1 | GSM4909307 | Human | Breast | IDC | 1.55e-37 | -8.37e-01 | 0.1569 |
| Page: 1 2 3 4 5 6 7 8 9 10 11 12 13 14 15 16 |
| Tissue | Expression Dynamics | Abbreviation |
| Breast |  | IDC: Invasive ductal carcinoma |
| DCIS: Ductal carcinoma in situ | ||
| Precancer(BRCA1-mut): Precancerous lesion from BRCA1 mutation carriers | ||
| Cervix | 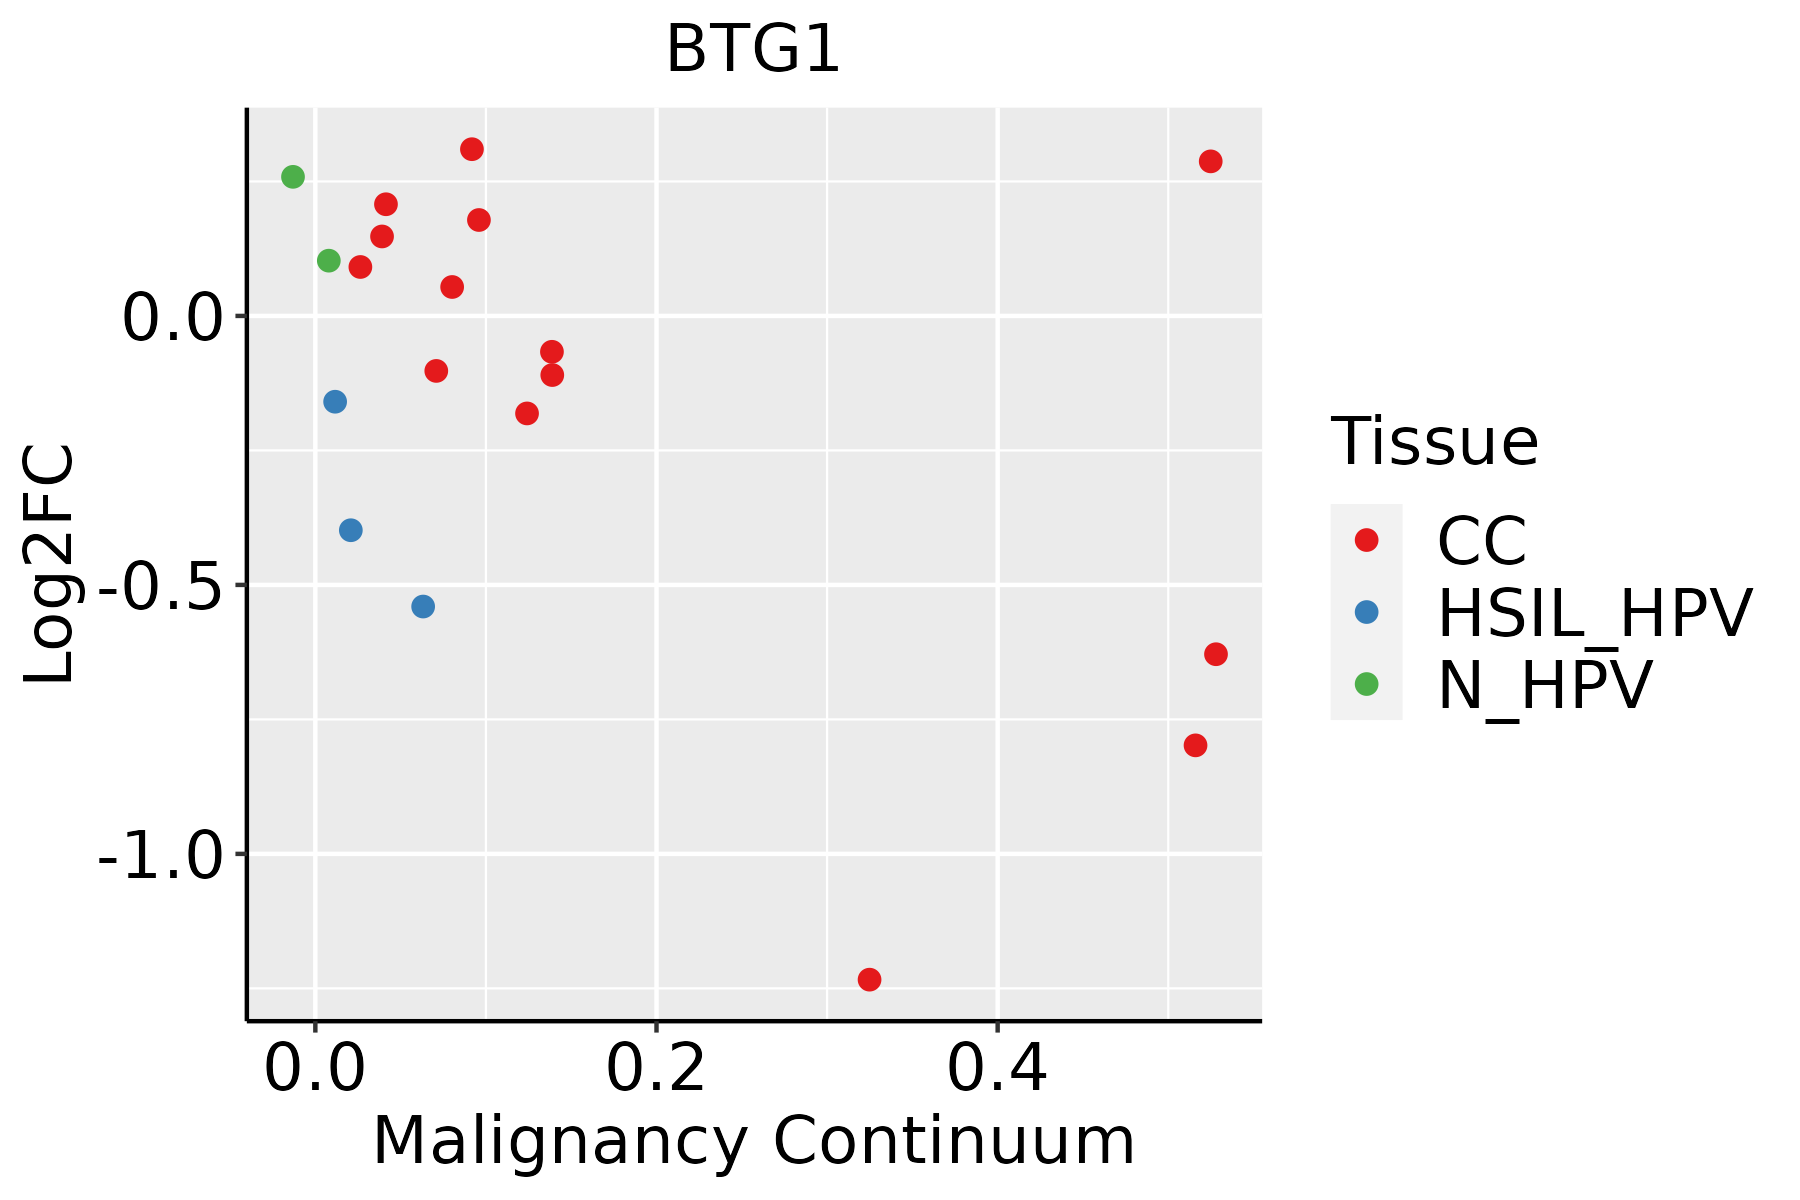 | CC: Cervix cancer |
| HSIL_HPV: HPV-infected high-grade squamous intraepithelial lesions | ||
| N_HPV: HPV-infected normal cervix | ||
| Colorectum (GSE201348) |  | FAP: Familial adenomatous polyposis |
| CRC: Colorectal cancer | ||
| Colorectum (HTA11) |  | AD: Adenomas |
| SER: Sessile serrated lesions | ||
| MSI-H: Microsatellite-high colorectal cancer | ||
| MSS: Microsatellite stable colorectal cancer | ||
| Endometrium | 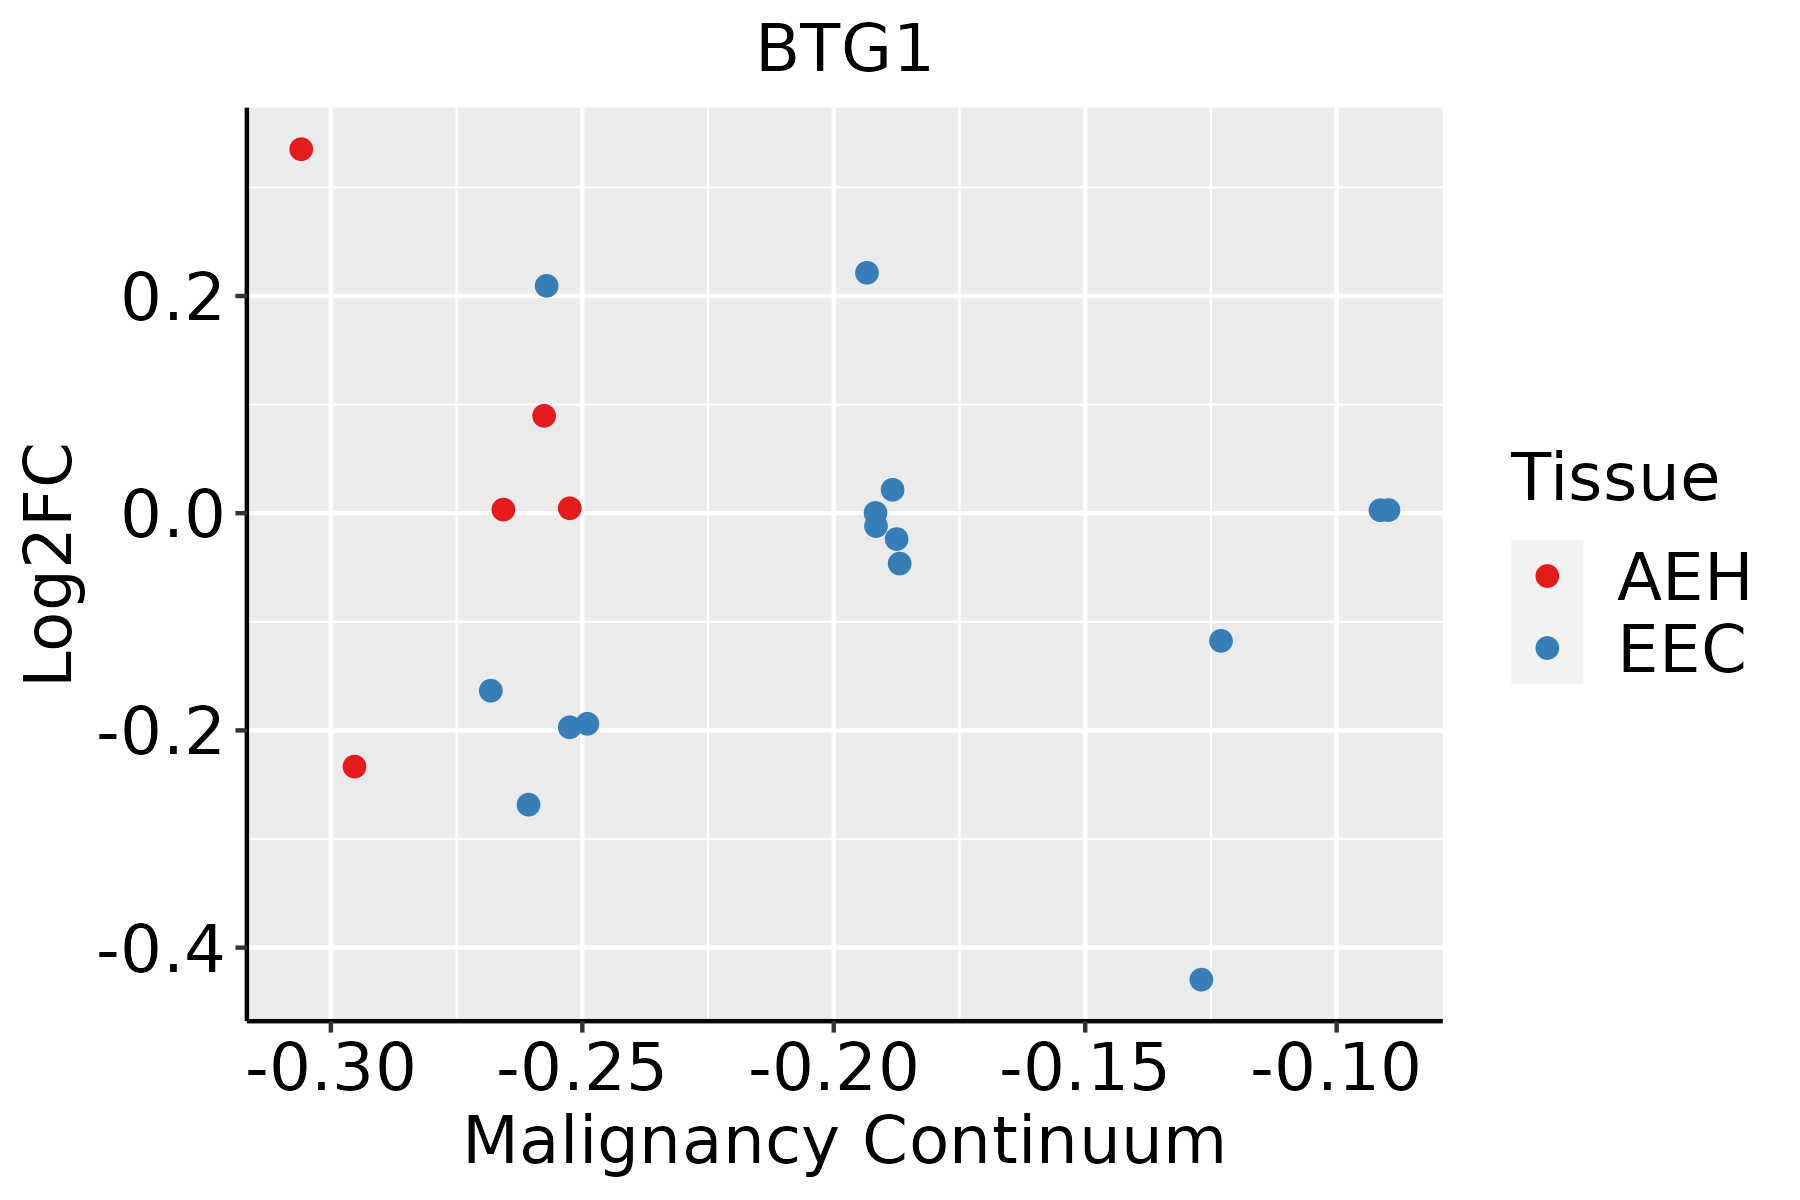 | AEH: Atypical endometrial hyperplasia |
| EEC: Endometrioid Cancer | ||
| Esophagus | 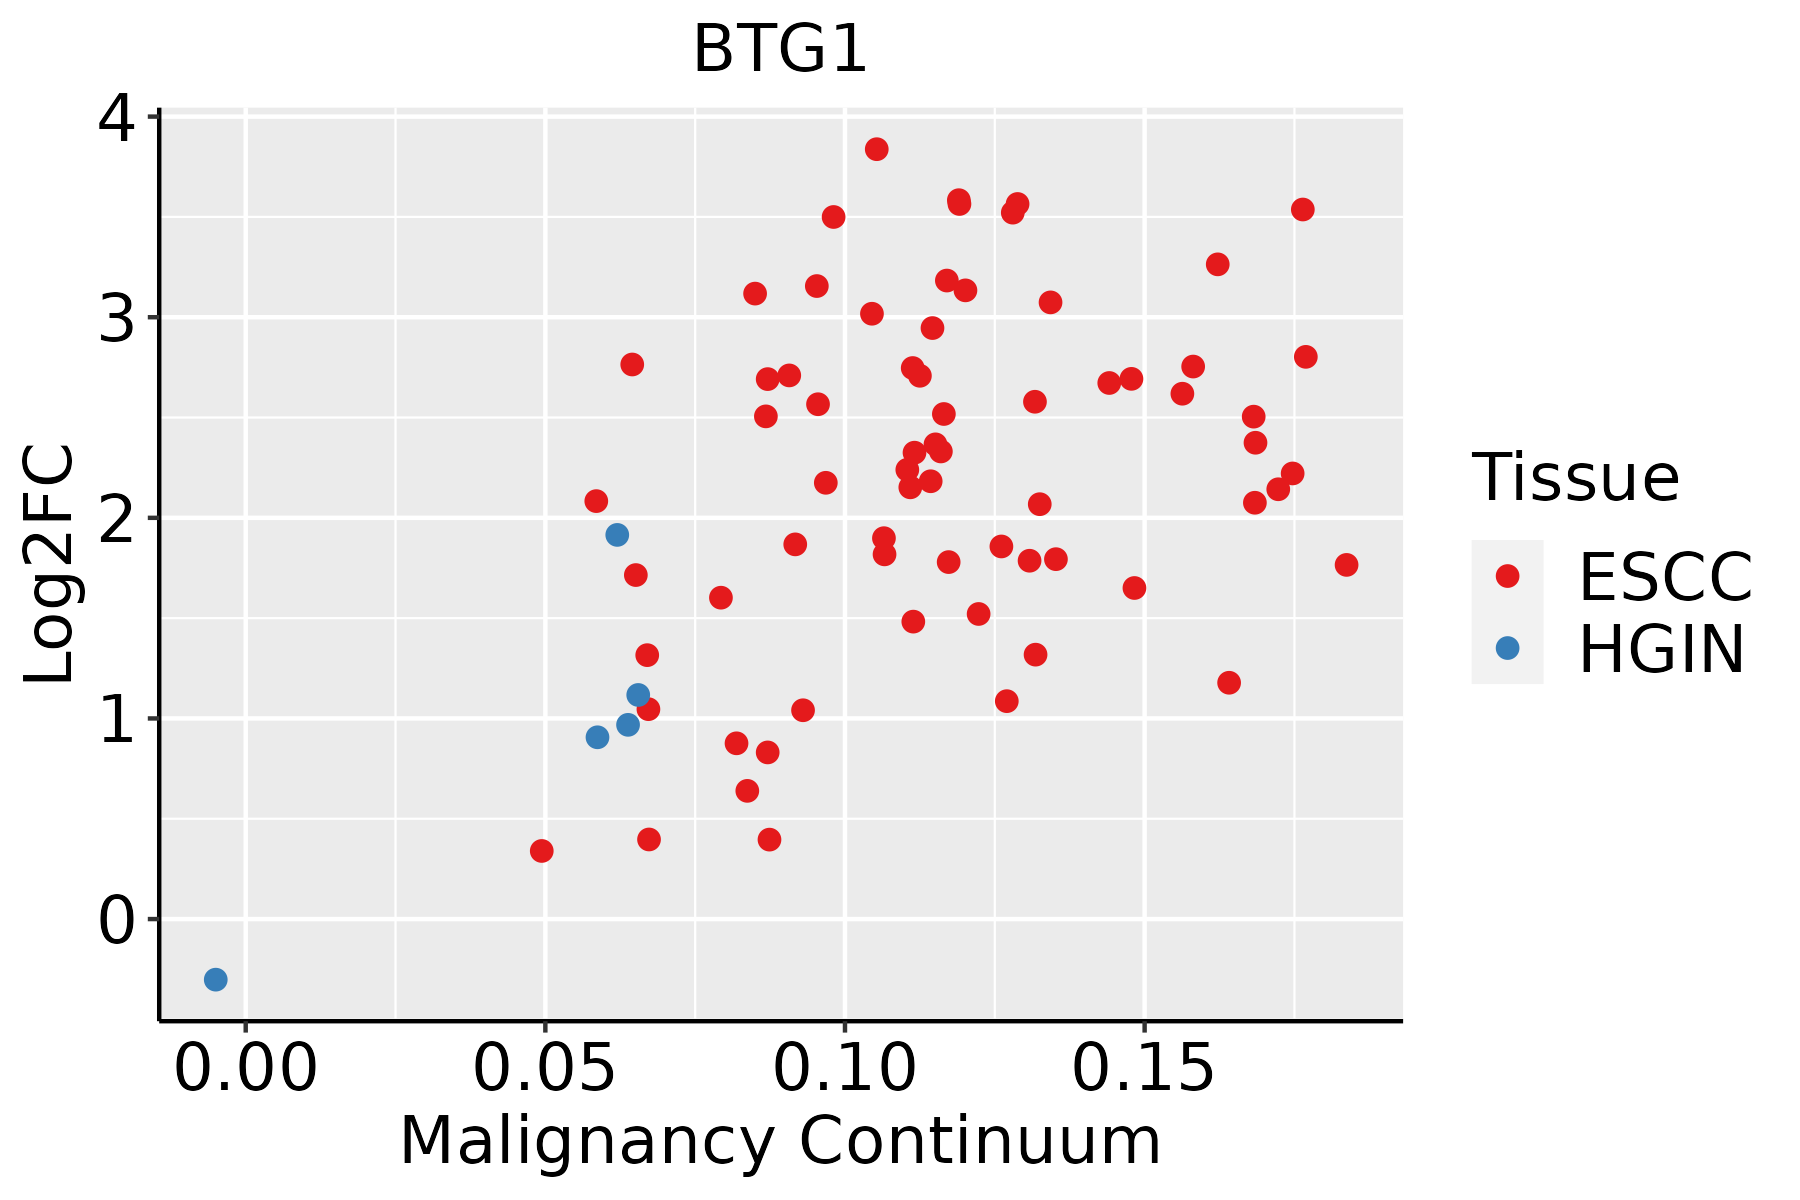 | ESCC: Esophageal squamous cell carcinoma |
| HGIN: High-grade intraepithelial neoplasias | ||
| LGIN: Low-grade intraepithelial neoplasias | ||
| GC | 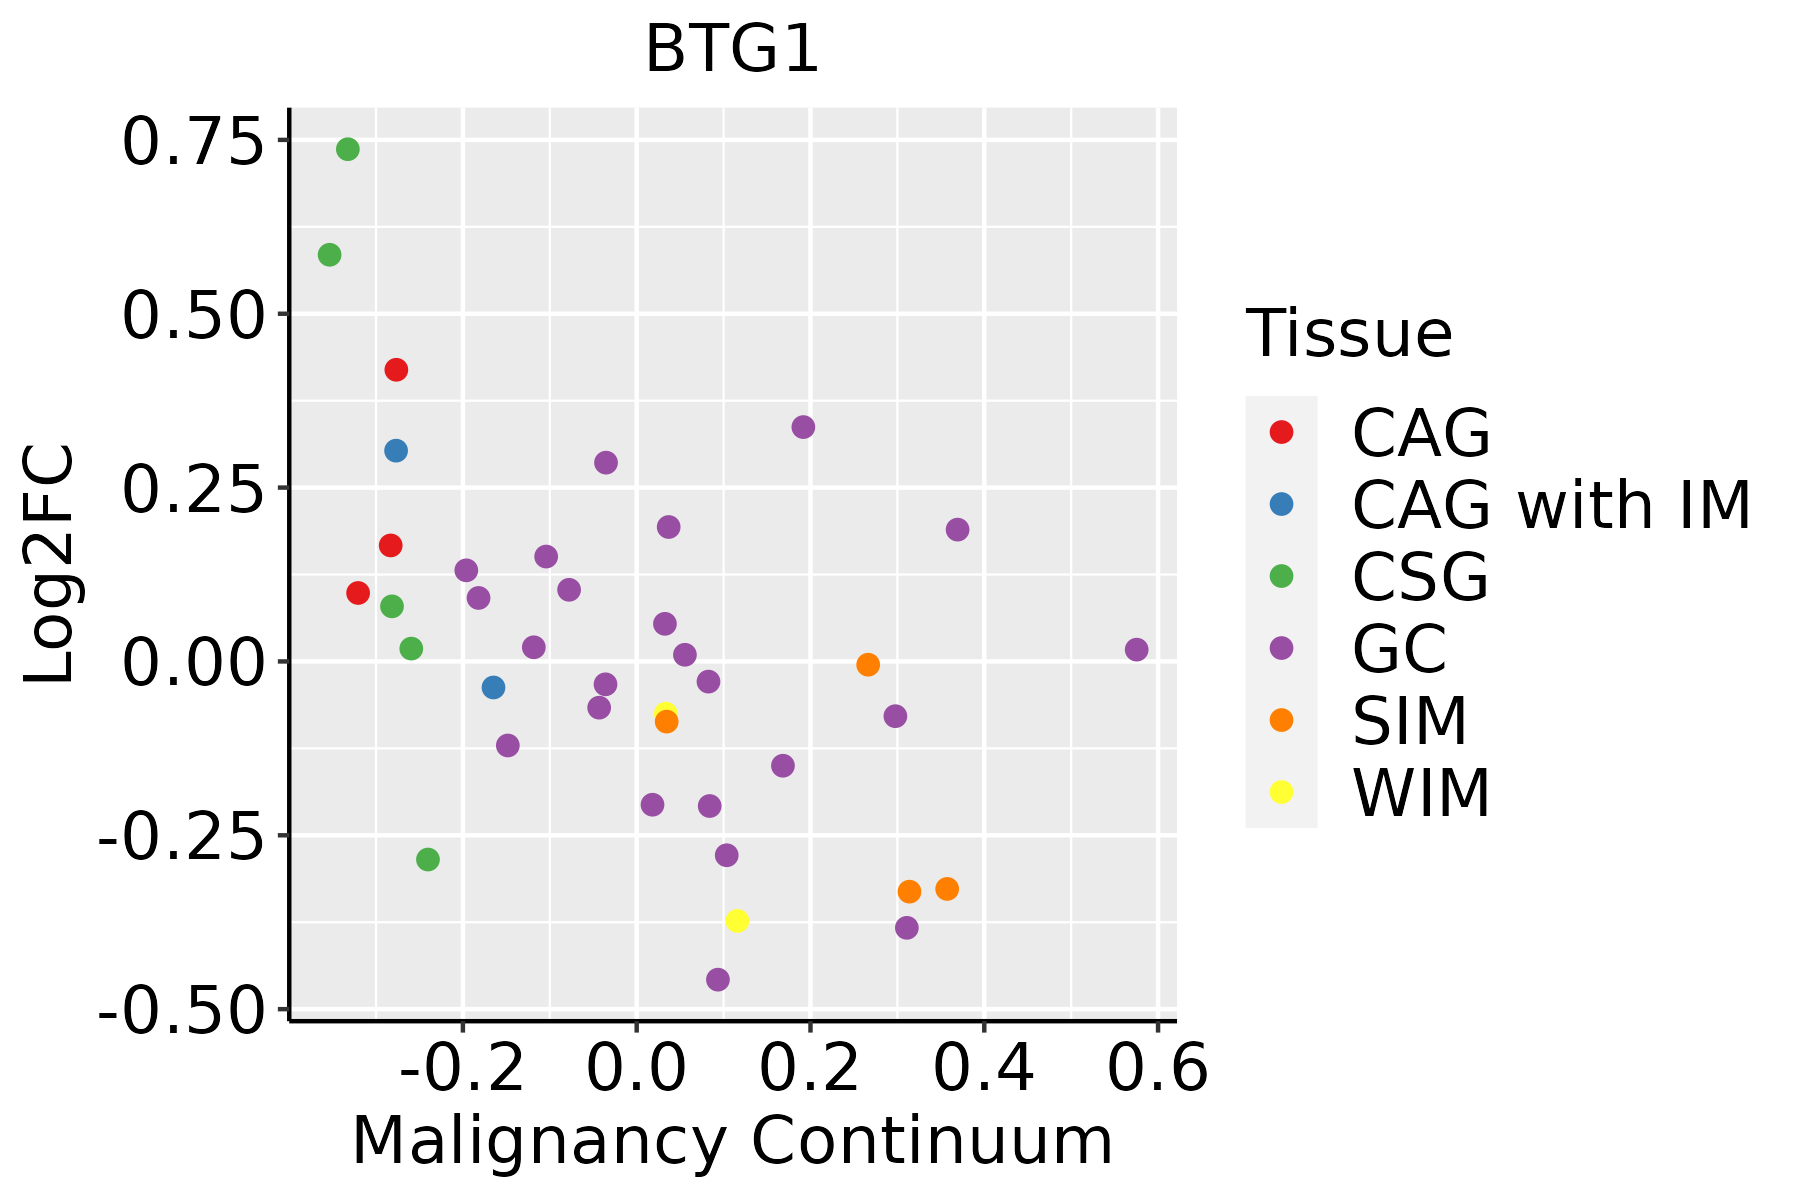 | CAG: Chronic atrophic gastritis |
| CAG with IM: Chronic atrophic gastritis with intestinal metaplasia | ||
| CSG: Chronic superficial gastritis | ||
| GC: Gastric cancer | ||
| SIM: Severe intestinal metaplasia | ||
| WIM: Wild intestinal metaplasia | ||
| Liver |  | HCC: Hepatocellular carcinoma |
| NAFLD: Non-alcoholic fatty liver disease | ||
| Lung | 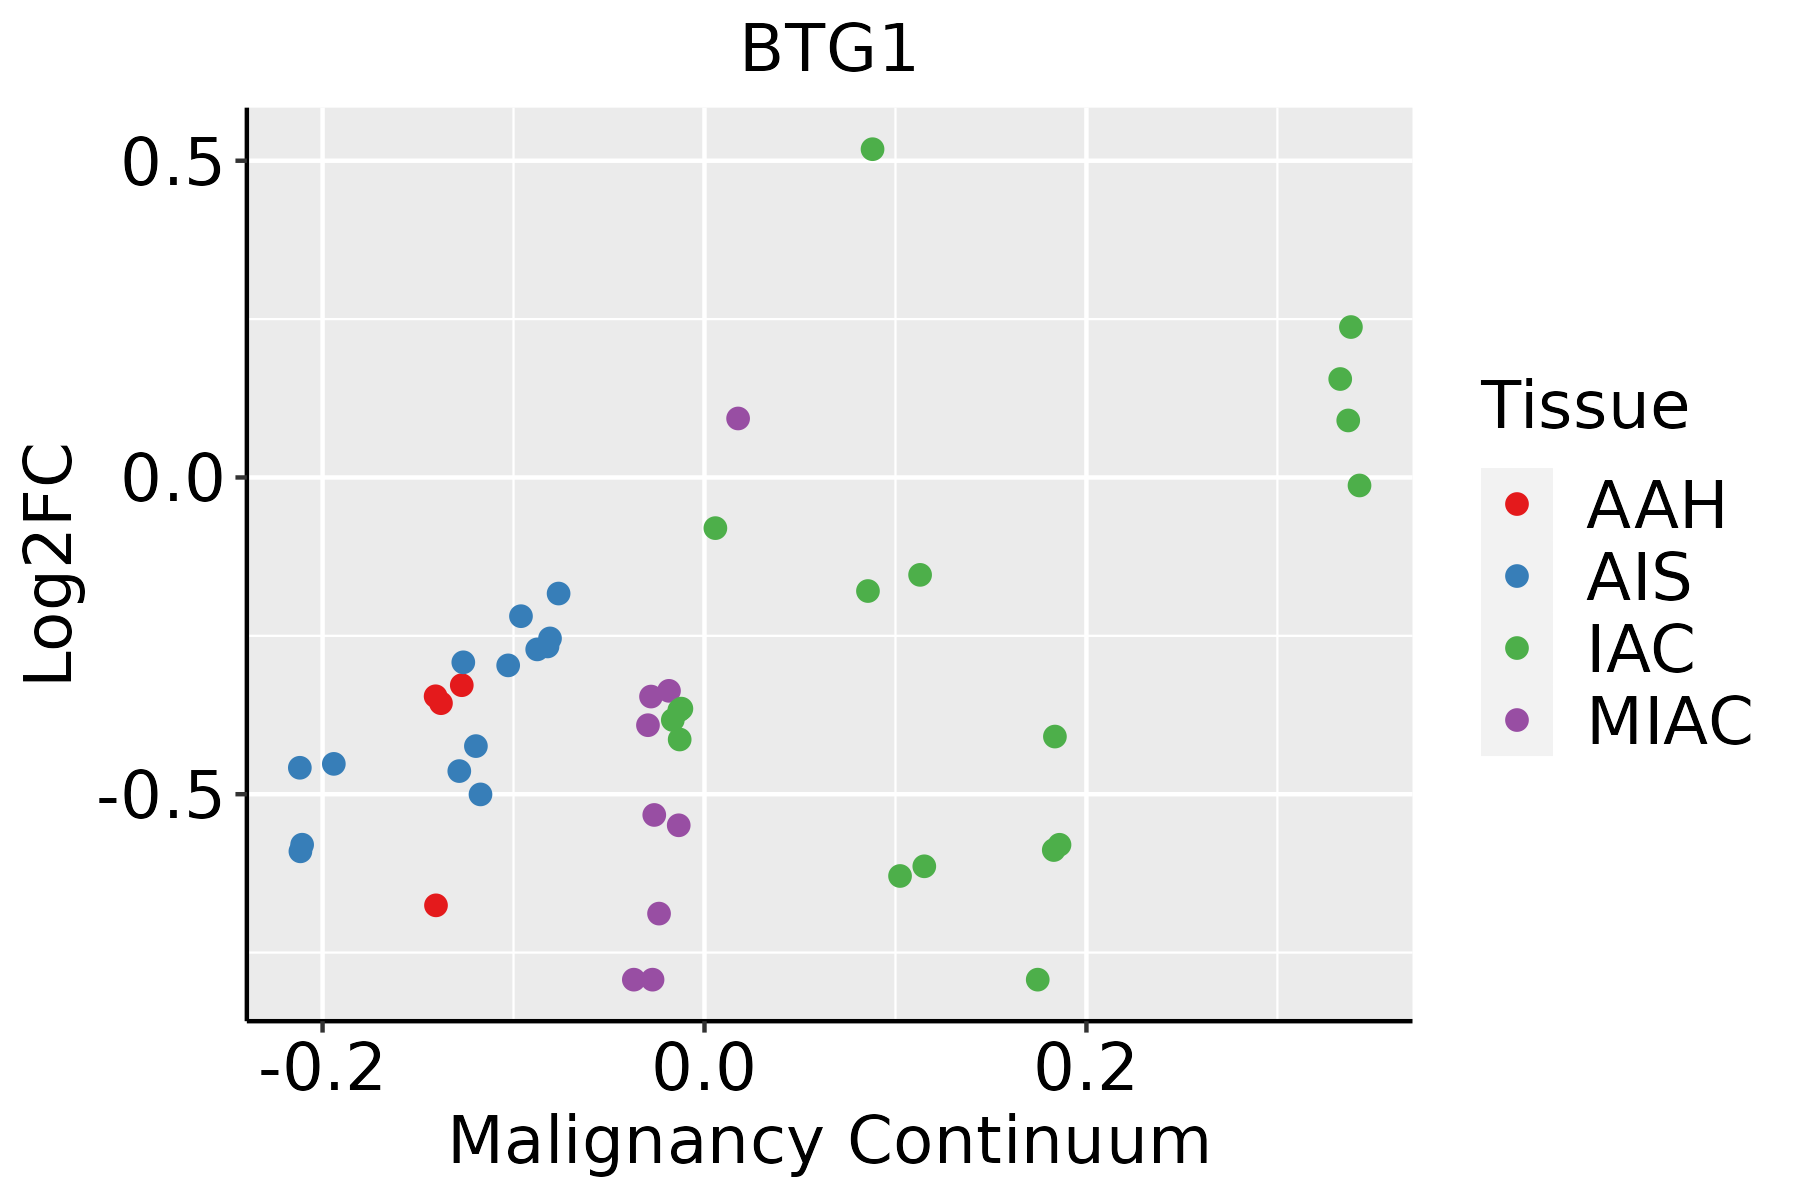 | AAH: Atypical adenomatous hyperplasia |
| AIS: Adenocarcinoma in situ | ||
| IAC: Invasive lung adenocarcinoma | ||
| MIA: Minimally invasive adenocarcinoma | ||
| Oral Cavity | 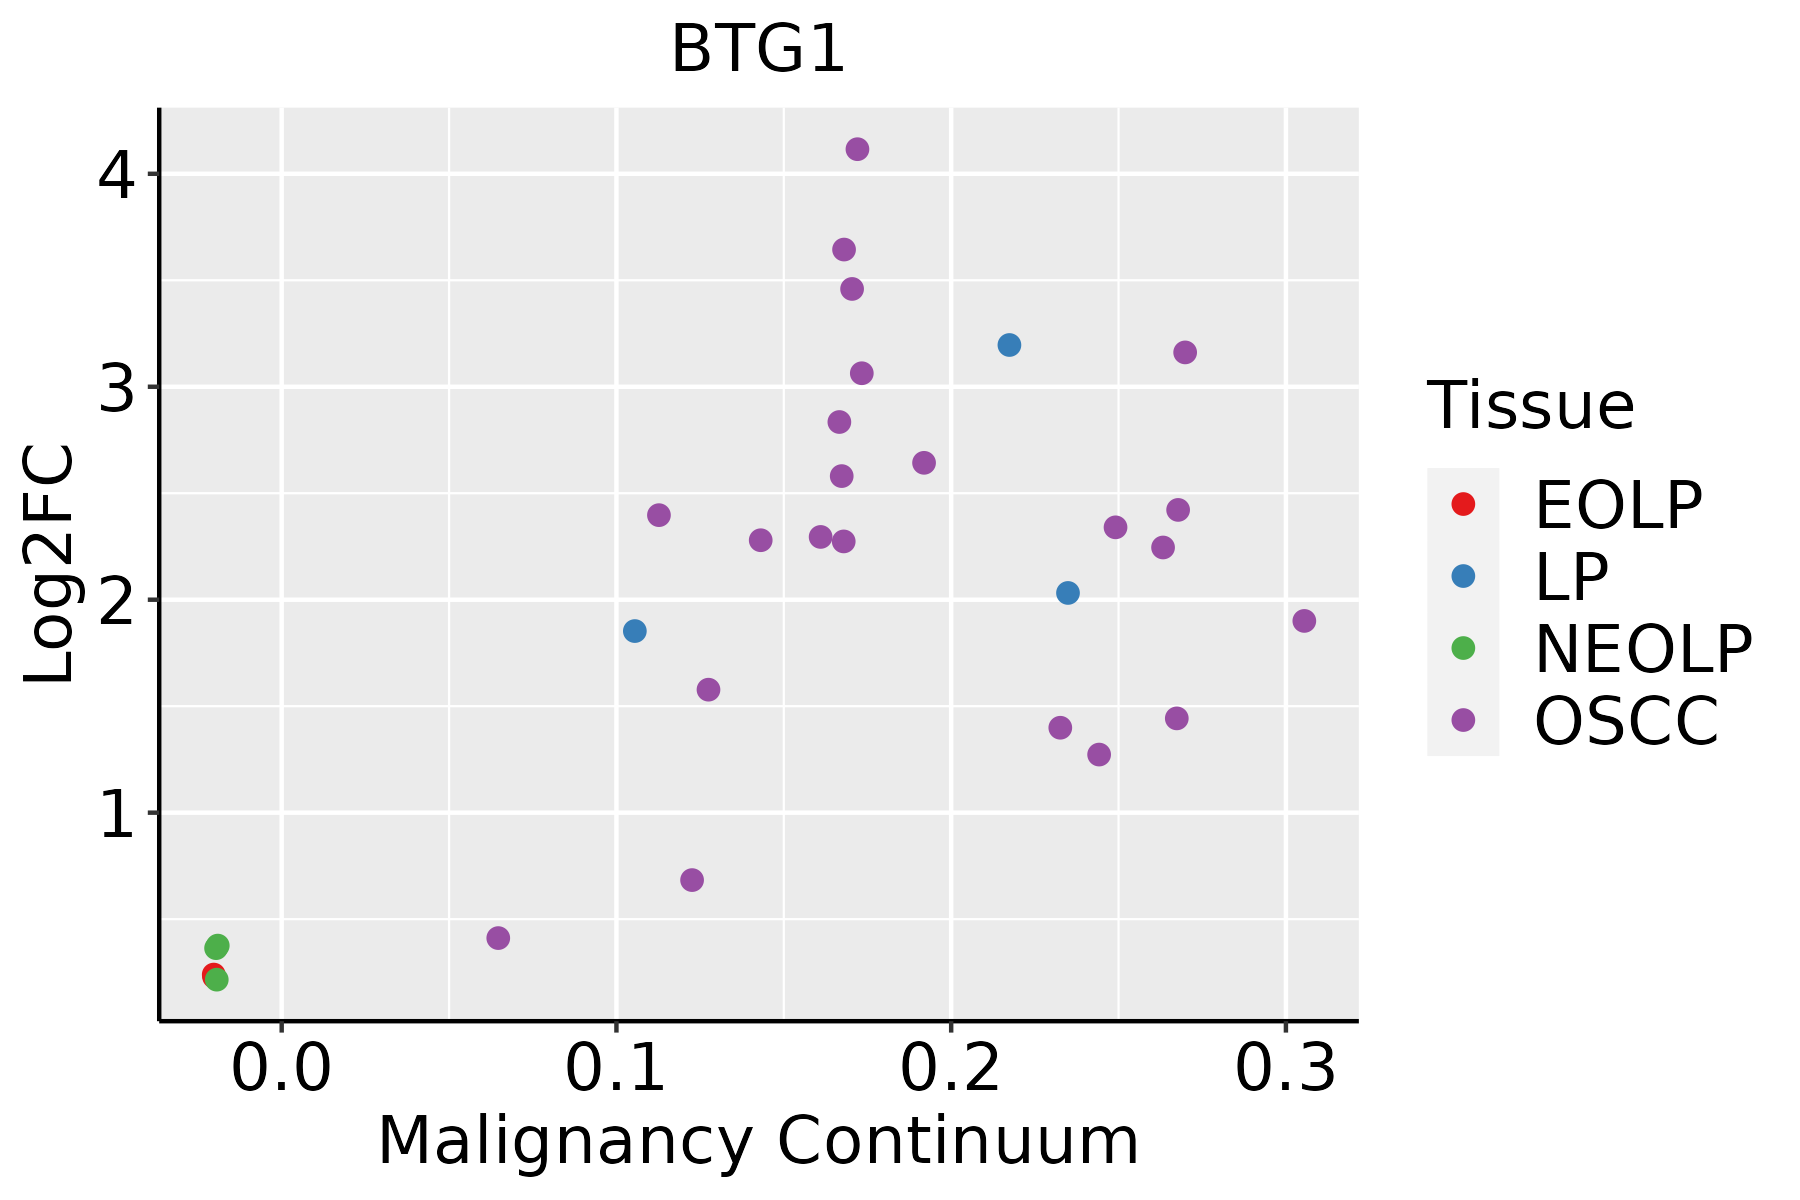 | EOLP: Erosive Oral lichen planus |
| LP: leukoplakia | ||
| NEOLP: Non-erosive oral lichen planus | ||
| OSCC: Oral squamous cell carcinoma | ||
| Prostate | 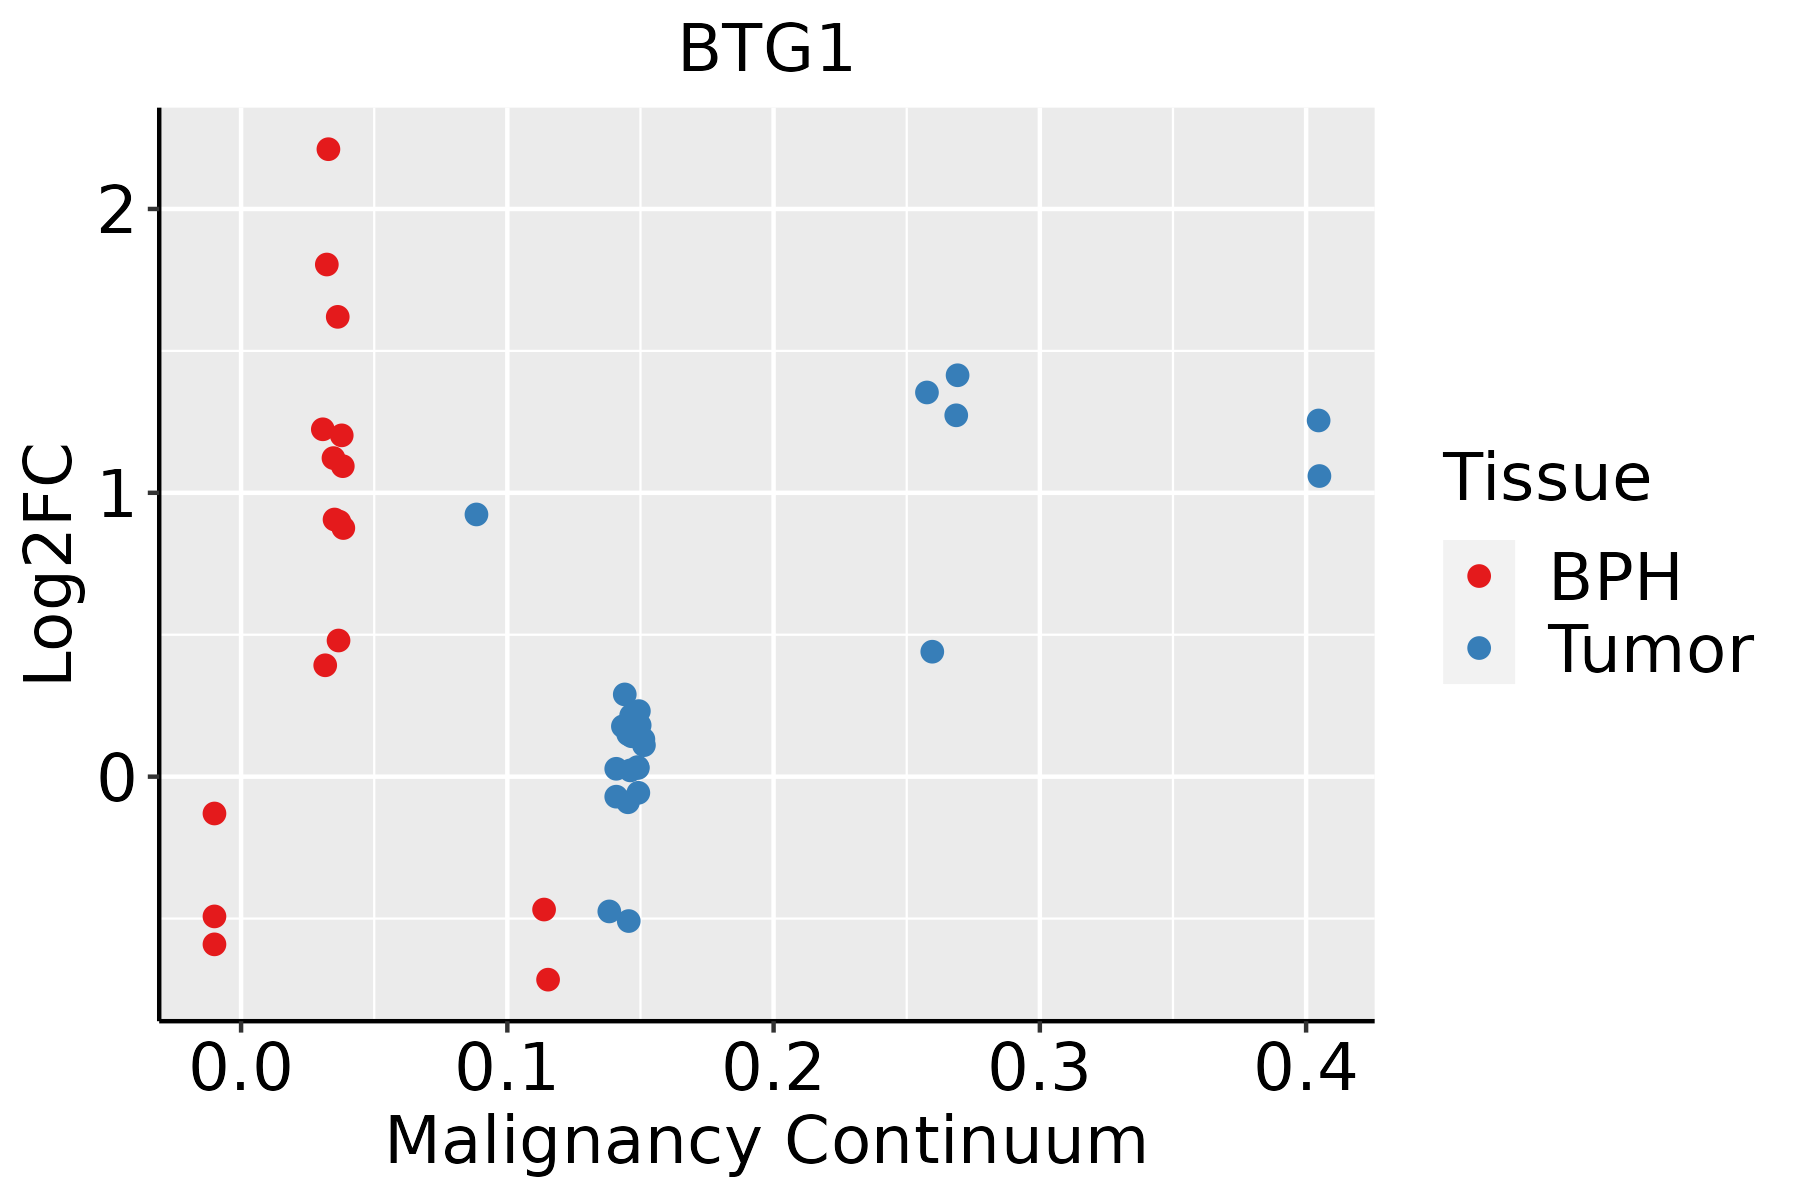 | BPH: Benign Prostatic Hyperplasia |
| Skin | 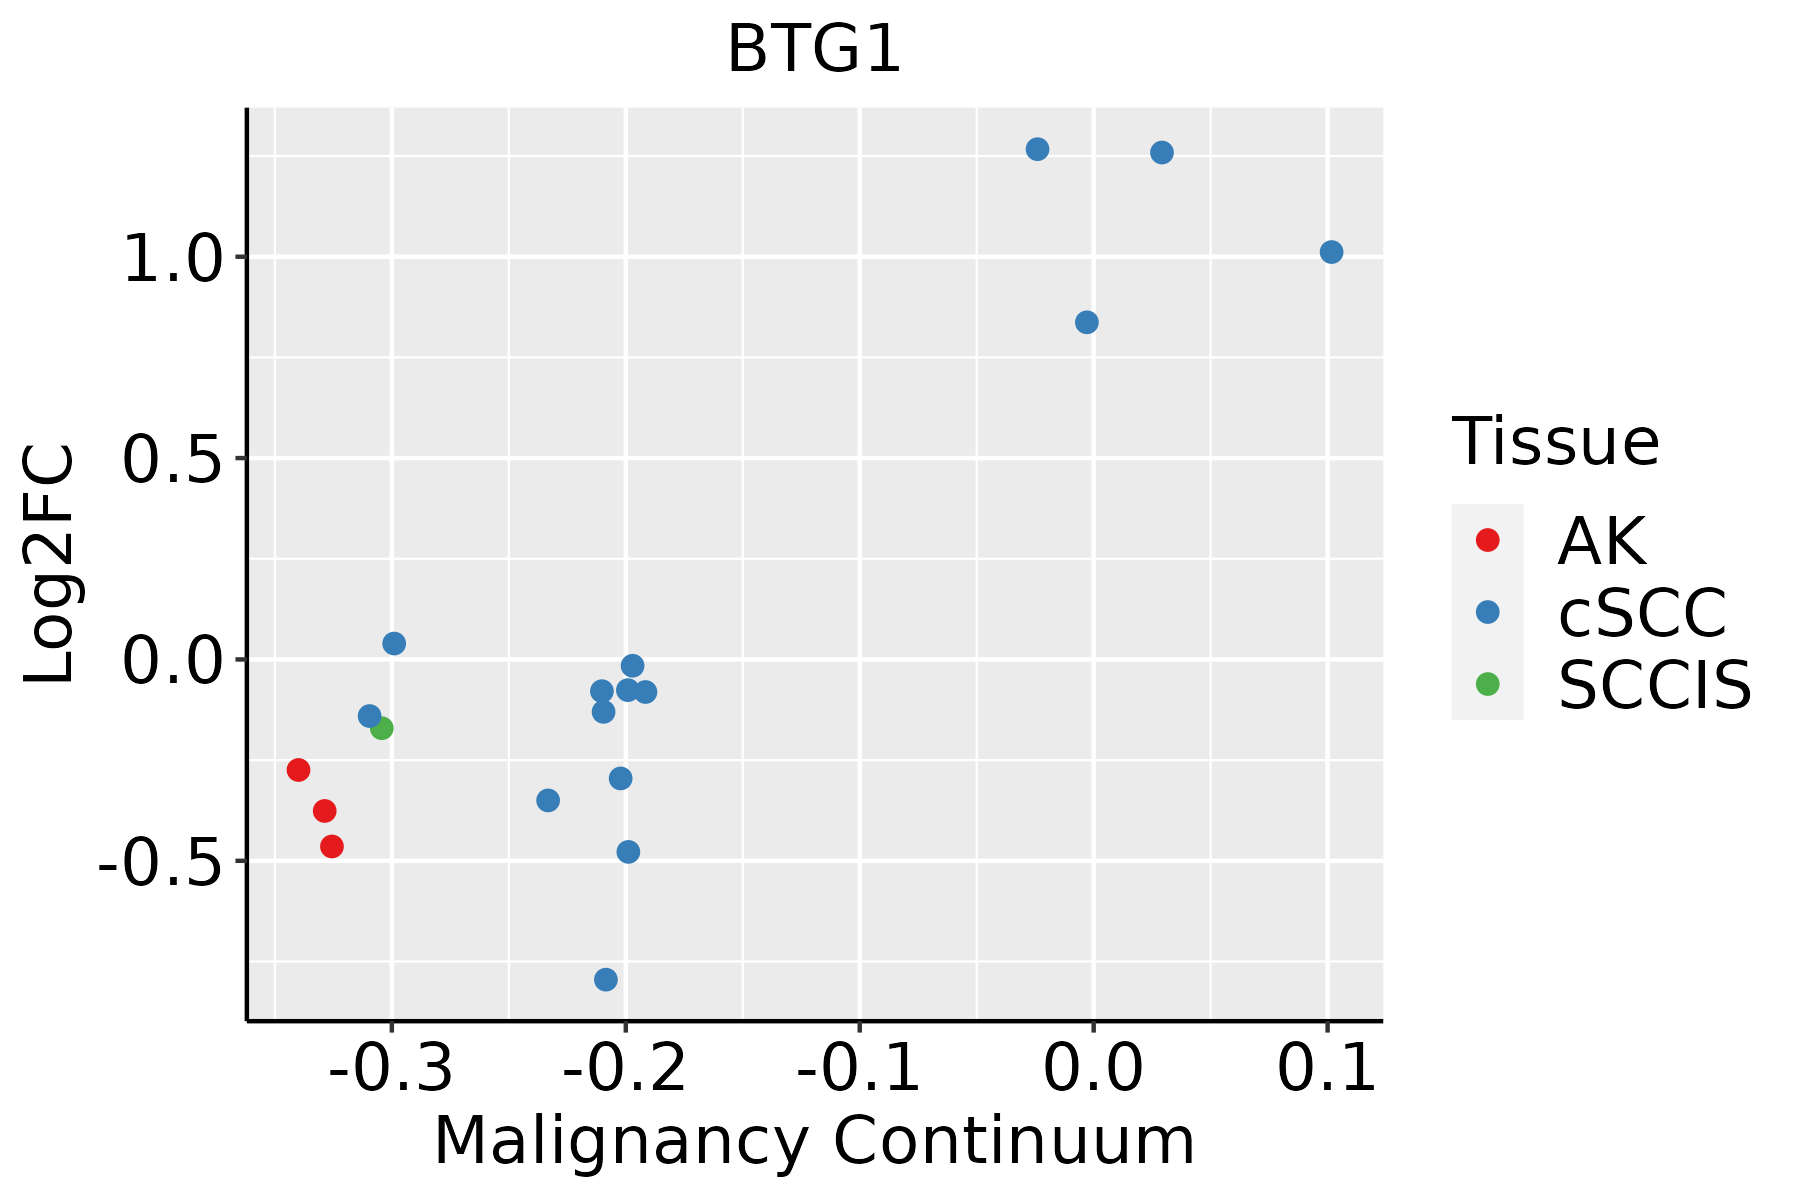 | AK: Actinic keratosis |
| cSCC: Cutaneous squamous cell carcinoma | ||
| SCCIS:squamous cell carcinoma in situ | ||
| Thyroid | 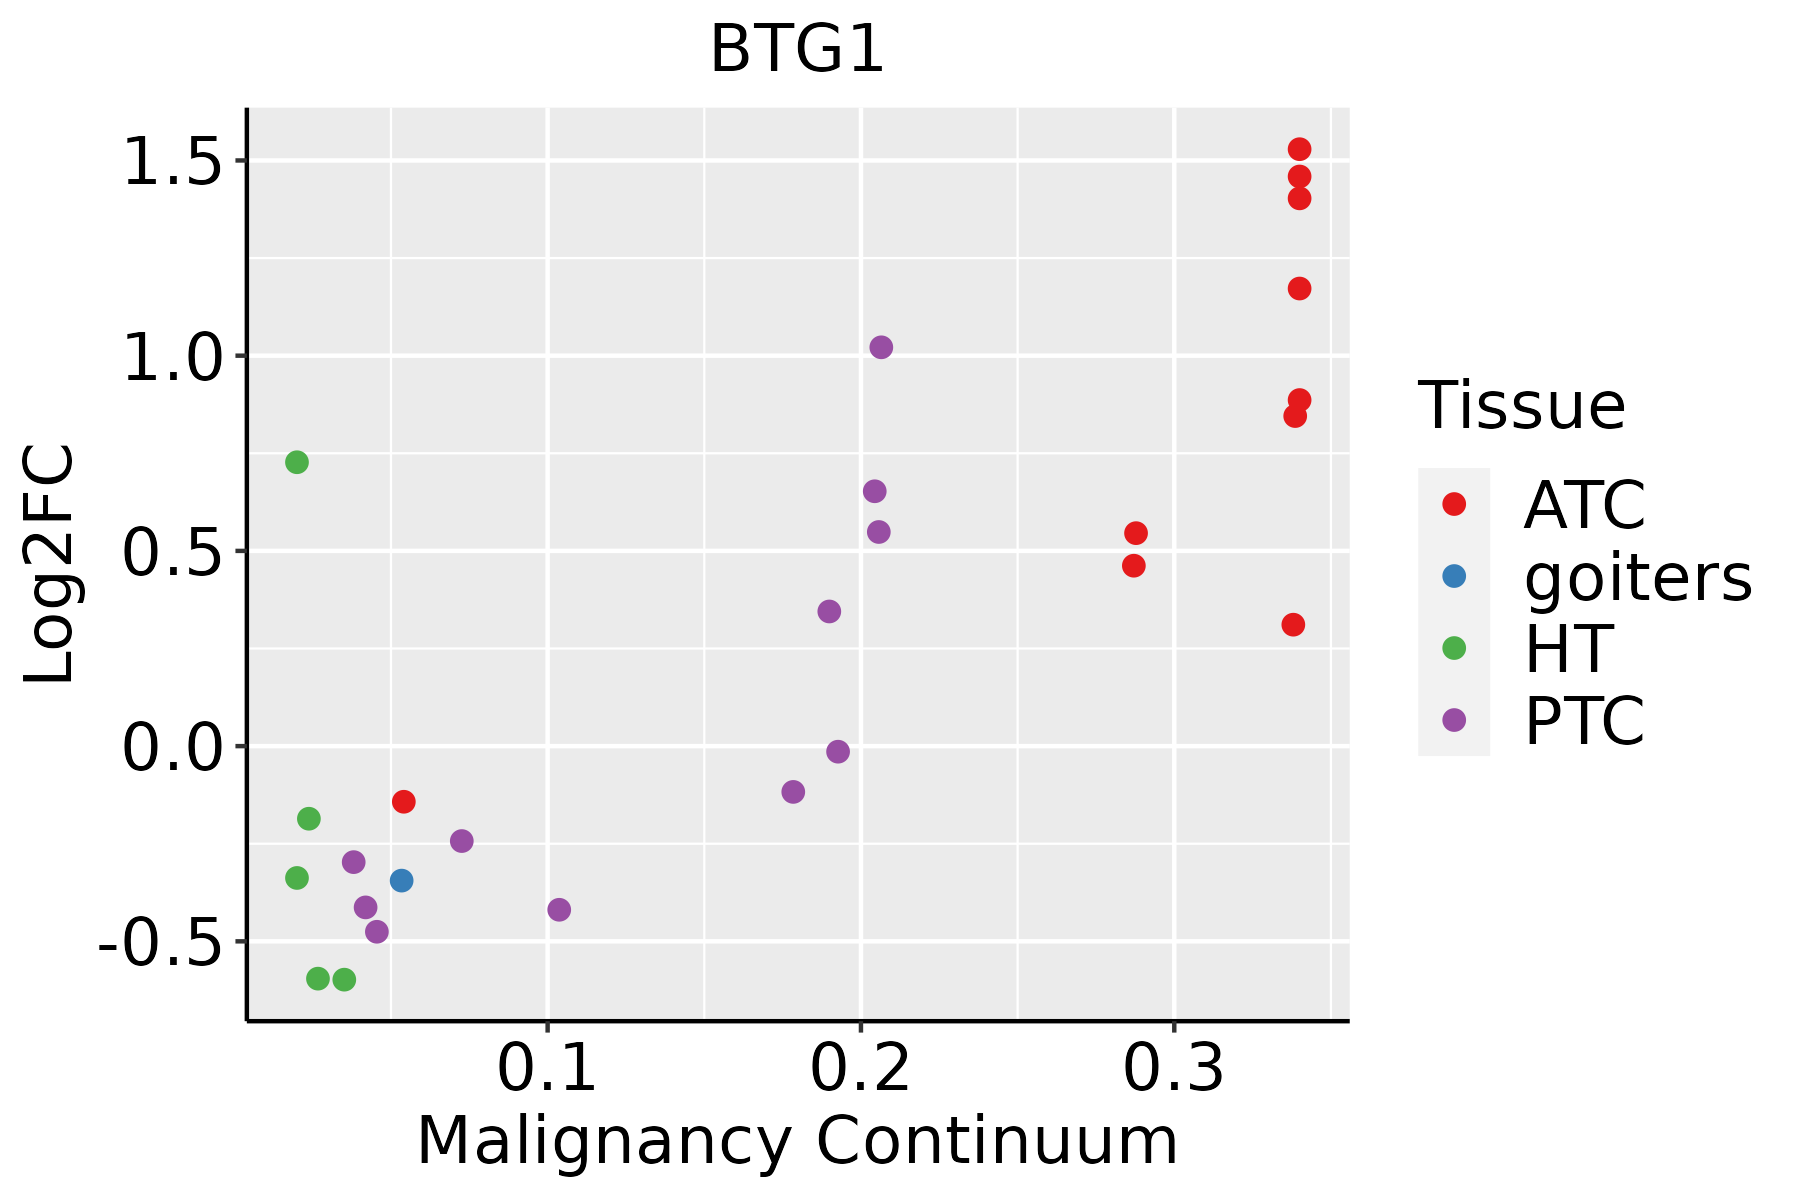 | ATC: Anaplastic thyroid cancer |
| HT: Hashimoto's thyroiditis | ||
| PTC: Papillary thyroid cancer |
| ∗log2FC in expression of this searched gene in stem-like cells from each diseased tissue sample relative to stem-like cells in normal samples in each tissue plotted against the malignancy continuum. Samples are colored based on if they are from different disease stage. |
Top |
Malignant transformation related pathway analysis |
| Find out the enriched GO biological processes and KEGG pathways involved in transition from healthy to precancer to cancer |
| Tissue | Disease Stage | Enriched GO biological Processes |
| Colorectum | AD |  |
| Colorectum | SER |  |
| Colorectum | MSS |  |
| Colorectum | MSI-H |  |
| Colorectum | FAP |  |
| ∗Top 15 enriched GO BP terms are showed in the bar plot of each disease state in each tissue. Each row represents a significant GO biological process which is colored according to the -log10(p.adjust). |
| Page: 1 2 3 4 5 6 7 8 9 |
| GO ID | Tissue | Disease Stage | Description | Gene Ratio | Bg Ratio | pvalue | p.adjust | Count |
| GO:000315812 | Lung | AIS | endothelium development | 25/1849 | 136/18723 | 1.67e-03 | 1.90e-02 | 25 |
| GO:004544612 | Lung | AIS | endothelial cell differentiation | 21/1849 | 118/18723 | 5.54e-03 | 4.71e-02 | 21 |
| GO:000647911 | Lung | AIS | protein methylation | 29/1849 | 181/18723 | 6.16e-03 | 4.98e-02 | 29 |
| GO:000821311 | Lung | AIS | protein alkylation | 29/1849 | 181/18723 | 6.16e-03 | 4.98e-02 | 29 |
| GO:000647921 | Lung | AAH | protein methylation | 15/613 | 181/18723 | 9.29e-04 | 2.92e-02 | 15 |
| GO:000821321 | Lung | AAH | protein alkylation | 15/613 | 181/18723 | 9.29e-04 | 2.92e-02 | 15 |
| GO:000315822 | Lung | AAH | endothelium development | 12/613 | 136/18723 | 1.72e-03 | 4.16e-02 | 12 |
| GO:000697923 | Lung | MIAC | response to oxidative stress | 43/967 | 446/18723 | 6.39e-05 | 3.12e-03 | 43 |
| GO:001604922 | Lung | MIAC | cell growth | 42/967 | 482/18723 | 6.66e-04 | 1.59e-02 | 42 |
| GO:000647931 | Lung | MIAC | protein methylation | 20/967 | 181/18723 | 1.11e-03 | 2.19e-02 | 20 |
| GO:000821331 | Lung | MIAC | protein alkylation | 20/967 | 181/18723 | 1.11e-03 | 2.19e-02 | 20 |
| GO:004343423 | Lung | MIAC | response to peptide hormone | 35/967 | 414/18723 | 2.97e-03 | 4.00e-02 | 35 |
| GO:000697920 | Oral cavity | OSCC | response to oxidative stress | 273/7305 | 446/18723 | 8.35e-22 | 1.65e-19 | 273 |
| GO:00073469 | Oral cavity | OSCC | regulation of mitotic cell cycle | 266/7305 | 457/18723 | 3.87e-17 | 3.41e-15 | 266 |
| GO:001604917 | Oral cavity | OSCC | cell growth | 268/7305 | 482/18723 | 6.55e-14 | 3.51e-12 | 268 |
| GO:000155816 | Oral cavity | OSCC | regulation of cell growth | 228/7305 | 414/18723 | 1.74e-11 | 6.09e-10 | 228 |
| GO:00457864 | Oral cavity | OSCC | negative regulation of cell cycle | 206/7305 | 385/18723 | 4.28e-09 | 9.55e-08 | 206 |
| GO:00459304 | Oral cavity | OSCC | negative regulation of mitotic cell cycle | 132/7305 | 235/18723 | 6.51e-08 | 1.16e-06 | 132 |
| GO:00459266 | Oral cavity | OSCC | negative regulation of growth | 135/7305 | 249/18723 | 7.29e-07 | 1.03e-05 | 135 |
| GO:004343419 | Oral cavity | OSCC | response to peptide hormone | 208/7305 | 414/18723 | 1.83e-06 | 2.35e-05 | 208 |
| Page: 1 2 3 4 5 6 7 8 9 10 11 12 13 14 15 16 17 18 19 |
| Pathway ID | Tissue | Disease Stage | Description | Gene Ratio | Bg Ratio | pvalue | p.adjust | qvalue | Count |
| hsa030186 | Breast | Precancer | RNA degradation | 14/684 | 79/8465 | 3.97e-03 | 2.37e-02 | 1.81e-02 | 14 |
| hsa0301811 | Breast | Precancer | RNA degradation | 14/684 | 79/8465 | 3.97e-03 | 2.37e-02 | 1.81e-02 | 14 |
| hsa0301824 | Esophagus | ESCC | RNA degradation | 62/4205 | 79/8465 | 1.18e-07 | 9.39e-07 | 4.81e-07 | 62 |
| hsa0301834 | Esophagus | ESCC | RNA degradation | 62/4205 | 79/8465 | 1.18e-07 | 9.39e-07 | 4.81e-07 | 62 |
| hsa0301861 | Oral cavity | NEOLP | RNA degradation | 18/1112 | 79/8465 | 1.25e-02 | 4.06e-02 | 2.56e-02 | 18 |
| hsa0301871 | Oral cavity | NEOLP | RNA degradation | 18/1112 | 79/8465 | 1.25e-02 | 4.06e-02 | 2.56e-02 | 18 |
| Page: 1 |
Top |
Cell-cell communication analysis |
| Identification of potential cell-cell interactions between two cell types and their ligand-receptor pairs for different disease states |
| Ligand | Receptor | LRpair | Pathway | Tissue | Disease Stage |
| Page: 1 |
Top |
Single-cell gene regulatory network inference analysis |
| Find out the significant the regulons (TFs) and the target genes of each regulon across cell types for different disease states |
| TF | Cell Type | Tissue | Disease Stage | Target Gene | RSS | Regulon Activity |
| ∗The dot plots of a searched regulon are shown for all cell subpopulations in each disease state of each tissue based on the regulon specific score inferred using pySCENIC and by calculating the average expression. |
| Page: 1 |
Top |
Somatic mutation of malignant transformation related genes |
| Annotation of somatic variants for genes involved in malignant transformation |
| Hugo Symbol | Variant Class | Variant Classification | dbSNP RS | HGVSc | HGVSp | HGVSp Short | SWISSPROT | BIOTYPE | SIFT | PolyPhen | Tumor Sample Barcode | Tissue | Histology | Sex | Age | Stage | Therapy Types | Drugs | Outcome |
| BTG1 | SNV | Missense_Mutation | c.407N>G | p.Asn136Ser | p.N136S | P62324 | protein_coding | tolerated(0.57) | benign(0) | TCGA-G4-6304-01 | Colorectum | colon adenocarcinoma | Female | >=65 | I/II | Chemotherapy | fluorouracil | PD | |
| BTG1 | SNV | Missense_Mutation | novel | c.128G>A | p.Ser43Asn | p.S43N | P62324 | protein_coding | tolerated(0.1) | benign(0.141) | TCGA-AP-A1DV-01 | Endometrium | uterine corpus endometrioid carcinoma | Female | <65 | I/II | Unknown | Unknown | SD |
| BTG1 | SNV | Missense_Mutation | novel | c.233N>T | p.Pro78Leu | p.P78L | P62324 | protein_coding | deleterious(0) | probably_damaging(1) | TCGA-B5-A3FC-01 | Endometrium | uterine corpus endometrioid carcinoma | Female | <65 | I/II | Unknown | Unknown | SD |
| BTG1 | SNV | Missense_Mutation | rs764941738 | c.415N>G | p.Asn139Asp | p.N139D | P62324 | protein_coding | tolerated(0.87) | benign(0.011) | TCGA-DF-A2KU-01 | Endometrium | uterine corpus endometrioid carcinoma | Female | Unknown | I/II | Unknown | Unknown | SD |
| BTG1 | SNV | Missense_Mutation | novel | c.172N>G | p.Pro58Ala | p.P58A | P62324 | protein_coding | deleterious(0) | probably_damaging(1) | TCGA-55-8616-01 | Lung | lung adenocarcinoma | Female | <65 | I/II | Unknown | Unknown | SD |
| BTG1 | SNV | Missense_Mutation | c.80N>C | p.Arg27Pro | p.R27P | P62324 | protein_coding | deleterious(0) | possibly_damaging(0.857) | TCGA-37-3789-01 | Lung | lung squamous cell carcinoma | Male | >=65 | I/II | Unknown | Unknown | SD | |
| BTG1 | SNV | Missense_Mutation | c.365G>T | p.Cys122Phe | p.C122F | P62324 | protein_coding | deleterious(0) | probably_damaging(0.996) | TCGA-CN-6021-01 | Oral cavity | head & neck squamous cell carcinoma | Female | <65 | I/II | Unknown | Unknown | PD | |
| BTG1 | insertion | Frame_Shift_Ins | novel | c.439_440insA | p.Ile147AsnfsTer4 | p.I147Nfs*4 | P62324 | protein_coding | TCGA-HC-8258-01 | Prostate | prostate adenocarcinoma | Male | <65 | 6 | Unknown | Unknown | SD |
| Page: 1 |
Top |
Related drugs of malignant transformation related genes |
| Identification of chemicals and drugs interact with genes involved in malignant transfromation |
| (DGIdb 4.0) |
| Entrez ID | Symbol | Category | Interaction Types | Drug Claim Name | Drug Name | PMIDs |
| Page: 1 |

Copyright 2023-Present -The University of Texas Health Science Center at Houston |