
|
|||||
|
 | |
| |
| |
| |
| |
| |
|
Gene: ATP2B4 |
Gene summary for ATP2B4 |
| Gene information | Species | Human | Gene symbol | ATP2B4 | Gene ID | 493 |
| Gene name | ATPase plasma membrane Ca2+ transporting 4 | |
| Gene Alias | ATP2B2 | |
| Cytomap | 1q32.1 | |
| Gene Type | protein-coding | GO ID | GO:0000003 | UniProtAcc | P23634 |
Top |
Malignant transformation analysis |
| Identification of the aberrant gene expression in precancerous and cancerous lesions by comparing the gene expression of stem-like cells in diseased tissues with normal stem cells |
| Entrez ID | Symbol | Replicates | Species | Organ | Tissue | Adj P-value | Log2FC | Malignancy |
| 493 | ATP2B4 | CA_HPV_3 | Human | Cervix | CC | 8.73e-03 | 1.06e-01 | 0.0414 |
| 493 | ATP2B4 | CCI_1 | Human | Cervix | CC | 9.10e-11 | 1.25e+00 | 0.528 |
| 493 | ATP2B4 | CCI_2 | Human | Cervix | CC | 9.36e-05 | 6.87e-01 | 0.5249 |
| 493 | ATP2B4 | CCI_3 | Human | Cervix | CC | 3.77e-18 | 1.09e+00 | 0.516 |
| 493 | ATP2B4 | sample3 | Human | Cervix | CC | 5.05e-06 | 2.51e-01 | 0.1387 |
| 493 | ATP2B4 | T3 | Human | Cervix | CC | 4.11e-02 | 2.10e-01 | 0.1389 |
| 493 | ATP2B4 | LZE2D | Human | Esophagus | HGIN | 3.16e-03 | 3.68e-01 | 0.0642 |
| 493 | ATP2B4 | LZE2T | Human | Esophagus | ESCC | 1.96e-03 | 6.19e-01 | 0.082 |
| 493 | ATP2B4 | LZE4T | Human | Esophagus | ESCC | 2.68e-17 | 5.77e-01 | 0.0811 |
| 493 | ATP2B4 | LZE7T | Human | Esophagus | ESCC | 7.24e-12 | 6.07e-01 | 0.0667 |
| 493 | ATP2B4 | LZE8T | Human | Esophagus | ESCC | 1.59e-04 | 3.16e-01 | 0.067 |
| 493 | ATP2B4 | LZE20T | Human | Esophagus | ESCC | 2.09e-03 | 3.46e-01 | 0.0662 |
| 493 | ATP2B4 | LZE24T | Human | Esophagus | ESCC | 1.41e-10 | 3.09e-01 | 0.0596 |
| 493 | ATP2B4 | LZE21T | Human | Esophagus | ESCC | 1.26e-09 | 1.09e+00 | 0.0655 |
| 493 | ATP2B4 | P1T-E | Human | Esophagus | ESCC | 6.74e-05 | 4.08e-01 | 0.0875 |
| 493 | ATP2B4 | P2T-E | Human | Esophagus | ESCC | 2.03e-30 | 6.00e-01 | 0.1177 |
| 493 | ATP2B4 | P4T-E | Human | Esophagus | ESCC | 8.46e-24 | 6.64e-01 | 0.1323 |
| 493 | ATP2B4 | P5T-E | Human | Esophagus | ESCC | 2.18e-50 | 1.11e+00 | 0.1327 |
| 493 | ATP2B4 | P8T-E | Human | Esophagus | ESCC | 2.72e-16 | 2.63e-01 | 0.0889 |
| 493 | ATP2B4 | P9T-E | Human | Esophagus | ESCC | 7.13e-11 | 3.88e-01 | 0.1131 |
| Page: 1 2 3 4 5 6 7 |
| Tissue | Expression Dynamics | Abbreviation |
| Cervix | 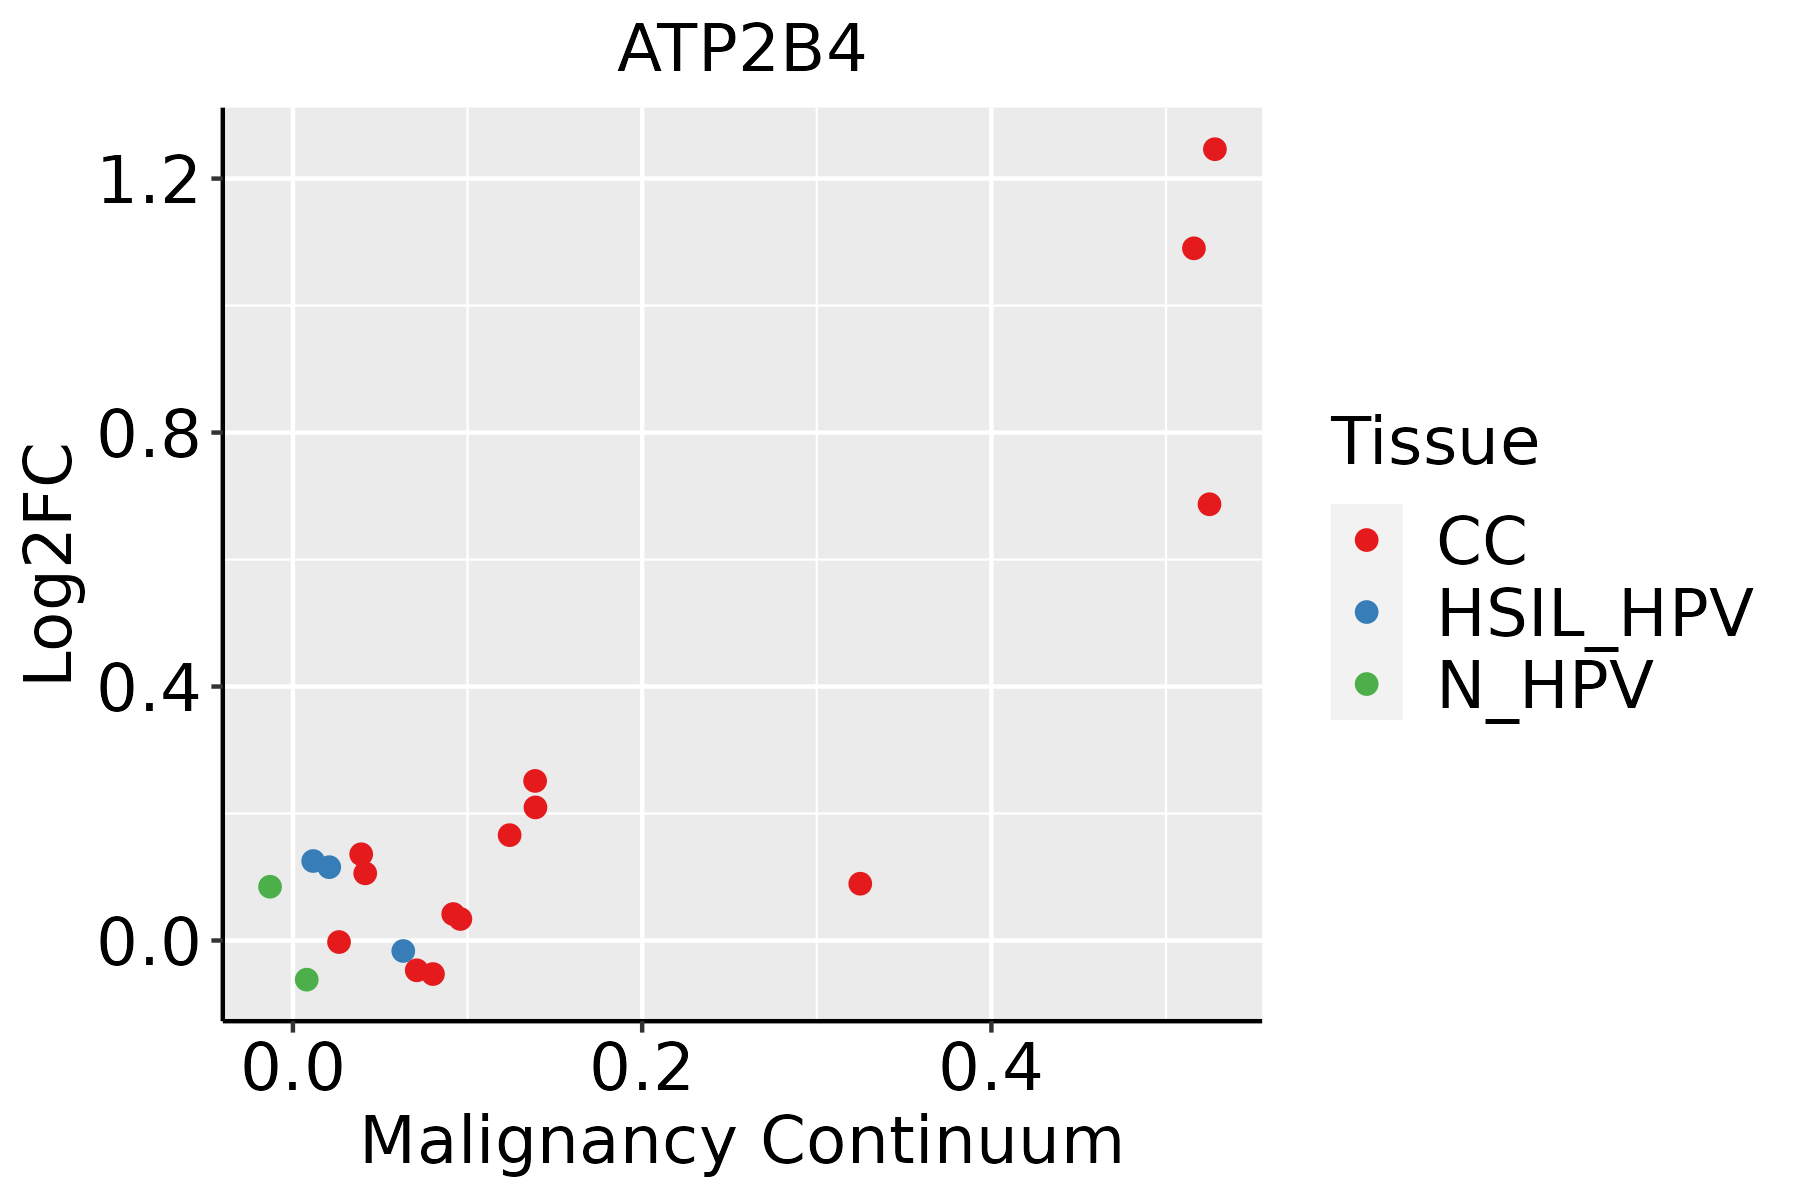 | CC: Cervix cancer |
| HSIL_HPV: HPV-infected high-grade squamous intraepithelial lesions | ||
| N_HPV: HPV-infected normal cervix | ||
| Esophagus | 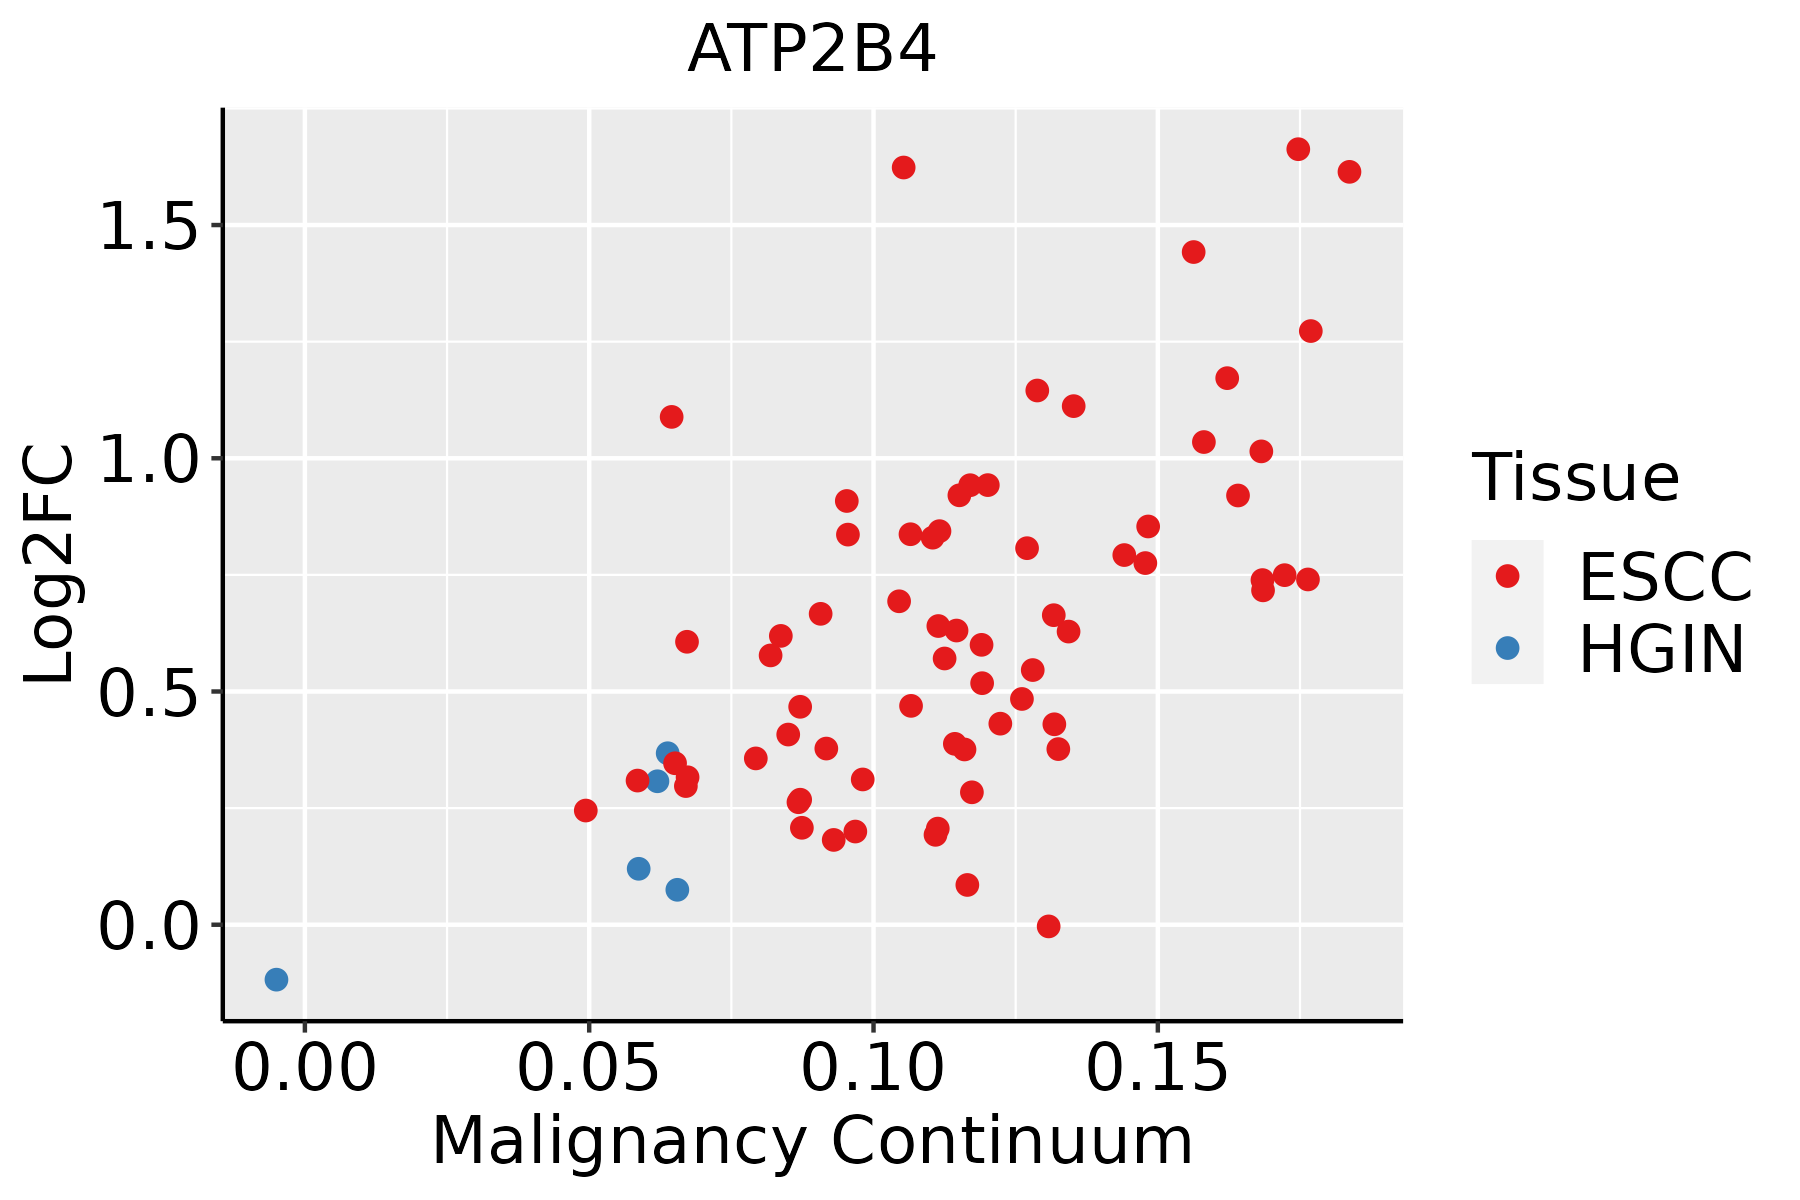 | ESCC: Esophageal squamous cell carcinoma |
| HGIN: High-grade intraepithelial neoplasias | ||
| LGIN: Low-grade intraepithelial neoplasias | ||
| Liver | 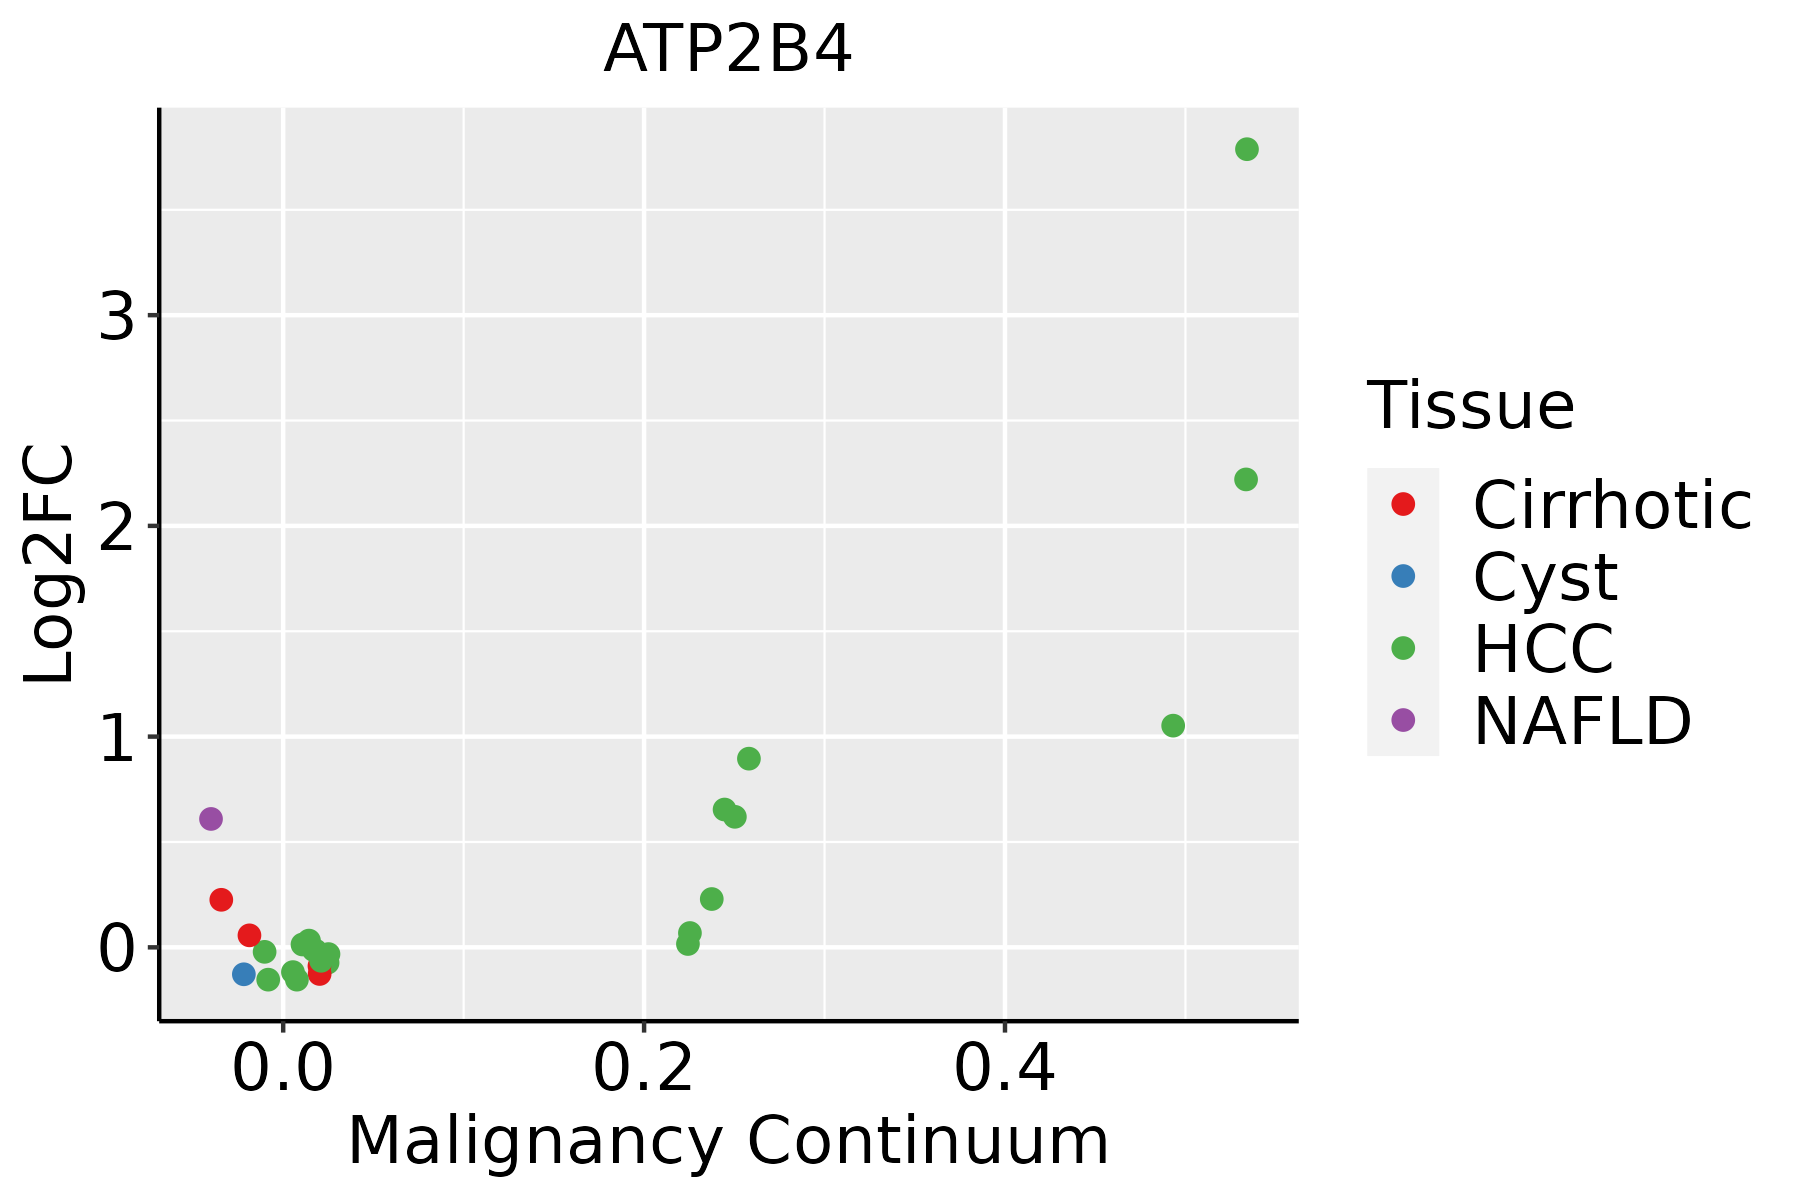 | HCC: Hepatocellular carcinoma |
| NAFLD: Non-alcoholic fatty liver disease | ||
| Oral Cavity | 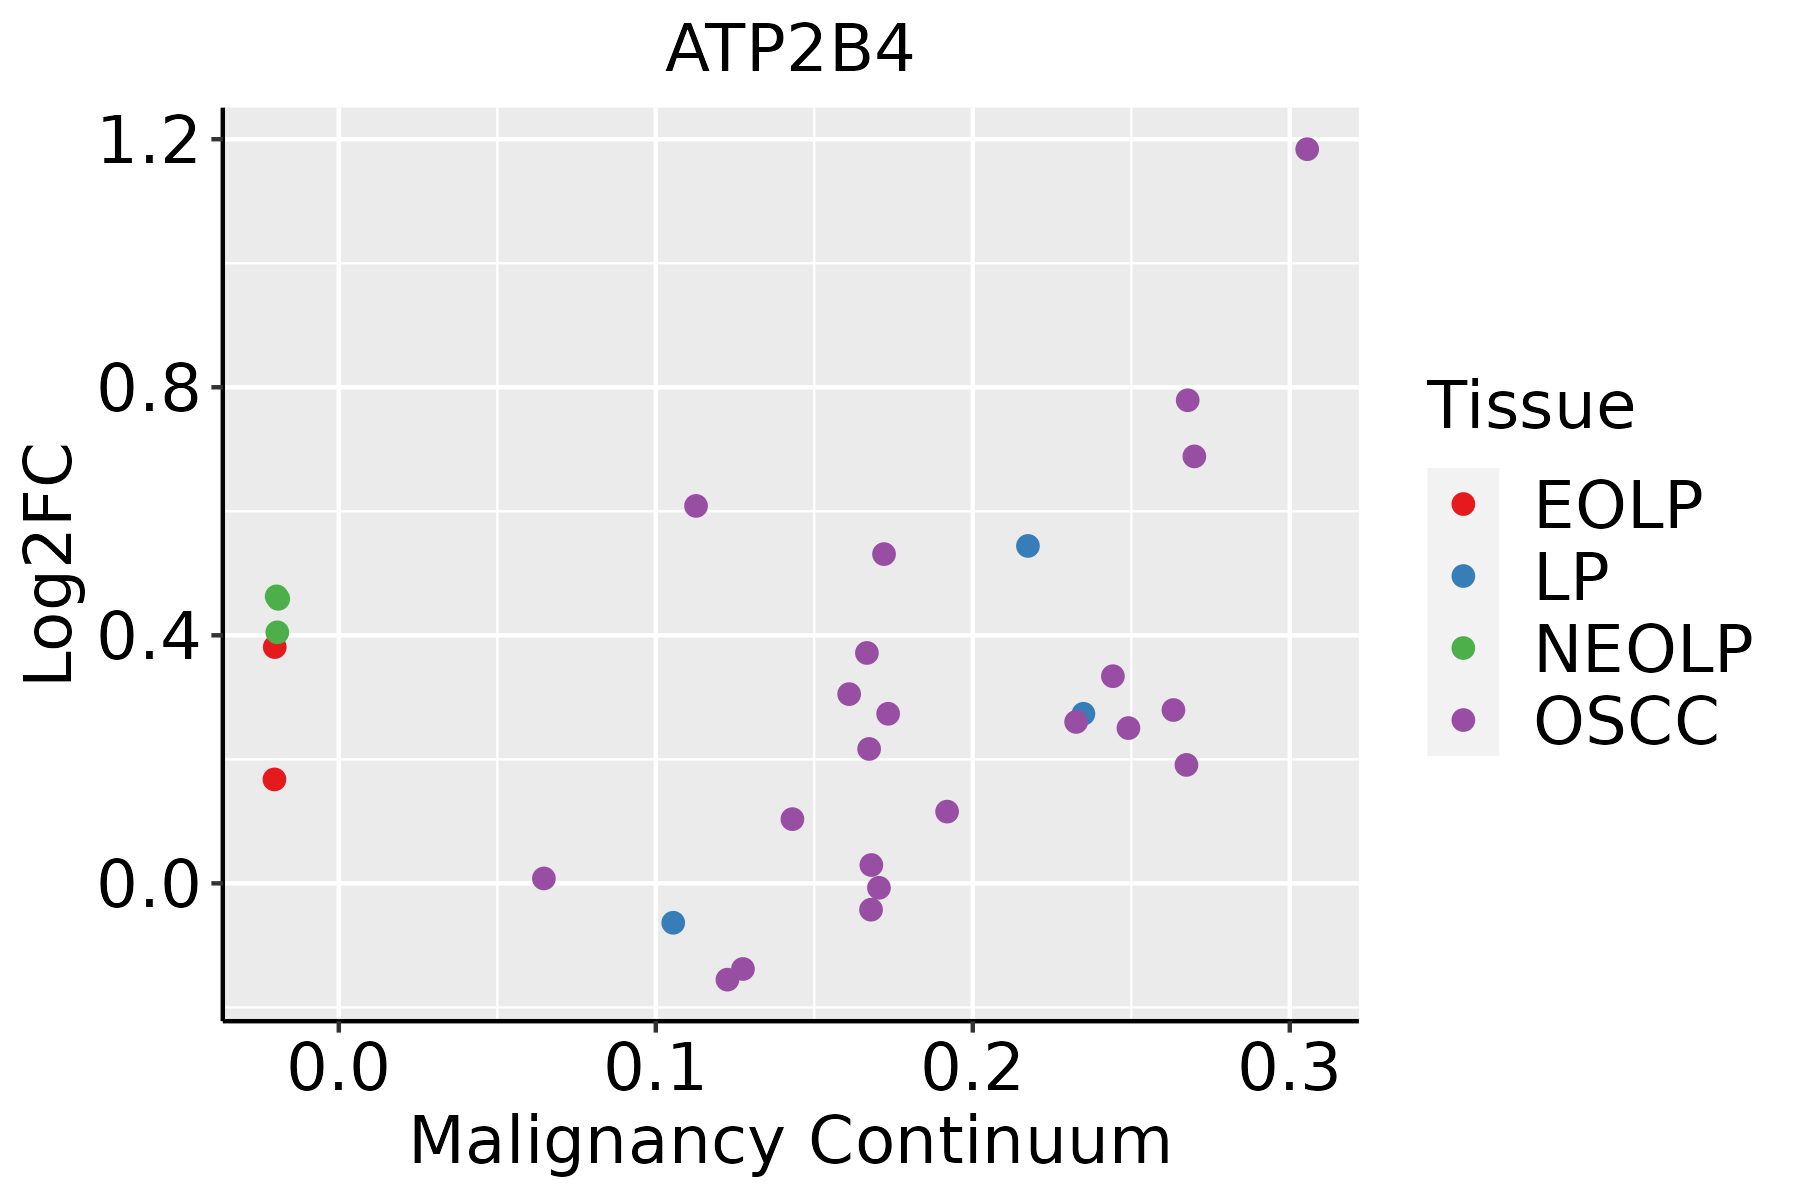 | EOLP: Erosive Oral lichen planus |
| LP: leukoplakia | ||
| NEOLP: Non-erosive oral lichen planus | ||
| OSCC: Oral squamous cell carcinoma | ||
| Prostate |  | BPH: Benign Prostatic Hyperplasia |
| Skin | 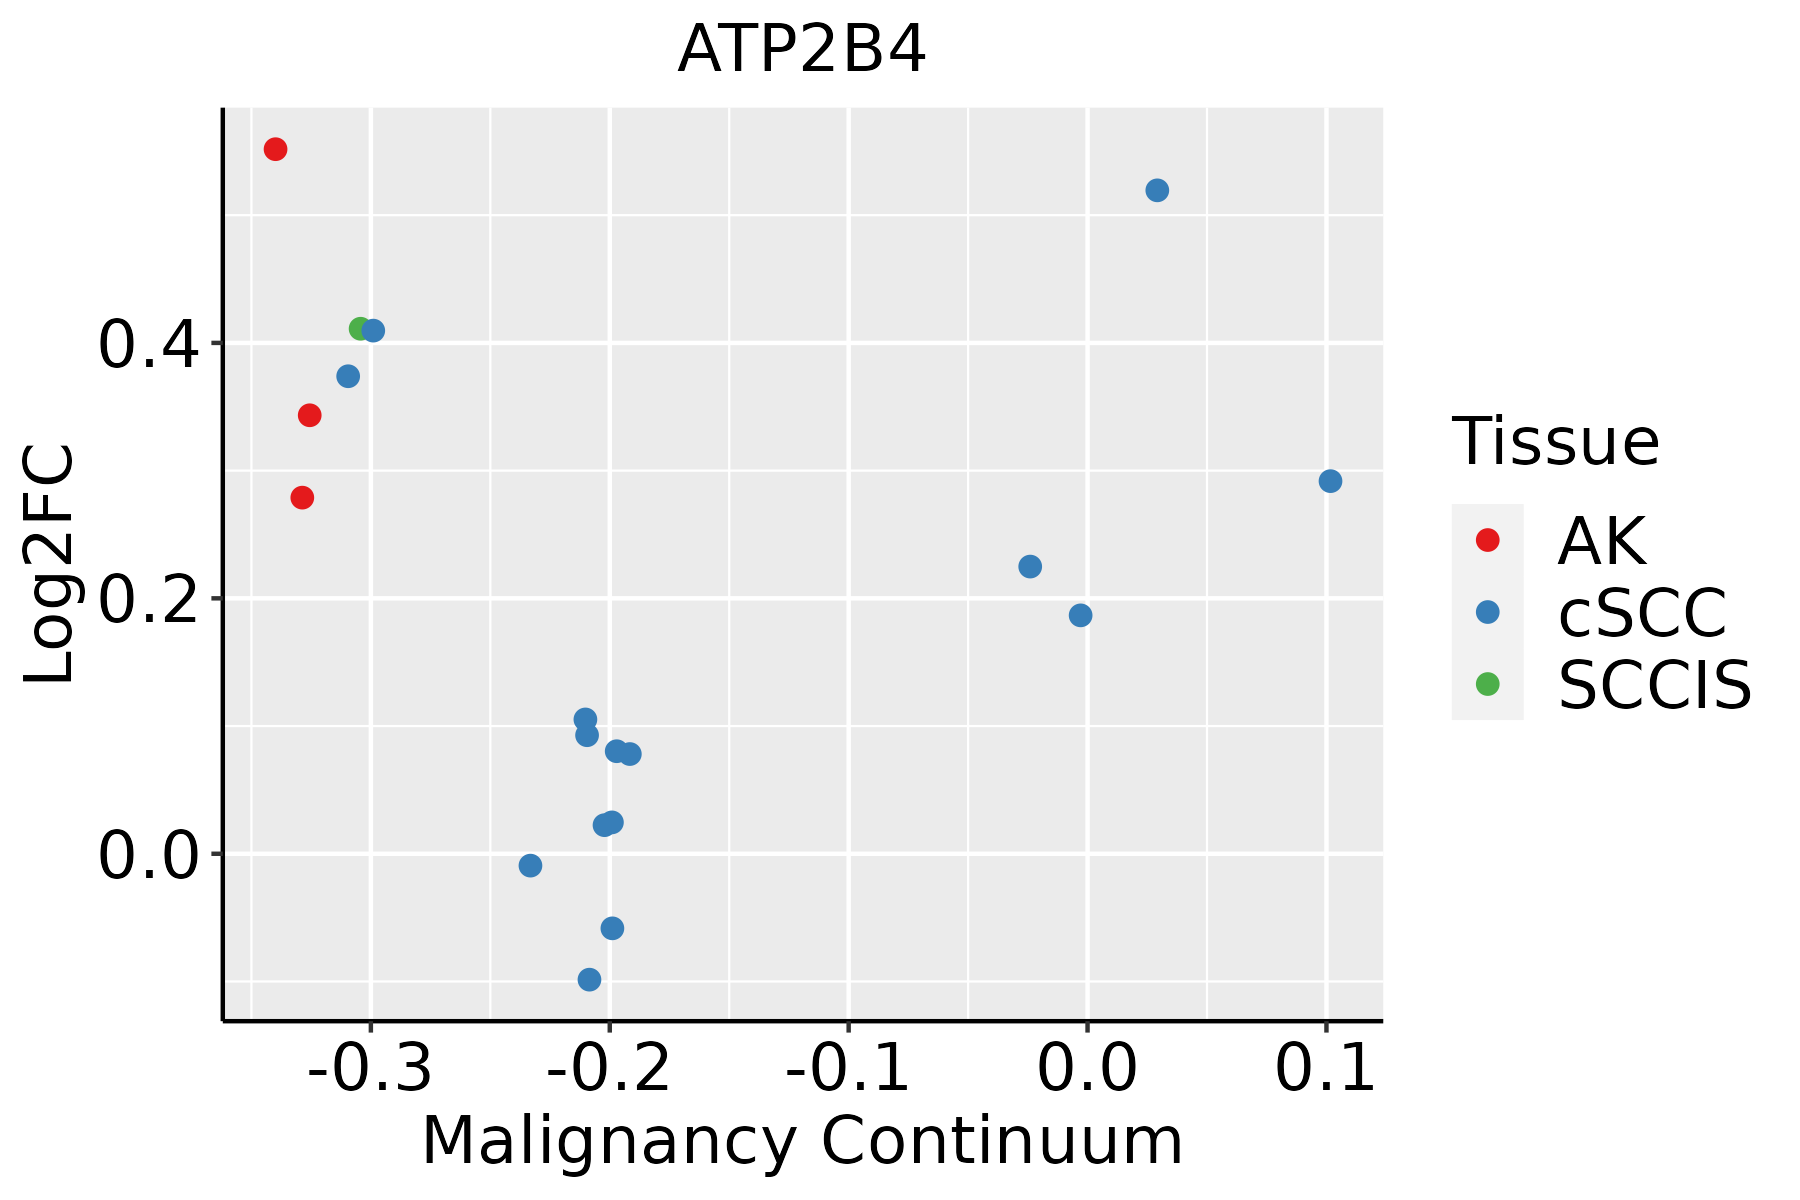 | AK: Actinic keratosis |
| cSCC: Cutaneous squamous cell carcinoma | ||
| SCCIS:squamous cell carcinoma in situ | ||
| Thyroid | 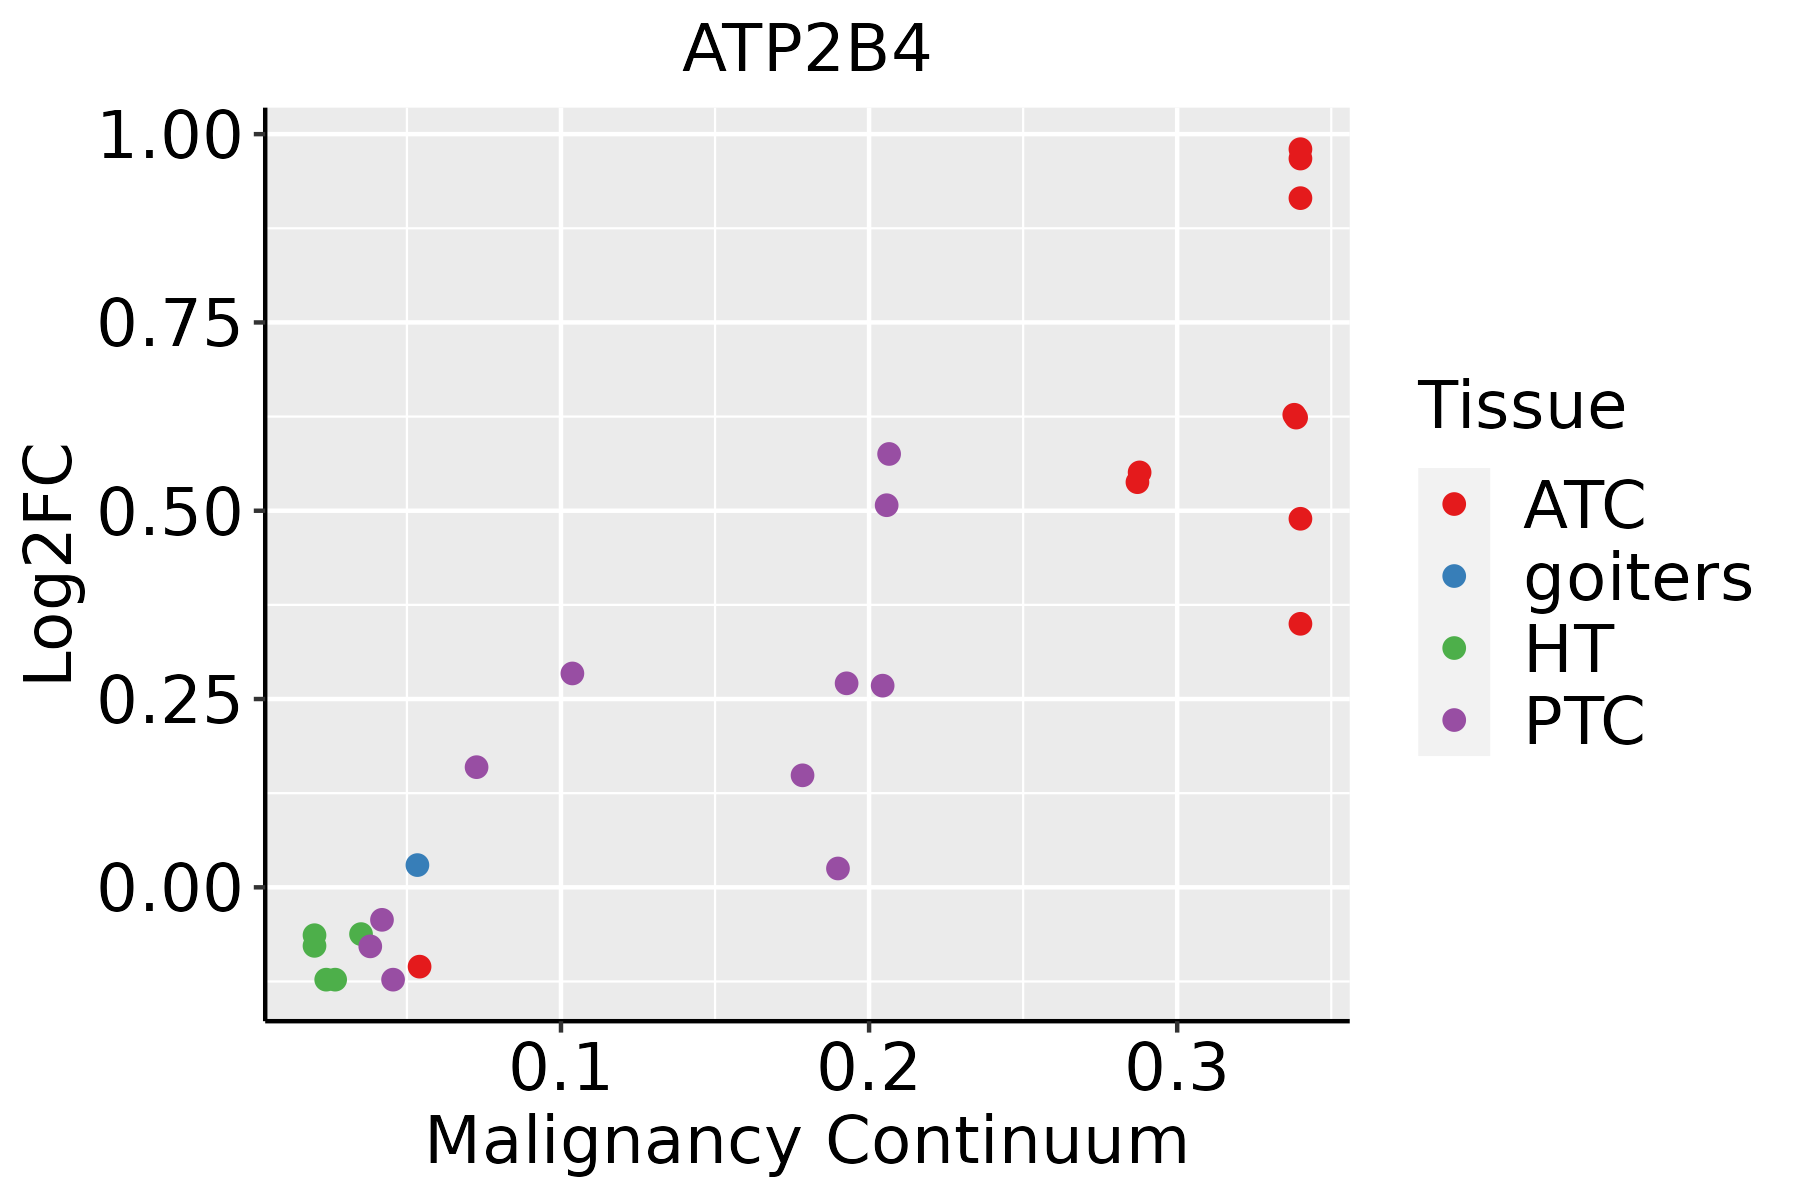 | ATC: Anaplastic thyroid cancer |
| HT: Hashimoto's thyroiditis | ||
| PTC: Papillary thyroid cancer |
| ∗log2FC in expression of this searched gene in stem-like cells from each diseased tissue sample relative to stem-like cells in normal samples in each tissue plotted against the malignancy continuum. Samples are colored based on if they are from different disease stage. |
Top |
Malignant transformation related pathway analysis |
| Find out the enriched GO biological processes and KEGG pathways involved in transition from healthy to precancer to cancer |
| Tissue | Disease Stage | Enriched GO biological Processes |
| Colorectum | AD |  |
| Colorectum | SER |  |
| Colorectum | MSS |  |
| Colorectum | MSI-H |  |
| Colorectum | FAP |  |
| ∗Top 15 enriched GO BP terms are showed in the bar plot of each disease state in each tissue. Each row represents a significant GO biological process which is colored according to the -log10(p.adjust). |
| Page: 1 2 3 4 5 6 7 8 9 |
| GO ID | Tissue | Disease Stage | Description | Gene Ratio | Bg Ratio | pvalue | p.adjust | Count |
| GO:00090632 | Liver | HCC | cellular amino acid catabolic process | 70/7958 | 110/18723 | 6.12e-06 | 7.52e-05 | 70 |
| GO:00448432 | Liver | HCC | cell cycle G1/S phase transition | 134/7958 | 241/18723 | 2.60e-05 | 2.70e-04 | 134 |
| GO:001810511 | Liver | HCC | peptidyl-serine phosphorylation | 169/7958 | 315/18723 | 3.86e-05 | 3.81e-04 | 169 |
| GO:007190021 | Liver | HCC | regulation of protein serine/threonine kinase activity | 189/7958 | 359/18723 | 5.97e-05 | 5.47e-04 | 189 |
| GO:190437712 | Liver | HCC | positive regulation of protein localization to cell periphery | 45/7958 | 69/18723 | 1.16e-04 | 9.80e-04 | 45 |
| GO:000110111 | Liver | HCC | response to acid chemical | 79/7958 | 135/18723 | 1.24e-04 | 1.03e-03 | 79 |
| GO:001820911 | Liver | HCC | peptidyl-serine modification | 177/7958 | 338/18723 | 1.45e-04 | 1.17e-03 | 177 |
| GO:00105652 | Liver | HCC | regulation of cellular ketone metabolic process | 77/7958 | 133/18723 | 2.41e-04 | 1.80e-03 | 77 |
| GO:200105722 | Liver | HCC | reactive nitrogen species metabolic process | 51/7958 | 82/18723 | 2.50e-04 | 1.86e-03 | 51 |
| GO:004620922 | Liver | HCC | nitric oxide metabolic process | 50/7958 | 81/18723 | 3.72e-04 | 2.56e-03 | 50 |
| GO:190307812 | Liver | HCC | positive regulation of protein localization to plasma membrane | 40/7958 | 62/18723 | 3.84e-04 | 2.62e-03 | 40 |
| GO:19016062 | Liver | HCC | alpha-amino acid catabolic process | 53/7958 | 87/18723 | 4.01e-04 | 2.71e-03 | 53 |
| GO:008016422 | Liver | HCC | regulation of nitric oxide metabolic process | 41/7958 | 64/18723 | 4.06e-04 | 2.74e-03 | 41 |
| GO:004542822 | Liver | HCC | regulation of nitric oxide biosynthetic process | 39/7958 | 62/18723 | 9.46e-04 | 5.50e-03 | 39 |
| GO:000680922 | Liver | HCC | nitric oxide biosynthetic process | 46/7958 | 76/18723 | 1.15e-03 | 6.53e-03 | 46 |
| GO:004586021 | Liver | HCC | positive regulation of protein kinase activity | 194/7958 | 386/18723 | 1.16e-03 | 6.54e-03 | 194 |
| GO:0009064 | Liver | HCC | glutamine family amino acid metabolic process | 47/7958 | 78/18723 | 1.17e-03 | 6.54e-03 | 47 |
| GO:1902806 | Liver | HCC | regulation of cell cycle G1/S phase transition | 91/7958 | 168/18723 | 1.47e-03 | 7.79e-03 | 91 |
| GO:003367411 | Liver | HCC | positive regulation of kinase activity | 230/7958 | 467/18723 | 1.72e-03 | 8.95e-03 | 230 |
| GO:015010411 | Liver | HCC | transport across blood-brain barrier | 50/7958 | 87/18723 | 3.42e-03 | 1.55e-02 | 50 |
| Page: 1 2 3 4 5 6 7 8 9 10 11 12 13 14 15 16 17 18 19 20 21 22 23 24 25 26 27 28 29 30 31 32 33 34 |
| Pathway ID | Tissue | Disease Stage | Description | Gene Ratio | Bg Ratio | pvalue | p.adjust | qvalue | Count |
| hsa040224 | Oral cavity | EOLP | cGMP-PKG signaling pathway | 36/1218 | 167/8465 | 7.34e-03 | 2.12e-02 | 1.25e-02 | 36 |
| hsa0402211 | Oral cavity | EOLP | cGMP-PKG signaling pathway | 36/1218 | 167/8465 | 7.34e-03 | 2.12e-02 | 1.25e-02 | 36 |
| hsa0402221 | Oral cavity | NEOLP | cGMP-PKG signaling pathway | 35/1112 | 167/8465 | 3.02e-03 | 1.25e-02 | 7.85e-03 | 35 |
| hsa0402231 | Oral cavity | NEOLP | cGMP-PKG signaling pathway | 35/1112 | 167/8465 | 3.02e-03 | 1.25e-02 | 7.85e-03 | 35 |
| hsa0497814 | Prostate | BPH | Mineral absorption | 20/1718 | 60/8465 | 1.22e-02 | 3.61e-02 | 2.23e-02 | 20 |
| hsa0496112 | Prostate | BPH | Endocrine and other factor-regulated calcium reabsorption | 18/1718 | 53/8465 | 1.39e-02 | 4.05e-02 | 2.51e-02 | 18 |
| hsa0497815 | Prostate | BPH | Mineral absorption | 20/1718 | 60/8465 | 1.22e-02 | 3.61e-02 | 2.23e-02 | 20 |
| hsa0496113 | Prostate | BPH | Endocrine and other factor-regulated calcium reabsorption | 18/1718 | 53/8465 | 1.39e-02 | 4.05e-02 | 2.51e-02 | 18 |
| Page: 1 |
Top |
Cell-cell communication analysis |
| Identification of potential cell-cell interactions between two cell types and their ligand-receptor pairs for different disease states |
| Ligand | Receptor | LRpair | Pathway | Tissue | Disease Stage |
| Page: 1 |
Top |
Single-cell gene regulatory network inference analysis |
| Find out the significant the regulons (TFs) and the target genes of each regulon across cell types for different disease states |
| TF | Cell Type | Tissue | Disease Stage | Target Gene | RSS | Regulon Activity |
| ∗The dot plots of a searched regulon are shown for all cell subpopulations in each disease state of each tissue based on the regulon specific score inferred using pySCENIC and by calculating the average expression. |
| Page: 1 |
Top |
Somatic mutation of malignant transformation related genes |
| Annotation of somatic variants for genes involved in malignant transformation |
| Hugo Symbol | Variant Class | Variant Classification | dbSNP RS | HGVSc | HGVSp | HGVSp Short | SWISSPROT | BIOTYPE | SIFT | PolyPhen | Tumor Sample Barcode | Tissue | Histology | Sex | Age | Stage | Therapy Types | Drugs | Outcome |
| ATP2B4 | SNV | Missense_Mutation | novel | c.2582N>C | p.Gly861Ala | p.G861A | P23634 | protein_coding | deleterious(0) | probably_damaging(0.993) | TCGA-5L-AAT1-01 | Breast | breast invasive carcinoma | Female | <65 | III/IV | Hormone Therapy | letrozol | SD |
| ATP2B4 | SNV | Missense_Mutation | novel | c.1003N>A | p.Glu335Lys | p.E335K | P23634 | protein_coding | tolerated(0.1) | benign(0.093) | TCGA-A2-A0YK-01 | Breast | breast invasive carcinoma | Female | <65 | I/II | Chemotherapy | cytoxan | SD |
| ATP2B4 | SNV | Missense_Mutation | c.587G>C | p.Gly196Ala | p.G196A | P23634 | protein_coding | deleterious(0.04) | possibly_damaging(0.682) | TCGA-AC-A23H-01 | Breast | breast invasive carcinoma | Female | >=65 | I/II | Unknown | Unknown | PD | |
| ATP2B4 | SNV | Missense_Mutation | c.691G>A | p.Asp231Asn | p.D231N | P23634 | protein_coding | tolerated(0.08) | possibly_damaging(0.763) | TCGA-AC-A23H-01 | Breast | breast invasive carcinoma | Female | >=65 | I/II | Unknown | Unknown | PD | |
| ATP2B4 | SNV | Missense_Mutation | c.922G>A | p.Glu308Lys | p.E308K | P23634 | protein_coding | tolerated(0.37) | benign(0.105) | TCGA-AC-A23H-01 | Breast | breast invasive carcinoma | Female | >=65 | I/II | Unknown | Unknown | PD | |
| ATP2B4 | SNV | Missense_Mutation | novel | c.2966N>T | p.Ser989Leu | p.S989L | P23634 | protein_coding | deleterious(0.03) | benign(0.116) | TCGA-AC-A5XS-01 | Breast | breast invasive carcinoma | Female | >=65 | I/II | Hormone Therapy | femara | SD |
| ATP2B4 | SNV | Missense_Mutation | rs373440876 | c.2506N>A | p.Val836Ile | p.V836I | P23634 | protein_coding | deleterious(0.03) | possibly_damaging(0.845) | TCGA-C8-A8HQ-01 | Breast | breast invasive carcinoma | Female | <65 | I/II | Unknown | Unknown | SD |
| ATP2B4 | SNV | Missense_Mutation | c.2644N>G | p.Met882Val | p.M882V | P23634 | protein_coding | deleterious(0) | probably_damaging(0.976) | TCGA-D8-A1XK-01 | Breast | breast invasive carcinoma | Female | <65 | I/II | Chemotherapy | doxorubicine+cyclophosphamide | SD | |
| ATP2B4 | SNV | Missense_Mutation | c.2023N>T | p.Arg675Cys | p.R675C | P23634 | protein_coding | deleterious(0) | probably_damaging(1) | TCGA-E9-A1R7-01 | Breast | breast invasive carcinoma | Female | <65 | I/II | Hormone Therapy | fareston | SD | |
| ATP2B4 | SNV | Missense_Mutation | rs762956558 | c.1592T>G | p.Val531Gly | p.V531G | P23634 | protein_coding | deleterious(0) | possibly_damaging(0.732) | TCGA-EW-A1PH-01 | Breast | breast invasive carcinoma | Female | <65 | I/II | Chemotherapy | cyclophosphamide | SD |
| Page: 1 2 3 4 5 6 7 8 9 10 11 12 13 |
Top |
Related drugs of malignant transformation related genes |
| Identification of chemicals and drugs interact with genes involved in malignant transfromation |
| (DGIdb 4.0) |
| Entrez ID | Symbol | Category | Interaction Types | Drug Claim Name | Drug Name | PMIDs |
| Page: 1 |

Copyright 2023-Present -The University of Texas Health Science Center at Houston |