
|
|||||
|
 | |
| |
| |
| |
| |
| |
|
Gene: AP3S1 |
Gene summary for AP3S1 |
| Gene information | Species | Human | Gene symbol | AP3S1 | Gene ID | 1176 |
| Gene name | adaptor related protein complex 3 subunit sigma 1 | |
| Gene Alias | CLAPS3 | |
| Cytomap | 5q22.3-q23.1 | |
| Gene Type | protein-coding | GO ID | GO:0006810 | UniProtAcc | Q92572 |
Top |
Malignant transformation analysis |
| Identification of the aberrant gene expression in precancerous and cancerous lesions by comparing the gene expression of stem-like cells in diseased tissues with normal stem cells |
| Entrez ID | Symbol | Replicates | Species | Organ | Tissue | Adj P-value | Log2FC | Malignancy |
| 1176 | AP3S1 | AEH-subject1 | Human | Endometrium | AEH | 4.24e-09 | -2.63e-01 | -0.3059 |
| 1176 | AP3S1 | AEH-subject2 | Human | Endometrium | AEH | 4.96e-03 | -2.63e-01 | -0.2525 |
| 1176 | AP3S1 | AEH-subject3 | Human | Endometrium | AEH | 7.59e-11 | -2.86e-01 | -0.2576 |
| 1176 | AP3S1 | AEH-subject5 | Human | Endometrium | AEH | 5.69e-05 | -2.48e-01 | -0.2953 |
| 1176 | AP3S1 | EEC-subject1 | Human | Endometrium | EEC | 1.11e-07 | -2.44e-01 | -0.2682 |
| 1176 | AP3S1 | EEC-subject2 | Human | Endometrium | EEC | 1.94e-16 | -3.35e-01 | -0.2607 |
| 1176 | AP3S1 | EEC-subject3 | Human | Endometrium | EEC | 5.69e-28 | -4.10e-01 | -0.2525 |
| 1176 | AP3S1 | EEC-subject4 | Human | Endometrium | EEC | 2.10e-09 | -2.83e-01 | -0.2571 |
| 1176 | AP3S1 | EEC-subject5 | Human | Endometrium | EEC | 2.34e-06 | -2.65e-01 | -0.249 |
| 1176 | AP3S1 | GSM5276934 | Human | Endometrium | EEC | 3.35e-04 | -2.01e-01 | -0.0913 |
| 1176 | AP3S1 | GSM6177620_NYU_UCEC1_lib1_lib1 | Human | Endometrium | EEC | 1.04e-22 | -1.52e-01 | -0.1869 |
| 1176 | AP3S1 | GSM6177620_NYU_UCEC1_lib2_lib2 | Human | Endometrium | EEC | 3.45e-22 | -1.82e-01 | -0.1875 |
| 1176 | AP3S1 | GSM6177620_NYU_UCEC1_lib3_lib3 | Human | Endometrium | EEC | 4.37e-29 | -1.26e-01 | -0.1883 |
| 1176 | AP3S1 | GSM6177621_NYU_UCEC2_lib1_lib1 | Human | Endometrium | EEC | 1.20e-34 | -2.54e-01 | -0.1934 |
| 1176 | AP3S1 | GSM6177622_NYU_UCEC3_lib1_lib1 | Human | Endometrium | EEC | 1.59e-54 | -8.71e-02 | -0.1917 |
| 1176 | AP3S1 | GSM6177622_NYU_UCEC3_lib2_lib2 | Human | Endometrium | EEC | 1.24e-34 | -1.05e-01 | -0.1916 |
| 1176 | AP3S1 | GSM6177623_NYU_UCEC3_Vis | Human | Endometrium | EEC | 1.62e-09 | -1.91e-01 | -0.1269 |
| 1176 | AP3S1 | LZE4T | Human | Esophagus | ESCC | 5.02e-11 | 3.33e-01 | 0.0811 |
| 1176 | AP3S1 | LZE5T | Human | Esophagus | ESCC | 3.63e-05 | 2.87e-01 | 0.0514 |
| 1176 | AP3S1 | LZE7T | Human | Esophagus | ESCC | 4.66e-06 | 1.94e-01 | 0.0667 |
| Page: 1 2 3 4 5 6 7 8 |
| Tissue | Expression Dynamics | Abbreviation |
| Endometrium | 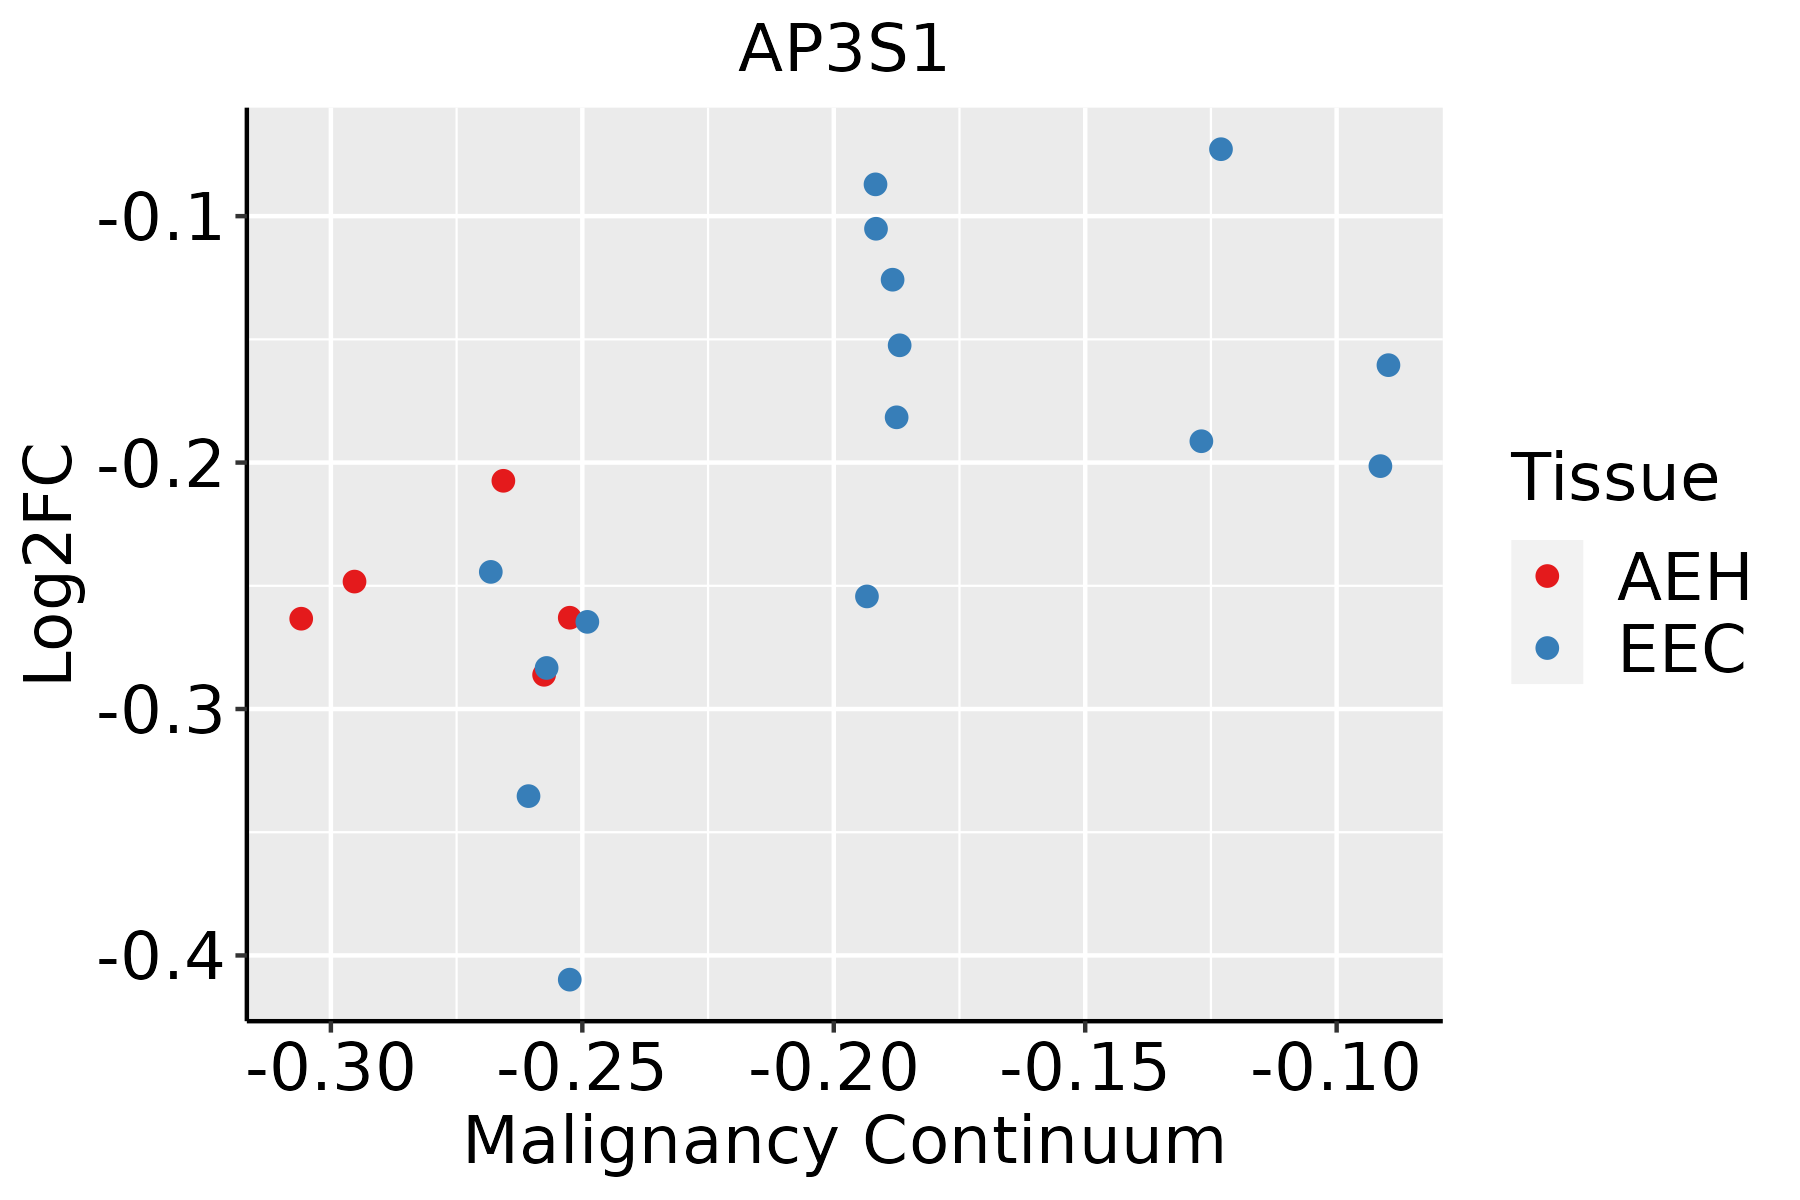 | AEH: Atypical endometrial hyperplasia |
| EEC: Endometrioid Cancer | ||
| Esophagus |  | ESCC: Esophageal squamous cell carcinoma |
| HGIN: High-grade intraepithelial neoplasias | ||
| LGIN: Low-grade intraepithelial neoplasias | ||
| Liver |  | HCC: Hepatocellular carcinoma |
| NAFLD: Non-alcoholic fatty liver disease | ||
| Oral Cavity | 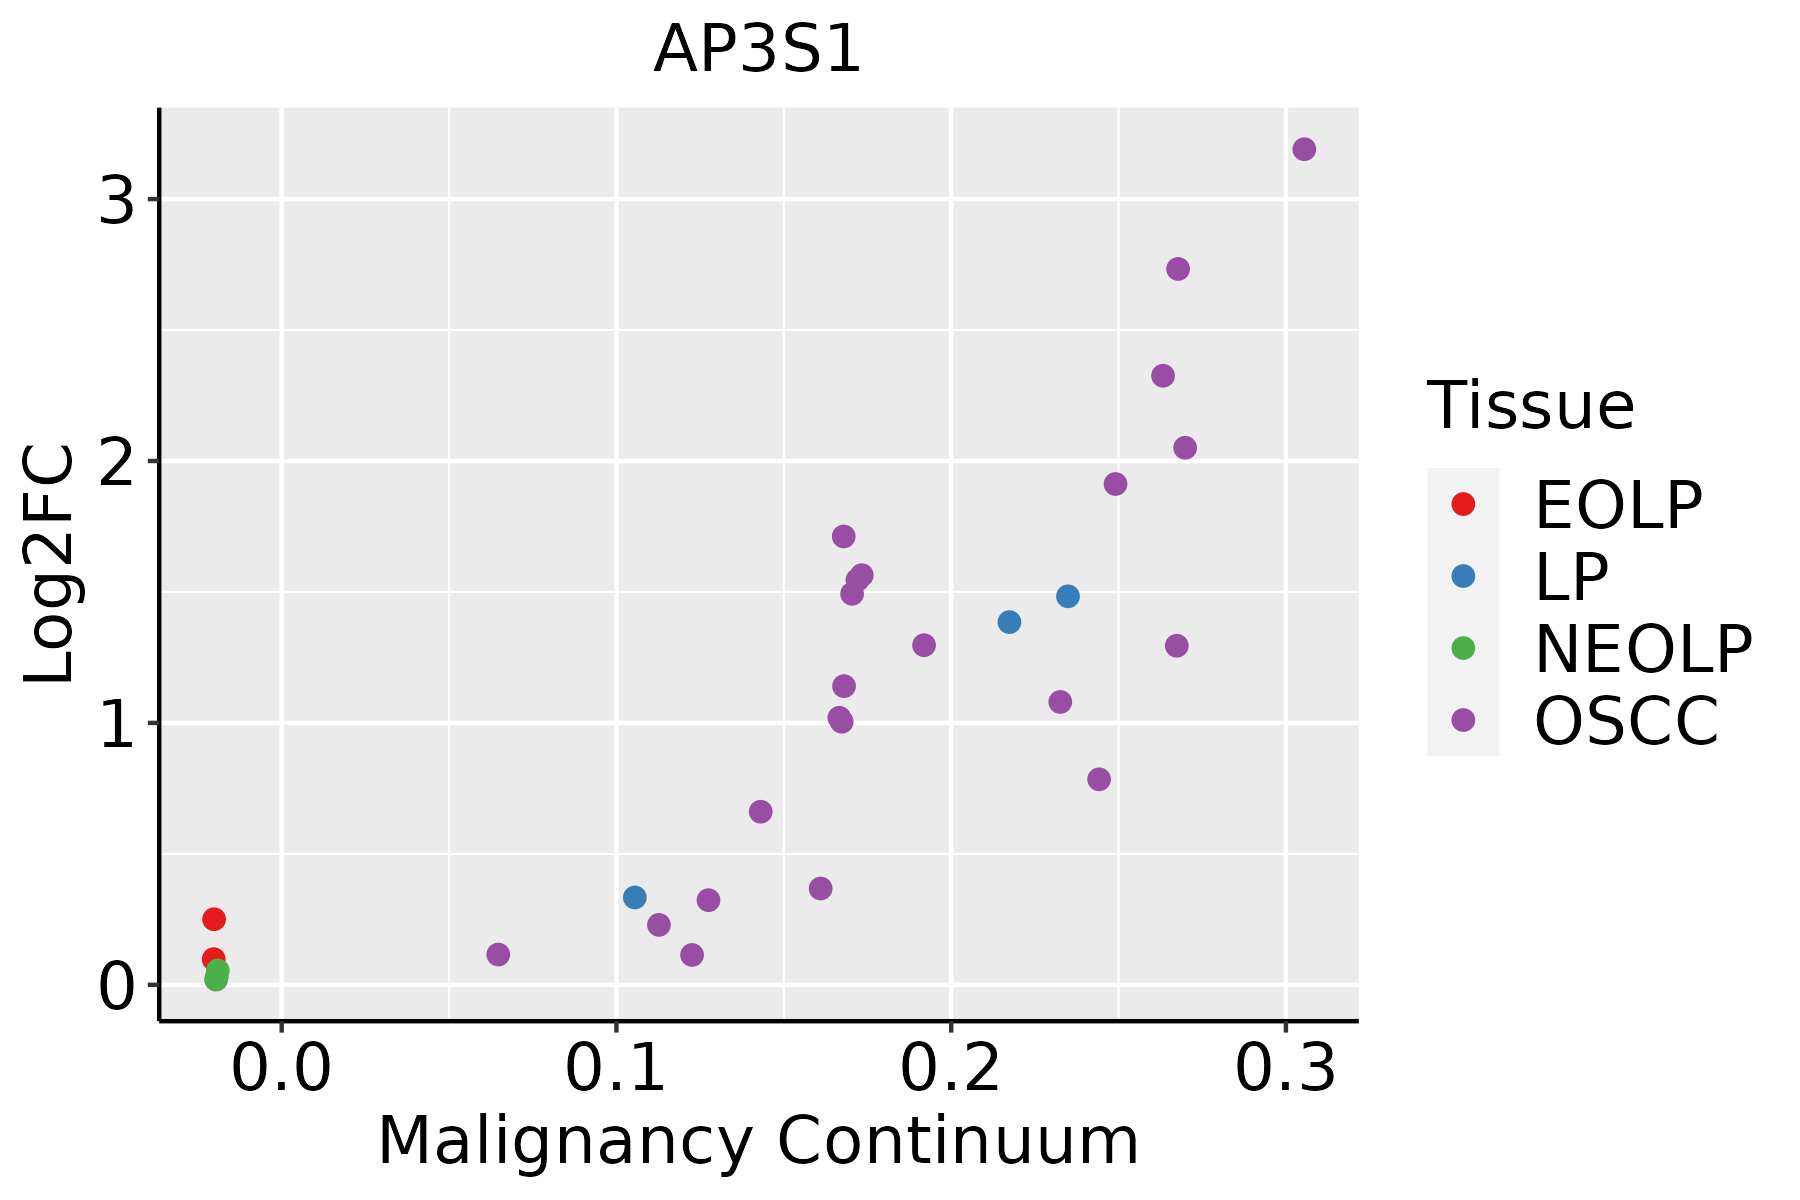 | EOLP: Erosive Oral lichen planus |
| LP: leukoplakia | ||
| NEOLP: Non-erosive oral lichen planus | ||
| OSCC: Oral squamous cell carcinoma | ||
| Skin | 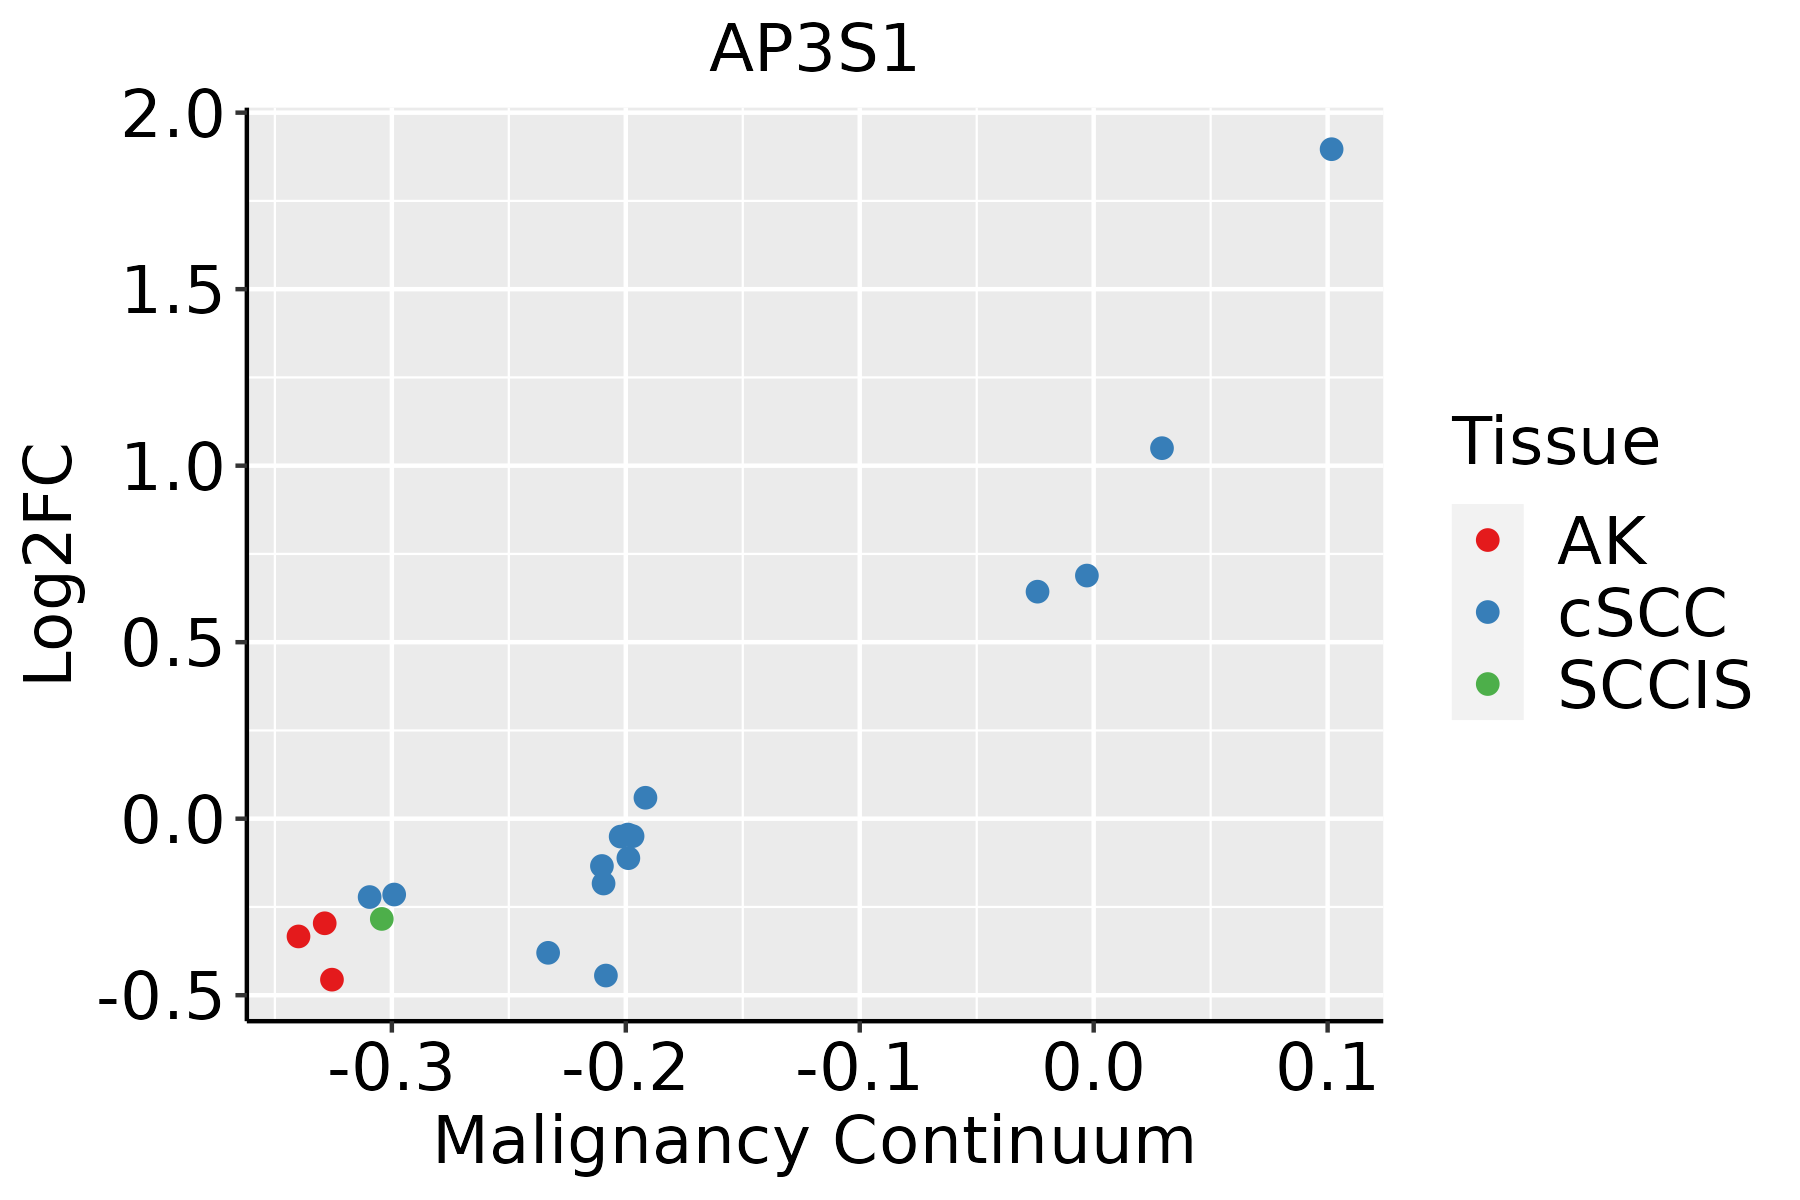 | AK: Actinic keratosis |
| cSCC: Cutaneous squamous cell carcinoma | ||
| SCCIS:squamous cell carcinoma in situ | ||
| Thyroid |  | ATC: Anaplastic thyroid cancer |
| HT: Hashimoto's thyroiditis | ||
| PTC: Papillary thyroid cancer |
| ∗log2FC in expression of this searched gene in stem-like cells from each diseased tissue sample relative to stem-like cells in normal samples in each tissue plotted against the malignancy continuum. Samples are colored based on if they are from different disease stage. |
Top |
Malignant transformation related pathway analysis |
| Find out the enriched GO biological processes and KEGG pathways involved in transition from healthy to precancer to cancer |
| Tissue | Disease Stage | Enriched GO biological Processes |
| Colorectum | AD |  |
| Colorectum | SER |  |
| Colorectum | MSS |  |
| Colorectum | MSI-H |  |
| Colorectum | FAP |  |
| ∗Top 15 enriched GO BP terms are showed in the bar plot of each disease state in each tissue. Each row represents a significant GO biological process which is colored according to the -log10(p.adjust). |
| Page: 1 2 3 4 5 6 7 8 9 |
| GO ID | Tissue | Disease Stage | Description | Gene Ratio | Bg Ratio | pvalue | p.adjust | Count |
| GO:00474963 | Thyroid | PTC | vesicle transport along microtubule | 24/5968 | 47/18723 | 4.79e-03 | 2.24e-02 | 24 |
| GO:0048193111 | Thyroid | ATC | Golgi vesicle transport | 189/6293 | 296/18723 | 9.58e-27 | 5.05e-24 | 189 |
| GO:005165625 | Thyroid | ATC | establishment of organelle localization | 206/6293 | 390/18723 | 2.62e-15 | 1.84e-13 | 206 |
| GO:000689219 | Thyroid | ATC | post-Golgi vesicle-mediated transport | 68/6293 | 104/18723 | 3.30e-11 | 1.10e-09 | 68 |
| GO:000703423 | Thyroid | ATC | vacuolar transport | 89/6293 | 157/18723 | 2.26e-09 | 5.40e-08 | 89 |
| GO:003070532 | Thyroid | ATC | cytoskeleton-dependent intracellular transport | 105/6293 | 195/18723 | 4.31e-09 | 9.70e-08 | 105 |
| GO:190165325 | Thyroid | ATC | cellular response to peptide | 173/6293 | 359/18723 | 5.87e-09 | 1.28e-07 | 173 |
| GO:004343428 | Thyroid | ATC | response to peptide hormone | 192/6293 | 414/18723 | 3.63e-08 | 6.70e-07 | 192 |
| GO:0051650110 | Thyroid | ATC | establishment of vesicle localization | 87/6293 | 161/18723 | 7.16e-08 | 1.25e-06 | 87 |
| GO:001097022 | Thyroid | ATC | transport along microtubule | 83/6293 | 155/18723 | 2.38e-07 | 3.70e-06 | 83 |
| GO:007137524 | Thyroid | ATC | cellular response to peptide hormone stimulus | 138/6293 | 290/18723 | 4.90e-07 | 7.05e-06 | 138 |
| GO:005164818 | Thyroid | ATC | vesicle localization | 91/6293 | 177/18723 | 7.21e-07 | 9.64e-06 | 91 |
| GO:003286824 | Thyroid | ATC | response to insulin | 126/6293 | 264/18723 | 1.24e-06 | 1.59e-05 | 126 |
| GO:003286923 | Thyroid | ATC | cellular response to insulin stimulus | 101/6293 | 203/18723 | 1.34e-06 | 1.69e-05 | 101 |
| GO:007238413 | Thyroid | ATC | organelle transport along microtubule | 48/6293 | 85/18723 | 1.23e-05 | 1.18e-04 | 48 |
| GO:009911112 | Thyroid | ATC | microtubule-based transport | 91/6293 | 190/18723 | 2.97e-05 | 2.48e-04 | 91 |
| GO:000828618 | Thyroid | ATC | insulin receptor signaling pathway | 60/6293 | 116/18723 | 4.20e-05 | 3.40e-04 | 60 |
| GO:000808822 | Thyroid | ATC | axo-dendritic transport | 42/6293 | 75/18723 | 5.50e-05 | 4.24e-04 | 42 |
| GO:009893012 | Thyroid | ATC | axonal transport | 36/6293 | 64/18723 | 1.62e-04 | 1.11e-03 | 36 |
| GO:00080893 | Thyroid | ATC | anterograde axonal transport | 26/6293 | 50/18723 | 5.51e-03 | 2.24e-02 | 26 |
| Page: 1 2 3 4 5 6 7 8 9 10 11 |
| Pathway ID | Tissue | Disease Stage | Description | Gene Ratio | Bg Ratio | pvalue | p.adjust | qvalue | Count |
| hsa0414222 | Esophagus | ESCC | Lysosome | 102/4205 | 132/8465 | 5.11e-11 | 7.13e-10 | 3.65e-10 | 102 |
| hsa0414232 | Esophagus | ESCC | Lysosome | 102/4205 | 132/8465 | 5.11e-11 | 7.13e-10 | 3.65e-10 | 102 |
| hsa041424 | Liver | Cirrhotic | Lysosome | 68/2530 | 132/8465 | 1.34e-07 | 1.97e-06 | 1.21e-06 | 68 |
| hsa0414211 | Liver | Cirrhotic | Lysosome | 68/2530 | 132/8465 | 1.34e-07 | 1.97e-06 | 1.21e-06 | 68 |
| hsa041422 | Liver | HCC | Lysosome | 100/4020 | 132/8465 | 2.32e-11 | 4.31e-10 | 2.40e-10 | 100 |
| hsa041423 | Liver | HCC | Lysosome | 100/4020 | 132/8465 | 2.32e-11 | 4.31e-10 | 2.40e-10 | 100 |
| hsa041425 | Oral cavity | OSCC | Lysosome | 87/3704 | 132/8465 | 1.97e-07 | 1.35e-06 | 6.86e-07 | 87 |
| hsa0414212 | Oral cavity | OSCC | Lysosome | 87/3704 | 132/8465 | 1.97e-07 | 1.35e-06 | 6.86e-07 | 87 |
| hsa0414221 | Oral cavity | LP | Lysosome | 67/2418 | 132/8465 | 5.13e-08 | 7.77e-07 | 5.01e-07 | 67 |
| hsa0414231 | Oral cavity | LP | Lysosome | 67/2418 | 132/8465 | 5.13e-08 | 7.77e-07 | 5.01e-07 | 67 |
| Page: 1 |
Top |
Cell-cell communication analysis |
| Identification of potential cell-cell interactions between two cell types and their ligand-receptor pairs for different disease states |
| Ligand | Receptor | LRpair | Pathway | Tissue | Disease Stage |
| Page: 1 |
Top |
Single-cell gene regulatory network inference analysis |
| Find out the significant the regulons (TFs) and the target genes of each regulon across cell types for different disease states |
| TF | Cell Type | Tissue | Disease Stage | Target Gene | RSS | Regulon Activity |
| ∗The dot plots of a searched regulon are shown for all cell subpopulations in each disease state of each tissue based on the regulon specific score inferred using pySCENIC and by calculating the average expression. |
| Page: 1 |
Top |
Somatic mutation of malignant transformation related genes |
| Annotation of somatic variants for genes involved in malignant transformation |
| Hugo Symbol | Variant Class | Variant Classification | dbSNP RS | HGVSc | HGVSp | HGVSp Short | SWISSPROT | BIOTYPE | SIFT | PolyPhen | Tumor Sample Barcode | Tissue | Histology | Sex | Age | Stage | Therapy Types | Drugs | Outcome |
| AP3S1 | SNV | Missense_Mutation | c.467N>A | p.Gly156Glu | p.G156E | Q92572 | protein_coding | tolerated(0.26) | benign(0.044) | TCGA-BH-A18P-01 | Breast | breast invasive carcinoma | Female | <65 | I/II | Unknown | Unknown | PD | |
| AP3S1 | SNV | Missense_Mutation | c.327N>C | p.Leu109Phe | p.L109F | Q92572 | protein_coding | deleterious(0.01) | probably_damaging(0.996) | TCGA-DR-A0ZM-01 | Cervix | cervical & endocervical cancer | Female | <65 | III/IV | Unspecific | Cisplatin | SD | |
| AP3S1 | SNV | Missense_Mutation | c.572C>A | p.Ser191Tyr | p.S191Y | Q92572 | protein_coding | deleterious_low_confidence(0.01) | benign(0.003) | TCGA-CA-6718-01 | Colorectum | colon adenocarcinoma | Male | <65 | I/II | Unknown | Unknown | PD | |
| AP3S1 | SNV | Missense_Mutation | rs200347946 | c.34G>A | p.Gly12Arg | p.G12R | Q92572 | protein_coding | deleterious(0.03) | possibly_damaging(0.873) | TCGA-CM-5868-01 | Colorectum | colon adenocarcinoma | Female | <65 | I/II | Chemotherapy | fluorouracil | SD |
| AP3S1 | SNV | Missense_Mutation | c.125G>T | p.Arg42Ile | p.R42I | Q92572 | protein_coding | deleterious(0) | probably_damaging(0.995) | TCGA-AG-A002-01 | Colorectum | rectum adenocarcinoma | Male | <65 | I/II | Unknown | Unknown | SD | |
| AP3S1 | SNV | Missense_Mutation | novel | c.137N>C | p.Val46Ala | p.V46A | Q92572 | protein_coding | tolerated(0.15) | benign(0.034) | TCGA-F5-6814-01 | Colorectum | rectum adenocarcinoma | Male | <65 | I/II | Unknown | Unknown | SD |
| AP3S1 | SNV | Missense_Mutation | novel | c.115N>A | p.Val39Ile | p.V39I | Q92572 | protein_coding | tolerated(0.18) | possibly_damaging(0.576) | TCGA-A5-A0G1-01 | Endometrium | uterine corpus endometrioid carcinoma | Female | >=65 | I/II | Unknown | Unknown | SD |
| AP3S1 | SNV | Missense_Mutation | novel | c.208N>C | p.Thr70Pro | p.T70P | Q92572 | protein_coding | deleterious(0) | possibly_damaging(0.651) | TCGA-A5-A0G1-01 | Endometrium | uterine corpus endometrioid carcinoma | Female | >=65 | I/II | Unknown | Unknown | SD |
| AP3S1 | SNV | Missense_Mutation | novel | c.119N>A | p.Ser40Tyr | p.S40Y | Q92572 | protein_coding | deleterious(0) | probably_damaging(0.958) | TCGA-A5-A2K5-01 | Endometrium | uterine corpus endometrioid carcinoma | Female | >=65 | I/II | Unknown | Unknown | SD |
| AP3S1 | SNV | Missense_Mutation | c.209N>T | p.Thr70Met | p.T70M | Q92572 | protein_coding | deleterious(0.02) | probably_damaging(0.997) | TCGA-AP-A059-01 | Endometrium | uterine corpus endometrioid carcinoma | Female | >=65 | I/II | Unknown | Unknown | SD |
| Page: 1 2 3 |
Top |
Related drugs of malignant transformation related genes |
| Identification of chemicals and drugs interact with genes involved in malignant transfromation |
| (DGIdb 4.0) |
| Entrez ID | Symbol | Category | Interaction Types | Drug Claim Name | Drug Name | PMIDs |
| Page: 1 |

Copyright 2023-Present -The University of Texas Health Science Center at Houston |