
|
|||||
|
 | |
| |
| |
| |
| |
| |
|
Gene: ADK |
Gene summary for ADK |
| Gene information | Species | Human | Gene symbol | ADK | Gene ID | 132 |
| Gene name | adenosine kinase | |
| Gene Alias | AK | |
| Cytomap | 10q22.2 | |
| Gene Type | protein-coding | GO ID | GO:0006139 | UniProtAcc | A0A140VJE0 |
Top |
Malignant transformation analysis |
| Identification of the aberrant gene expression in precancerous and cancerous lesions by comparing the gene expression of stem-like cells in diseased tissues with normal stem cells |
| Entrez ID | Symbol | Replicates | Species | Organ | Tissue | Adj P-value | Log2FC | Malignancy |
| 132 | ADK | CA_HPV_3 | Human | Cervix | CC | 5.40e-04 | 2.11e-01 | 0.0414 |
| 132 | ADK | CCI_1 | Human | Cervix | CC | 3.51e-19 | 1.46e+00 | 0.528 |
| 132 | ADK | CCI_2 | Human | Cervix | CC | 7.20e-19 | 2.21e+00 | 0.5249 |
| 132 | ADK | CCI_3 | Human | Cervix | CC | 4.17e-15 | 1.06e+00 | 0.516 |
| 132 | ADK | sample3 | Human | Cervix | CC | 1.35e-02 | 1.59e-01 | 0.1387 |
| 132 | ADK | T3 | Human | Cervix | CC | 1.17e-05 | 1.52e-01 | 0.1389 |
| 132 | ADK | HTA11_3410_2000001011 | Human | Colorectum | AD | 2.66e-21 | -5.38e-01 | 0.0155 |
| 132 | ADK | HTA11_2487_2000001011 | Human | Colorectum | SER | 9.77e-07 | -5.74e-01 | -0.1808 |
| 132 | ADK | HTA11_2951_2000001011 | Human | Colorectum | AD | 1.98e-05 | -6.81e-01 | 0.0216 |
| 132 | ADK | HTA11_3361_2000001011 | Human | Colorectum | AD | 9.17e-18 | -7.12e-01 | -0.1207 |
| 132 | ADK | HTA11_696_2000001011 | Human | Colorectum | AD | 5.57e-03 | -2.96e-01 | -0.1464 |
| 132 | ADK | HTA11_866_2000001011 | Human | Colorectum | AD | 3.21e-03 | -3.15e-01 | -0.1001 |
| 132 | ADK | HTA11_5212_2000001011 | Human | Colorectum | AD | 2.35e-06 | -7.94e-01 | -0.2061 |
| 132 | ADK | HTA11_5216_2000001011 | Human | Colorectum | SER | 2.91e-03 | -5.44e-01 | -0.1462 |
| 132 | ADK | HTA11_9341_2000001011 | Human | Colorectum | SER | 7.87e-05 | -6.58e-01 | -0.00410000000000005 |
| 132 | ADK | HTA11_7862_2000001011 | Human | Colorectum | AD | 9.91e-06 | -6.11e-01 | -0.0179 |
| 132 | ADK | HTA11_866_3004761011 | Human | Colorectum | AD | 2.23e-09 | -5.14e-01 | 0.096 |
| 132 | ADK | HTA11_4255_2000001011 | Human | Colorectum | SER | 8.76e-03 | -4.38e-01 | 0.0446 |
| 132 | ADK | HTA11_9408_2000001011 | Human | Colorectum | AD | 9.03e-05 | -6.39e-01 | 0.0451 |
| 132 | ADK | HTA11_8622_2000001021 | Human | Colorectum | SER | 7.85e-05 | -5.09e-01 | 0.0528 |
| Page: 1 2 3 4 5 6 7 8 9 10 11 12 13 |
| Tissue | Expression Dynamics | Abbreviation |
| Cervix | 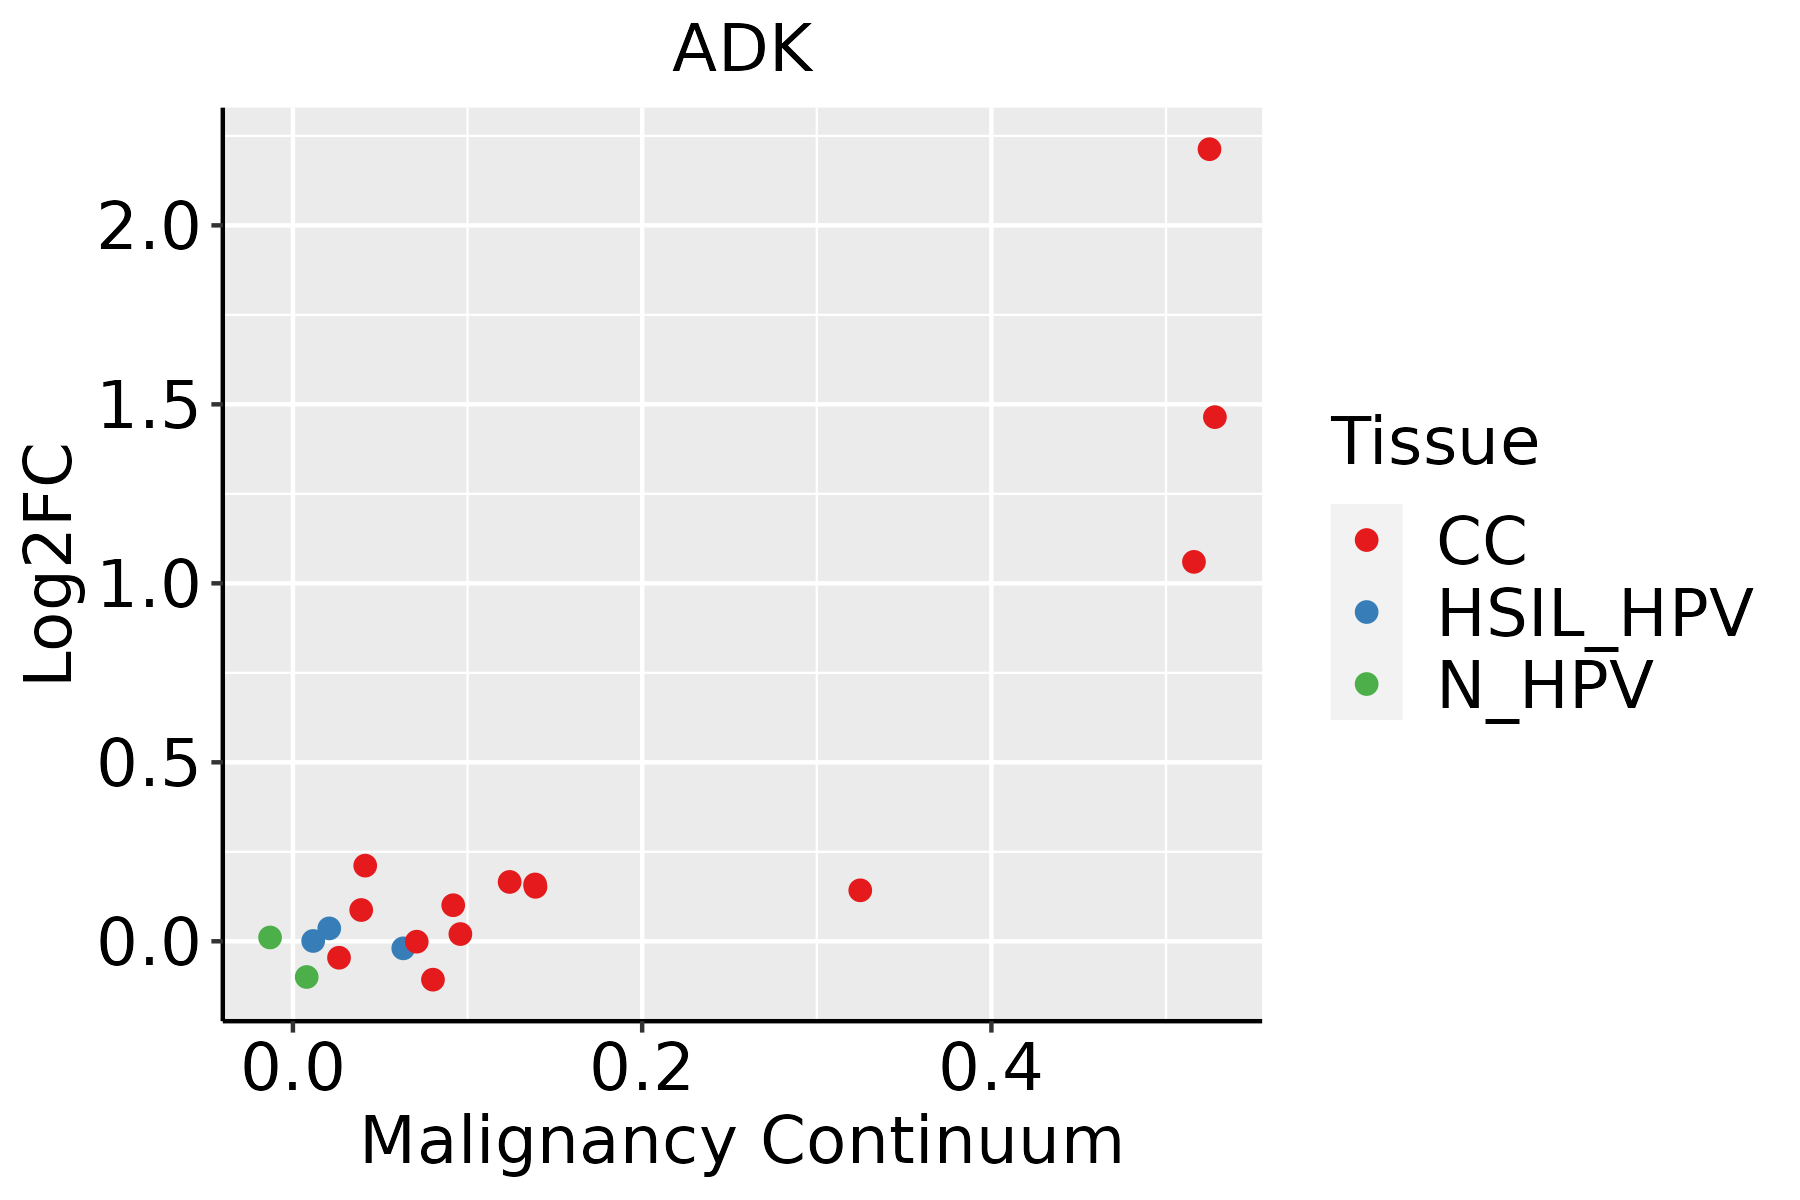 | CC: Cervix cancer |
| HSIL_HPV: HPV-infected high-grade squamous intraepithelial lesions | ||
| N_HPV: HPV-infected normal cervix | ||
| Colorectum (GSE201348) |  | FAP: Familial adenomatous polyposis |
| CRC: Colorectal cancer | ||
| Colorectum (HTA11) |  | AD: Adenomas |
| SER: Sessile serrated lesions | ||
| MSI-H: Microsatellite-high colorectal cancer | ||
| MSS: Microsatellite stable colorectal cancer | ||
| Endometrium | 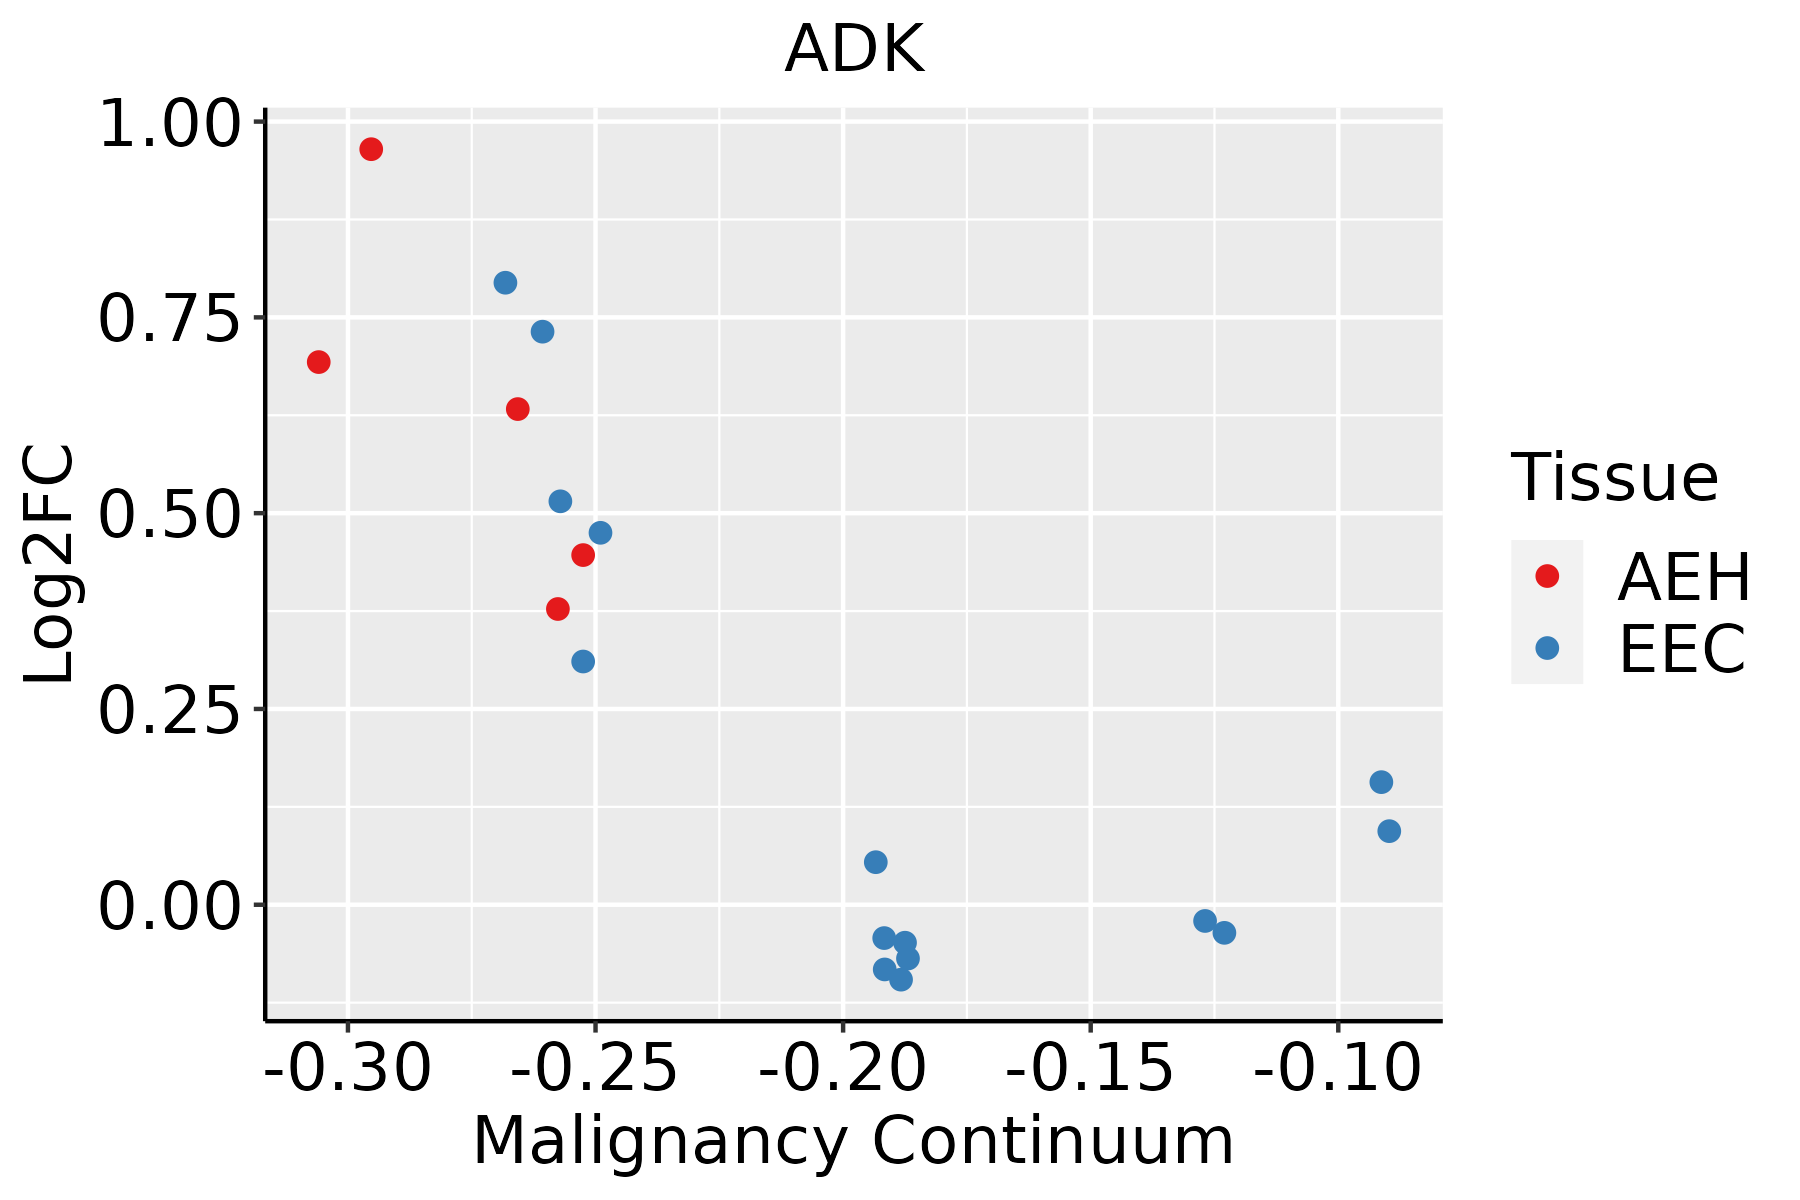 | AEH: Atypical endometrial hyperplasia |
| EEC: Endometrioid Cancer | ||
| Esophagus | 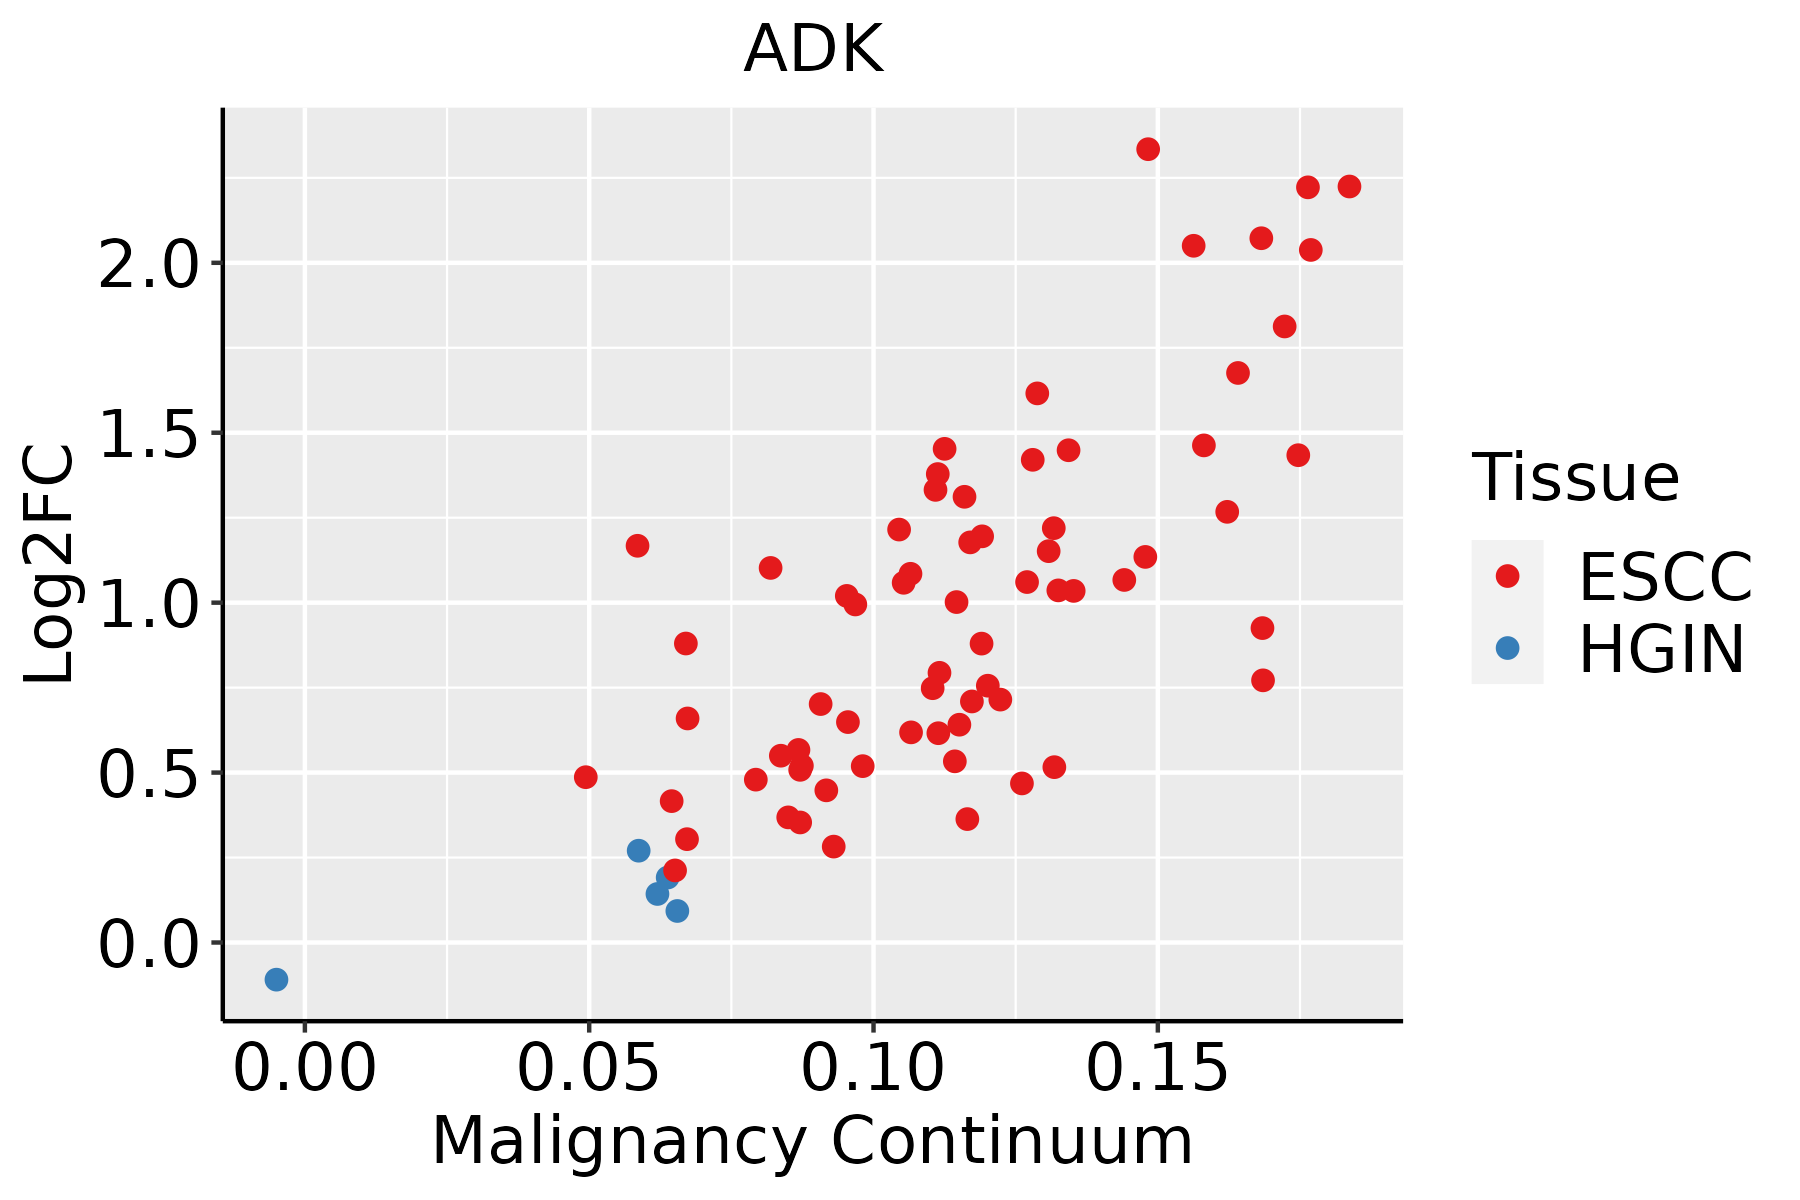 | ESCC: Esophageal squamous cell carcinoma |
| HGIN: High-grade intraepithelial neoplasias | ||
| LGIN: Low-grade intraepithelial neoplasias | ||
| Liver |  | HCC: Hepatocellular carcinoma |
| NAFLD: Non-alcoholic fatty liver disease | ||
| Lung | 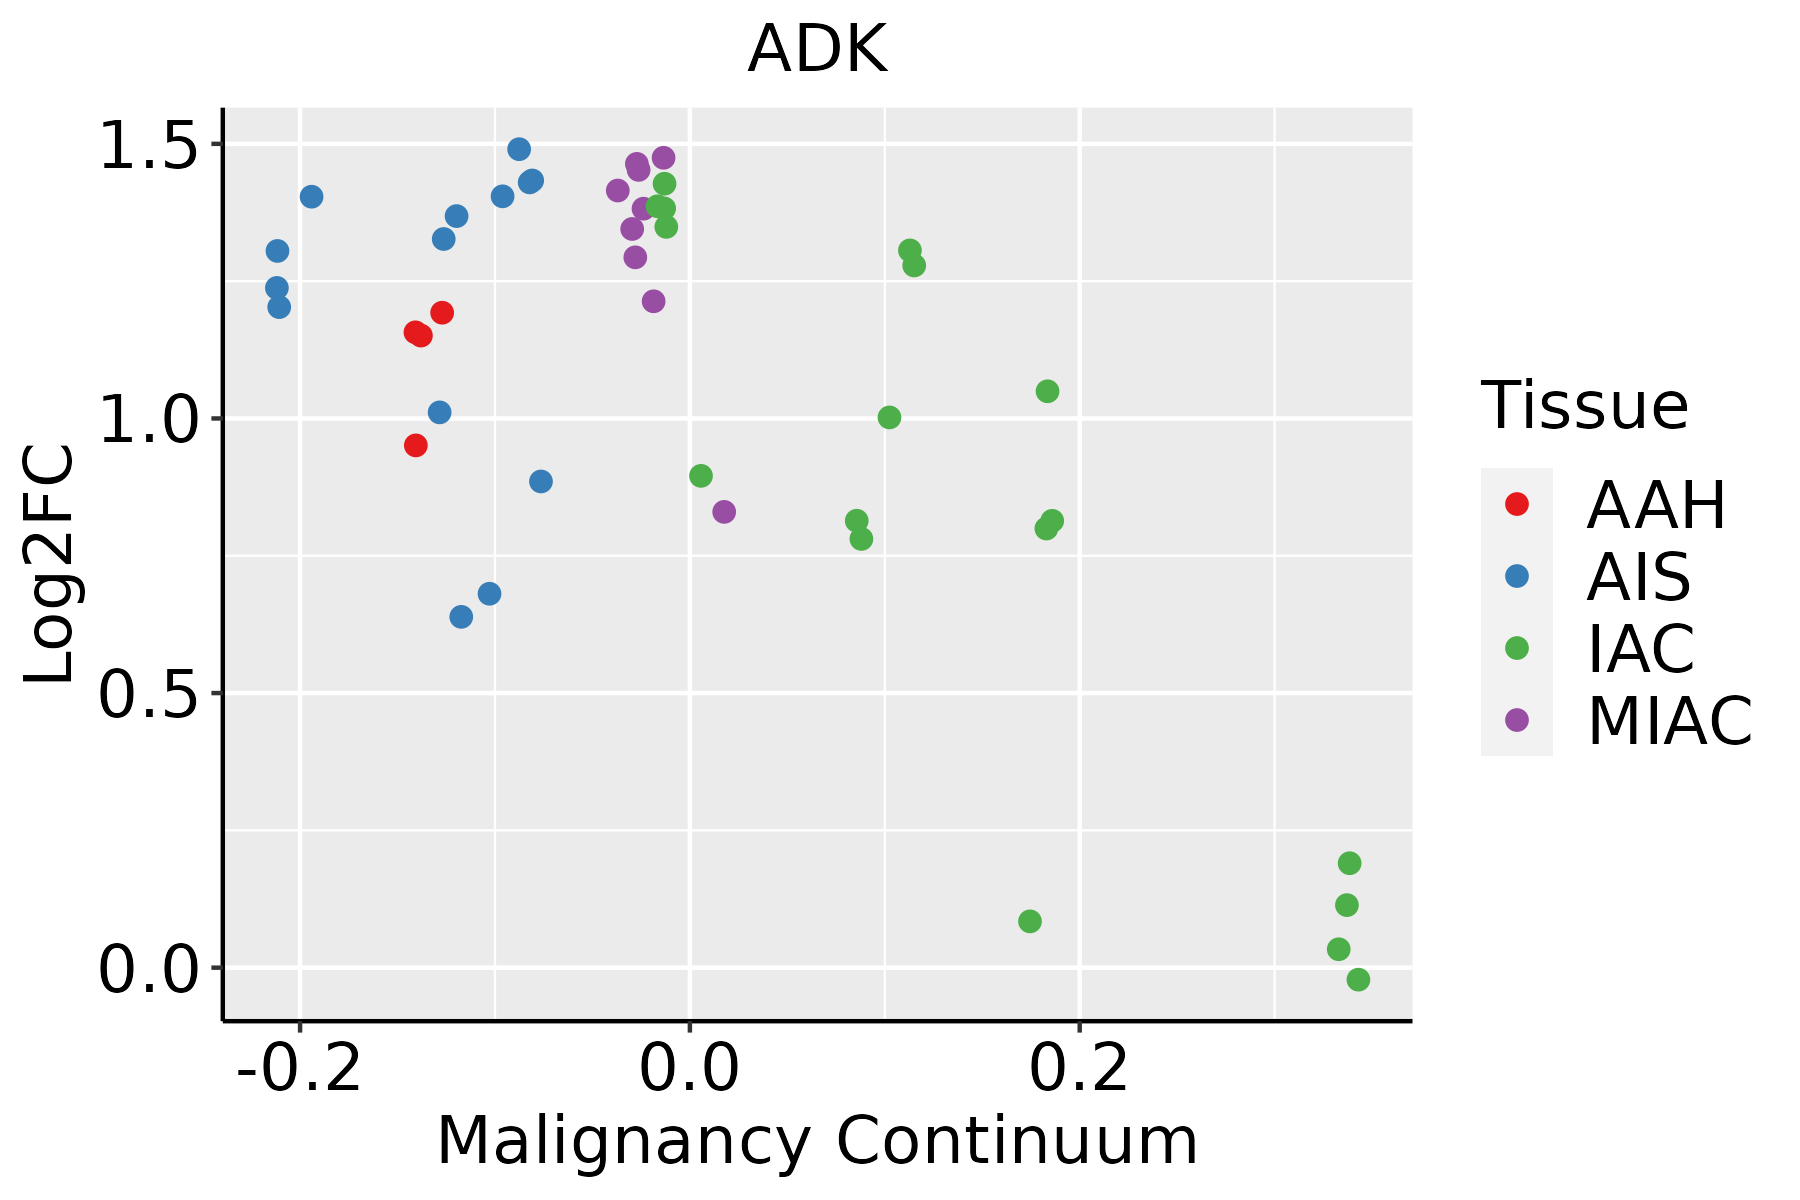 | AAH: Atypical adenomatous hyperplasia |
| AIS: Adenocarcinoma in situ | ||
| IAC: Invasive lung adenocarcinoma | ||
| MIA: Minimally invasive adenocarcinoma | ||
| Oral Cavity | 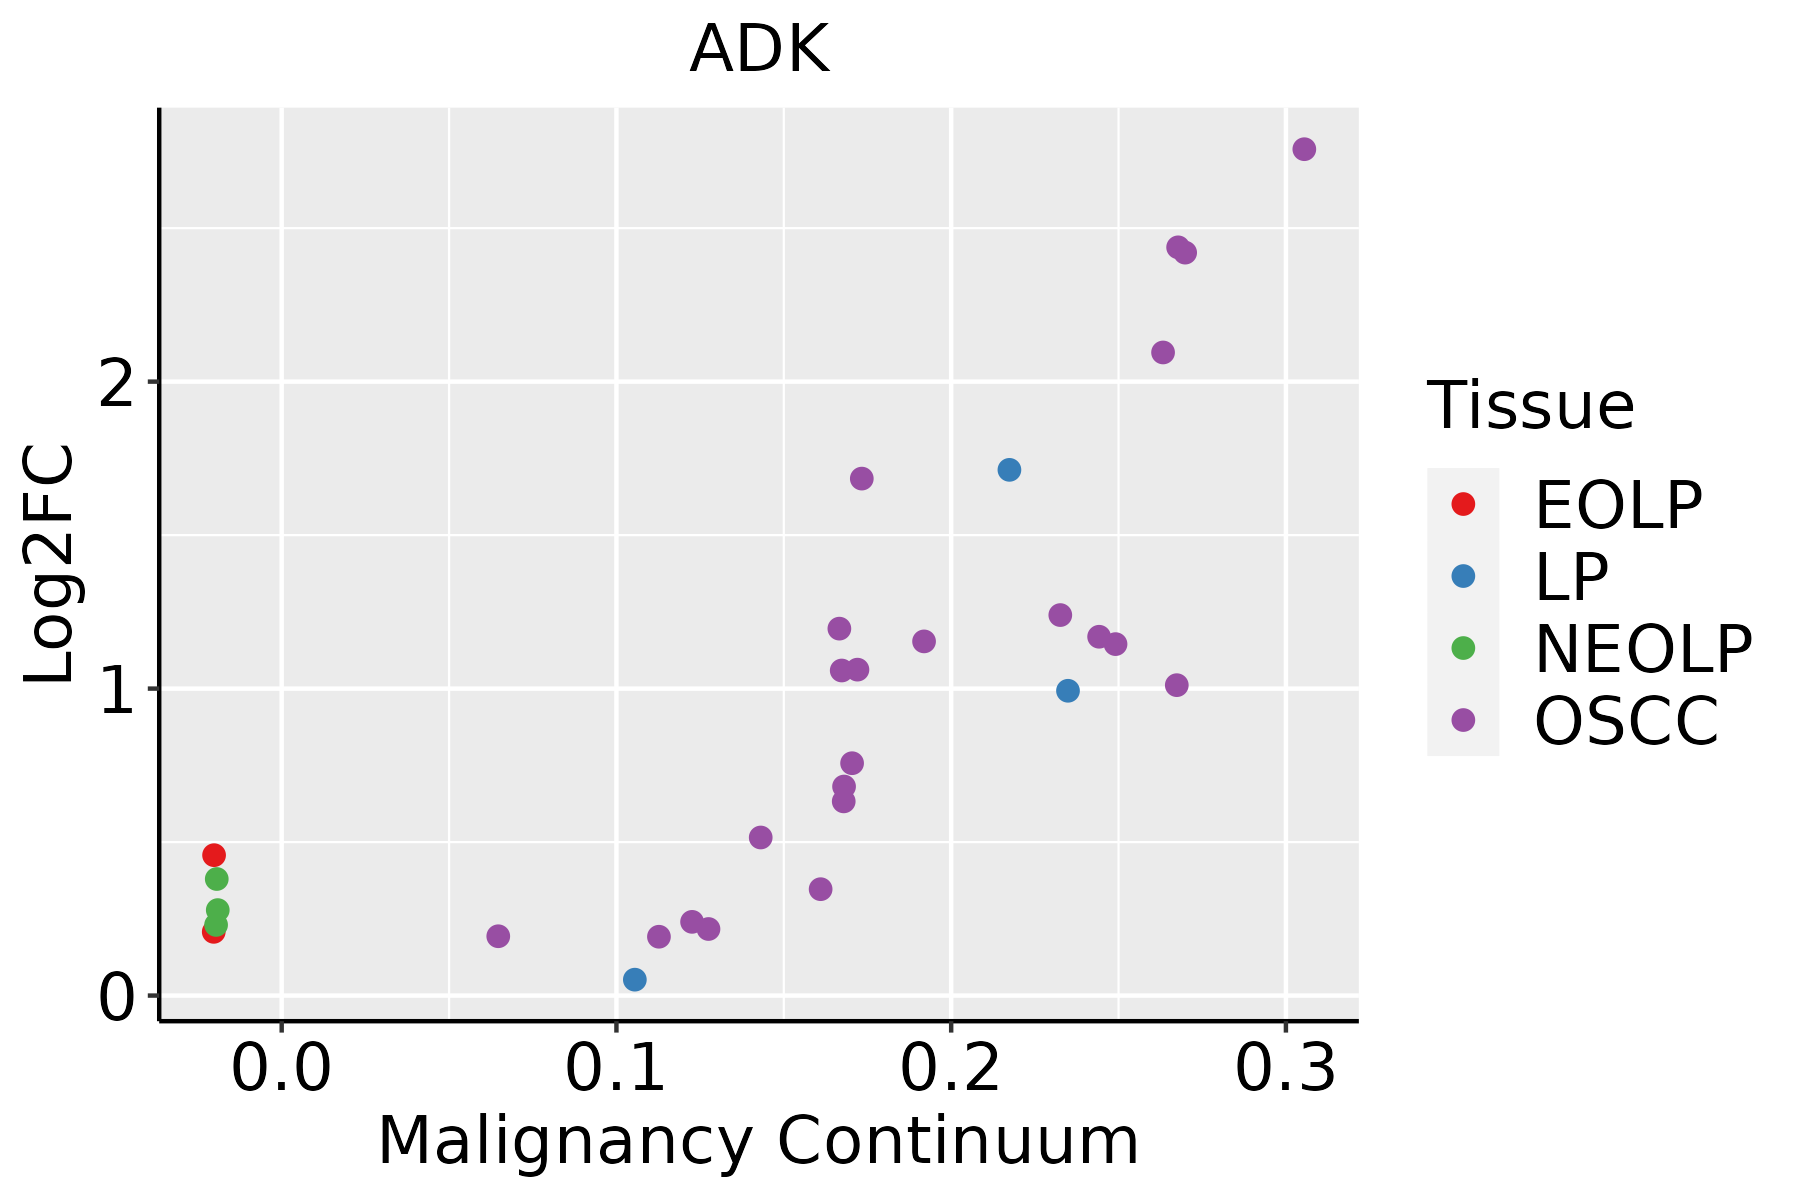 | EOLP: Erosive Oral lichen planus |
| LP: leukoplakia | ||
| NEOLP: Non-erosive oral lichen planus | ||
| OSCC: Oral squamous cell carcinoma | ||
| Prostate |  | BPH: Benign Prostatic Hyperplasia |
| Skin |  | AK: Actinic keratosis |
| cSCC: Cutaneous squamous cell carcinoma | ||
| SCCIS:squamous cell carcinoma in situ | ||
| Thyroid |  | ATC: Anaplastic thyroid cancer |
| HT: Hashimoto's thyroiditis | ||
| PTC: Papillary thyroid cancer |
| ∗log2FC in expression of this searched gene in stem-like cells from each diseased tissue sample relative to stem-like cells in normal samples in each tissue plotted against the malignancy continuum. Samples are colored based on if they are from different disease stage. |
Top |
Malignant transformation related pathway analysis |
| Find out the enriched GO biological processes and KEGG pathways involved in transition from healthy to precancer to cancer |
| Tissue | Disease Stage | Enriched GO biological Processes |
| Colorectum | AD |  |
| Colorectum | SER |  |
| Colorectum | MSS |  |
| Colorectum | MSI-H |  |
| Colorectum | FAP |  |
| ∗Top 15 enriched GO BP terms are showed in the bar plot of each disease state in each tissue. Each row represents a significant GO biological process which is colored according to the -log10(p.adjust). |
| Page: 1 2 3 4 5 6 7 8 9 |
| GO ID | Tissue | Disease Stage | Description | Gene Ratio | Bg Ratio | pvalue | p.adjust | Count |
| GO:000925920 | Esophagus | HGIN | ribonucleotide metabolic process | 71/2587 | 385/18723 | 6.25e-03 | 4.97e-02 | 71 |
| GO:1904951111 | Esophagus | ESCC | positive regulation of establishment of protein localization | 216/8552 | 319/18723 | 1.01e-15 | 6.86e-14 | 216 |
| GO:0051222111 | Esophagus | ESCC | positive regulation of protein transport | 204/8552 | 303/18723 | 1.56e-14 | 8.38e-13 | 204 |
| GO:0046034111 | Esophagus | ESCC | ATP metabolic process | 189/8552 | 277/18723 | 1.99e-14 | 1.04e-12 | 189 |
| GO:0006753110 | Esophagus | ESCC | nucleoside phosphate metabolic process | 288/8552 | 497/18723 | 1.80e-08 | 3.50e-07 | 288 |
| GO:0019693111 | Esophagus | ESCC | ribose phosphate metabolic process | 234/8552 | 396/18723 | 4.24e-08 | 7.76e-07 | 234 |
| GO:0009117111 | Esophagus | ESCC | nucleotide metabolic process | 282/8552 | 489/18723 | 4.70e-08 | 8.50e-07 | 282 |
| GO:0009141111 | Esophagus | ESCC | nucleoside triphosphate metabolic process | 78/8552 | 112/18723 | 2.36e-07 | 3.59e-06 | 78 |
| GO:0009259111 | Esophagus | ESCC | ribonucleotide metabolic process | 224/8552 | 385/18723 | 4.41e-07 | 6.00e-06 | 224 |
| GO:0072521111 | Esophagus | ESCC | purine-containing compound metabolic process | 238/8552 | 416/18723 | 1.20e-06 | 1.49e-05 | 238 |
| GO:0009150111 | Esophagus | ESCC | purine ribonucleotide metabolic process | 213/8552 | 368/18723 | 1.40e-06 | 1.69e-05 | 213 |
| GO:0046390110 | Esophagus | ESCC | ribose phosphate biosynthetic process | 119/8552 | 190/18723 | 1.73e-06 | 2.06e-05 | 119 |
| GO:0006163111 | Esophagus | ESCC | purine nucleotide metabolic process | 226/8552 | 396/18723 | 2.81e-06 | 3.21e-05 | 226 |
| GO:0009144110 | Esophagus | ESCC | purine nucleoside triphosphate metabolic process | 61/8552 | 88/18723 | 6.06e-06 | 6.23e-05 | 61 |
| GO:000916516 | Esophagus | ESCC | nucleotide biosynthetic process | 150/8552 | 254/18723 | 1.12e-05 | 1.06e-04 | 150 |
| GO:0009260110 | Esophagus | ESCC | ribonucleotide biosynthetic process | 112/8552 | 182/18723 | 1.12e-05 | 1.06e-04 | 112 |
| GO:190129316 | Esophagus | ESCC | nucleoside phosphate biosynthetic process | 151/8552 | 256/18723 | 1.15e-05 | 1.08e-04 | 151 |
| GO:000914219 | Esophagus | ESCC | nucleoside triphosphate biosynthetic process | 58/8552 | 85/18723 | 2.16e-05 | 1.87e-04 | 58 |
| GO:007252217 | Esophagus | ESCC | purine-containing compound biosynthetic process | 120/8552 | 200/18723 | 3.02e-05 | 2.51e-04 | 120 |
| GO:0009152110 | Esophagus | ESCC | purine ribonucleotide biosynthetic process | 103/8552 | 169/18723 | 4.40e-05 | 3.51e-04 | 103 |
| Page: 1 2 3 4 5 6 7 8 9 10 11 12 13 14 15 16 17 18 19 20 21 22 23 24 25 26 27 28 29 30 |
| Pathway ID | Tissue | Disease Stage | Description | Gene Ratio | Bg Ratio | pvalue | p.adjust | qvalue | Count |
| hsa012325 | Esophagus | ESCC | Nucleotide metabolism | 59/4205 | 85/8465 | 1.67e-04 | 6.58e-04 | 3.37e-04 | 59 |
| hsa0123212 | Esophagus | ESCC | Nucleotide metabolism | 59/4205 | 85/8465 | 1.67e-04 | 6.58e-04 | 3.37e-04 | 59 |
| hsa01232 | Liver | Cirrhotic | Nucleotide metabolism | 39/2530 | 85/8465 | 1.27e-03 | 6.73e-03 | 4.15e-03 | 39 |
| hsa012321 | Liver | Cirrhotic | Nucleotide metabolism | 39/2530 | 85/8465 | 1.27e-03 | 6.73e-03 | 4.15e-03 | 39 |
| hsa012322 | Liver | HCC | Nucleotide metabolism | 59/4020 | 85/8465 | 3.30e-05 | 1.88e-04 | 1.04e-04 | 59 |
| hsa012323 | Liver | HCC | Nucleotide metabolism | 59/4020 | 85/8465 | 3.30e-05 | 1.88e-04 | 1.04e-04 | 59 |
| hsa012324 | Oral cavity | OSCC | Nucleotide metabolism | 54/3704 | 85/8465 | 1.78e-04 | 5.95e-04 | 3.03e-04 | 54 |
| hsa0123211 | Oral cavity | OSCC | Nucleotide metabolism | 54/3704 | 85/8465 | 1.78e-04 | 5.95e-04 | 3.03e-04 | 54 |
| hsa0123221 | Oral cavity | LP | Nucleotide metabolism | 42/2418 | 85/8465 | 3.62e-05 | 2.36e-04 | 1.52e-04 | 42 |
| hsa0123231 | Oral cavity | LP | Nucleotide metabolism | 42/2418 | 85/8465 | 3.62e-05 | 2.36e-04 | 1.52e-04 | 42 |
| Page: 1 |
Top |
Cell-cell communication analysis |
| Identification of potential cell-cell interactions between two cell types and their ligand-receptor pairs for different disease states |
| Ligand | Receptor | LRpair | Pathway | Tissue | Disease Stage |
| Page: 1 |
Top |
Single-cell gene regulatory network inference analysis |
| Find out the significant the regulons (TFs) and the target genes of each regulon across cell types for different disease states |
| TF | Cell Type | Tissue | Disease Stage | Target Gene | RSS | Regulon Activity |
| ∗The dot plots of a searched regulon are shown for all cell subpopulations in each disease state of each tissue based on the regulon specific score inferred using pySCENIC and by calculating the average expression. |
| Page: 1 |
Top |
Somatic mutation of malignant transformation related genes |
| Annotation of somatic variants for genes involved in malignant transformation |
| Hugo Symbol | Variant Class | Variant Classification | dbSNP RS | HGVSc | HGVSp | HGVSp Short | SWISSPROT | BIOTYPE | SIFT | PolyPhen | Tumor Sample Barcode | Tissue | Histology | Sex | Age | Stage | Therapy Types | Drugs | Outcome |
| ADK | SNV | Missense_Mutation | novel | c.947N>C | p.Gly316Ala | p.G316A | P55263 | protein_coding | deleterious(0) | probably_damaging(0.996) | TCGA-C5-A1BF-01 | Cervix | cervical & endocervical cancer | Female | <65 | I/II | Chemotherapy | cisplatin | PD |
| ADK | SNV | Missense_Mutation | novel | c.226G>A | p.Glu76Lys | p.E76K | P55263 | protein_coding | deleterious(0.01) | possibly_damaging(0.672) | TCGA-AZ-4315-01 | Colorectum | colon adenocarcinoma | Male | <65 | I/II | Unknown | Unknown | SD |
| ADK | SNV | Missense_Mutation | rs562751709 | c.830N>A | p.Arg277Gln | p.R277Q | P55263 | protein_coding | deleterious(0) | probably_damaging(0.999) | TCGA-G4-6586-01 | Colorectum | colon adenocarcinoma | Female | >=65 | I/II | Unknown | Unknown | SD |
| ADK | SNV | Missense_Mutation | c.44N>C | p.Val15Ala | p.V15A | P55263 | protein_coding | tolerated_low_confidence(0.16) | benign(0) | TCGA-G4-6588-01 | Colorectum | colon adenocarcinoma | Female | <65 | I/II | Unknown | Unknown | SD | |
| ADK | deletion | Frame_Shift_Del | rs771117099 | c.559delN | p.Thr190GlnfsTer8 | p.T190Qfs*8 | P55263 | protein_coding | TCGA-AA-A010-01 | Colorectum | colon adenocarcinoma | Female | <65 | I/II | Chemotherapy | folinic | CR | ||
| ADK | SNV | Missense_Mutation | novel | c.887N>C | p.Val296Ala | p.V296A | P55263 | protein_coding | deleterious(0.05) | benign(0.06) | TCGA-A5-A2K5-01 | Endometrium | uterine corpus endometrioid carcinoma | Female | >=65 | I/II | Unknown | Unknown | SD |
| ADK | SNV | Missense_Mutation | novel | c.128N>C | p.Asp43Ala | p.D43A | P55263 | protein_coding | tolerated(0.28) | benign(0.014) | TCGA-AJ-A3BH-01 | Endometrium | uterine corpus endometrioid carcinoma | Female | Unknown | I/II | Unknown | Unknown | SD |
| ADK | SNV | Missense_Mutation | novel | c.489G>T | p.Lys163Asn | p.K163N | P55263 | protein_coding | tolerated(0.62) | possibly_damaging(0.506) | TCGA-AP-A1DV-01 | Endometrium | uterine corpus endometrioid carcinoma | Female | <65 | I/II | Unknown | Unknown | SD |
| ADK | SNV | Missense_Mutation | novel | c.989A>G | p.Asp330Gly | p.D330G | P55263 | protein_coding | tolerated(1) | benign(0) | TCGA-AP-A1DV-01 | Endometrium | uterine corpus endometrioid carcinoma | Female | <65 | I/II | Unknown | Unknown | SD |
| ADK | SNV | Missense_Mutation | c.896N>G | p.Phe299Cys | p.F299C | P55263 | protein_coding | deleterious(0) | probably_damaging(0.992) | TCGA-B5-A0JY-01 | Endometrium | uterine corpus endometrioid carcinoma | Female | <65 | III/IV | Chemotherapy | doxorubicin | SD |
| Page: 1 2 |
Top |
Related drugs of malignant transformation related genes |
| Identification of chemicals and drugs interact with genes involved in malignant transfromation |
| (DGIdb 4.0) |
| Entrez ID | Symbol | Category | Interaction Types | Drug Claim Name | Drug Name | PMIDs |
| 132 | ADK | DRUGGABLE GENOME, ENZYME, KINASE | DABIGATRAN | DABIGATRAN | 22494098 | |
| 132 | ADK | DRUGGABLE GENOME, ENZYME, KINASE | GP-3269 | |||
| 132 | ADK | DRUGGABLE GENOME, ENZYME, KINASE | LOMUSTINE | LOMUSTINE | 6317371 | |
| 132 | ADK | DRUGGABLE GENOME, ENZYME, KINASE | 2,3-DIDEOXYADENOSINE | 3262616 | ||
| 132 | ADK | DRUGGABLE GENOME, ENZYME, KINASE | DACARBAZINE | DACARBAZINE | 6317371 | |
| 132 | ADK | DRUGGABLE GENOME, ENZYME, KINASE | BLEOMYCIN | BLEOMYCIN | 6317371 | |
| 132 | ADK | DRUGGABLE GENOME, ENZYME, KINASE | 2&APOS;,3&APOS;-DIDEOXYINOSINE | 3262616 | ||
| 132 | ADK | DRUGGABLE GENOME, ENZYME, KINASE | BUSULFAN | BUSULFAN | 6317371 | |
| 132 | ADK | DRUGGABLE GENOME, ENZYME, KINASE | inhibitor | 178101822 | ||
| 132 | ADK | DRUGGABLE GENOME, ENZYME, KINASE | inhibitor | 178101823 |
| Page: 1 2 |

Copyright 2023-Present -The University of Texas Health Science Center at Houston |