
|
|||||
|
 | |
| |
| |
| |
| |
| |
|
Gene: TRIP11 |
Gene summary for TRIP11 |
| Gene information | Species | Human | Gene symbol | TRIP11 | Gene ID | 9321 |
| Gene name | thyroid hormone receptor interactor 11 | |
| Gene Alias | ACG1A | |
| Cytomap | 14q32.12 | |
| Gene Type | protein-coding | GO ID | GO:0001501 | UniProtAcc | Q15643 |
Top |
Malignant transformation analysis |
| Identification of the aberrant gene expression in precancerous and cancerous lesions by comparing the gene expression of stem-like cells in diseased tissues with normal stem cells |
| Entrez ID | Symbol | Replicates | Species | Organ | Tissue | Adj P-value | Log2FC | Malignancy |
| 9321 | TRIP11 | LZE2T | Human | Esophagus | ESCC | 8.39e-05 | 5.83e-01 | 0.082 |
| 9321 | TRIP11 | LZE4T | Human | Esophagus | ESCC | 2.03e-22 | 7.41e-01 | 0.0811 |
| 9321 | TRIP11 | LZE5T | Human | Esophagus | ESCC | 7.10e-11 | 1.09e+00 | 0.0514 |
| 9321 | TRIP11 | LZE7T | Human | Esophagus | ESCC | 1.01e-04 | 4.37e-01 | 0.0667 |
| 9321 | TRIP11 | LZE8T | Human | Esophagus | ESCC | 5.43e-06 | 2.58e-01 | 0.067 |
| 9321 | TRIP11 | LZE20T | Human | Esophagus | ESCC | 1.24e-11 | 4.39e-01 | 0.0662 |
| 9321 | TRIP11 | LZE22T | Human | Esophagus | ESCC | 1.30e-02 | 2.66e-01 | 0.068 |
| 9321 | TRIP11 | LZE24T | Human | Esophagus | ESCC | 2.74e-16 | 4.92e-01 | 0.0596 |
| 9321 | TRIP11 | LZE21T | Human | Esophagus | ESCC | 2.05e-02 | 2.96e-01 | 0.0655 |
| 9321 | TRIP11 | P1T-E | Human | Esophagus | ESCC | 3.01e-04 | 3.62e-01 | 0.0875 |
| 9321 | TRIP11 | P2T-E | Human | Esophagus | ESCC | 2.40e-21 | 3.13e-01 | 0.1177 |
| 9321 | TRIP11 | P4T-E | Human | Esophagus | ESCC | 1.05e-17 | 4.54e-01 | 0.1323 |
| 9321 | TRIP11 | P5T-E | Human | Esophagus | ESCC | 5.31e-10 | 2.36e-01 | 0.1327 |
| 9321 | TRIP11 | P8T-E | Human | Esophagus | ESCC | 7.98e-20 | 3.70e-01 | 0.0889 |
| 9321 | TRIP11 | P9T-E | Human | Esophagus | ESCC | 2.30e-06 | 2.09e-01 | 0.1131 |
| 9321 | TRIP11 | P10T-E | Human | Esophagus | ESCC | 7.50e-30 | 6.92e-01 | 0.116 |
| 9321 | TRIP11 | P11T-E | Human | Esophagus | ESCC | 1.64e-03 | 4.33e-01 | 0.1426 |
| 9321 | TRIP11 | P12T-E | Human | Esophagus | ESCC | 1.82e-25 | 6.29e-01 | 0.1122 |
| 9321 | TRIP11 | P15T-E | Human | Esophagus | ESCC | 1.95e-30 | 6.72e-01 | 0.1149 |
| 9321 | TRIP11 | P16T-E | Human | Esophagus | ESCC | 2.83e-13 | 2.91e-01 | 0.1153 |
| Page: 1 2 3 4 5 6 7 |
| Tissue | Expression Dynamics | Abbreviation |
| Esophagus |  | ESCC: Esophageal squamous cell carcinoma |
| HGIN: High-grade intraepithelial neoplasias | ||
| LGIN: Low-grade intraepithelial neoplasias | ||
| Liver |  | HCC: Hepatocellular carcinoma |
| NAFLD: Non-alcoholic fatty liver disease | ||
| Oral Cavity | 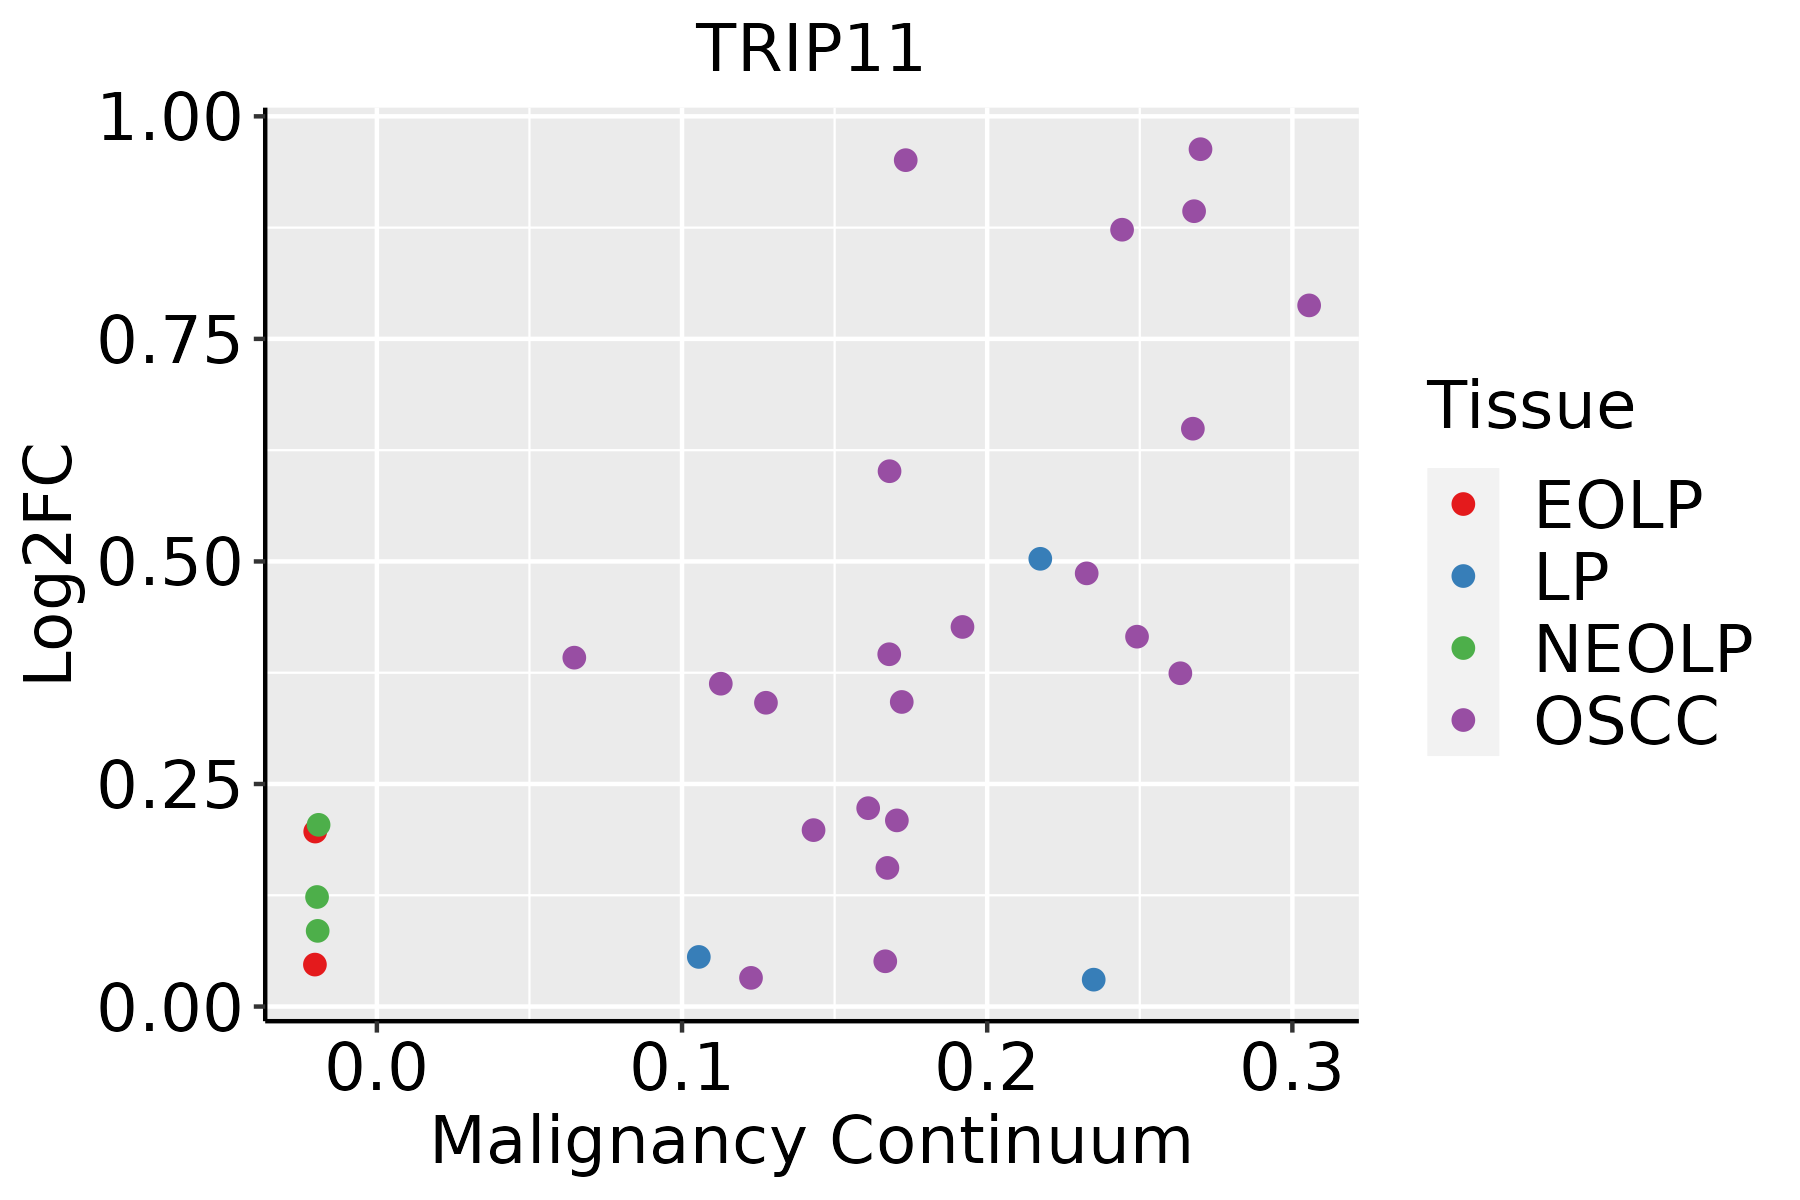 | EOLP: Erosive Oral lichen planus |
| LP: leukoplakia | ||
| NEOLP: Non-erosive oral lichen planus | ||
| OSCC: Oral squamous cell carcinoma | ||
| Prostate | 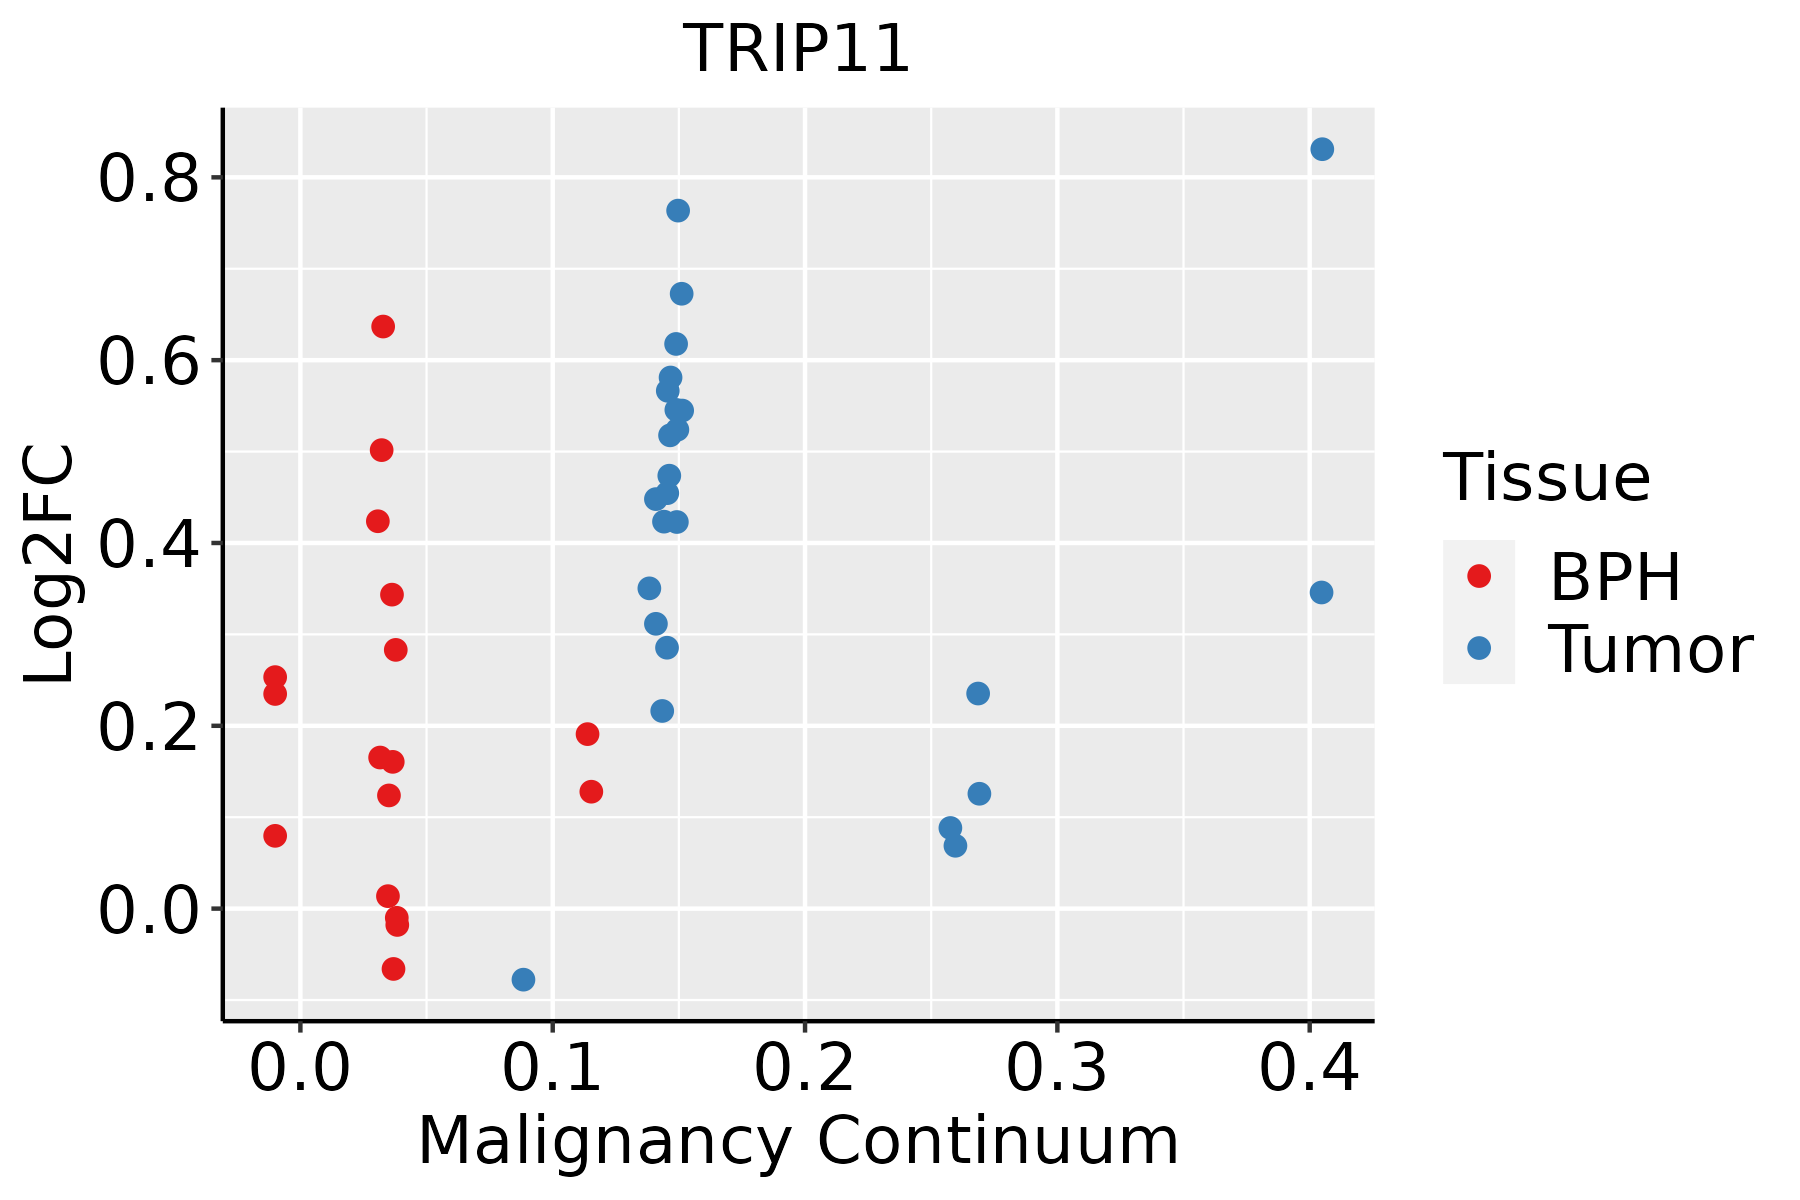 | BPH: Benign Prostatic Hyperplasia |
| Skin |  | AK: Actinic keratosis |
| cSCC: Cutaneous squamous cell carcinoma | ||
| SCCIS:squamous cell carcinoma in situ | ||
| Thyroid | 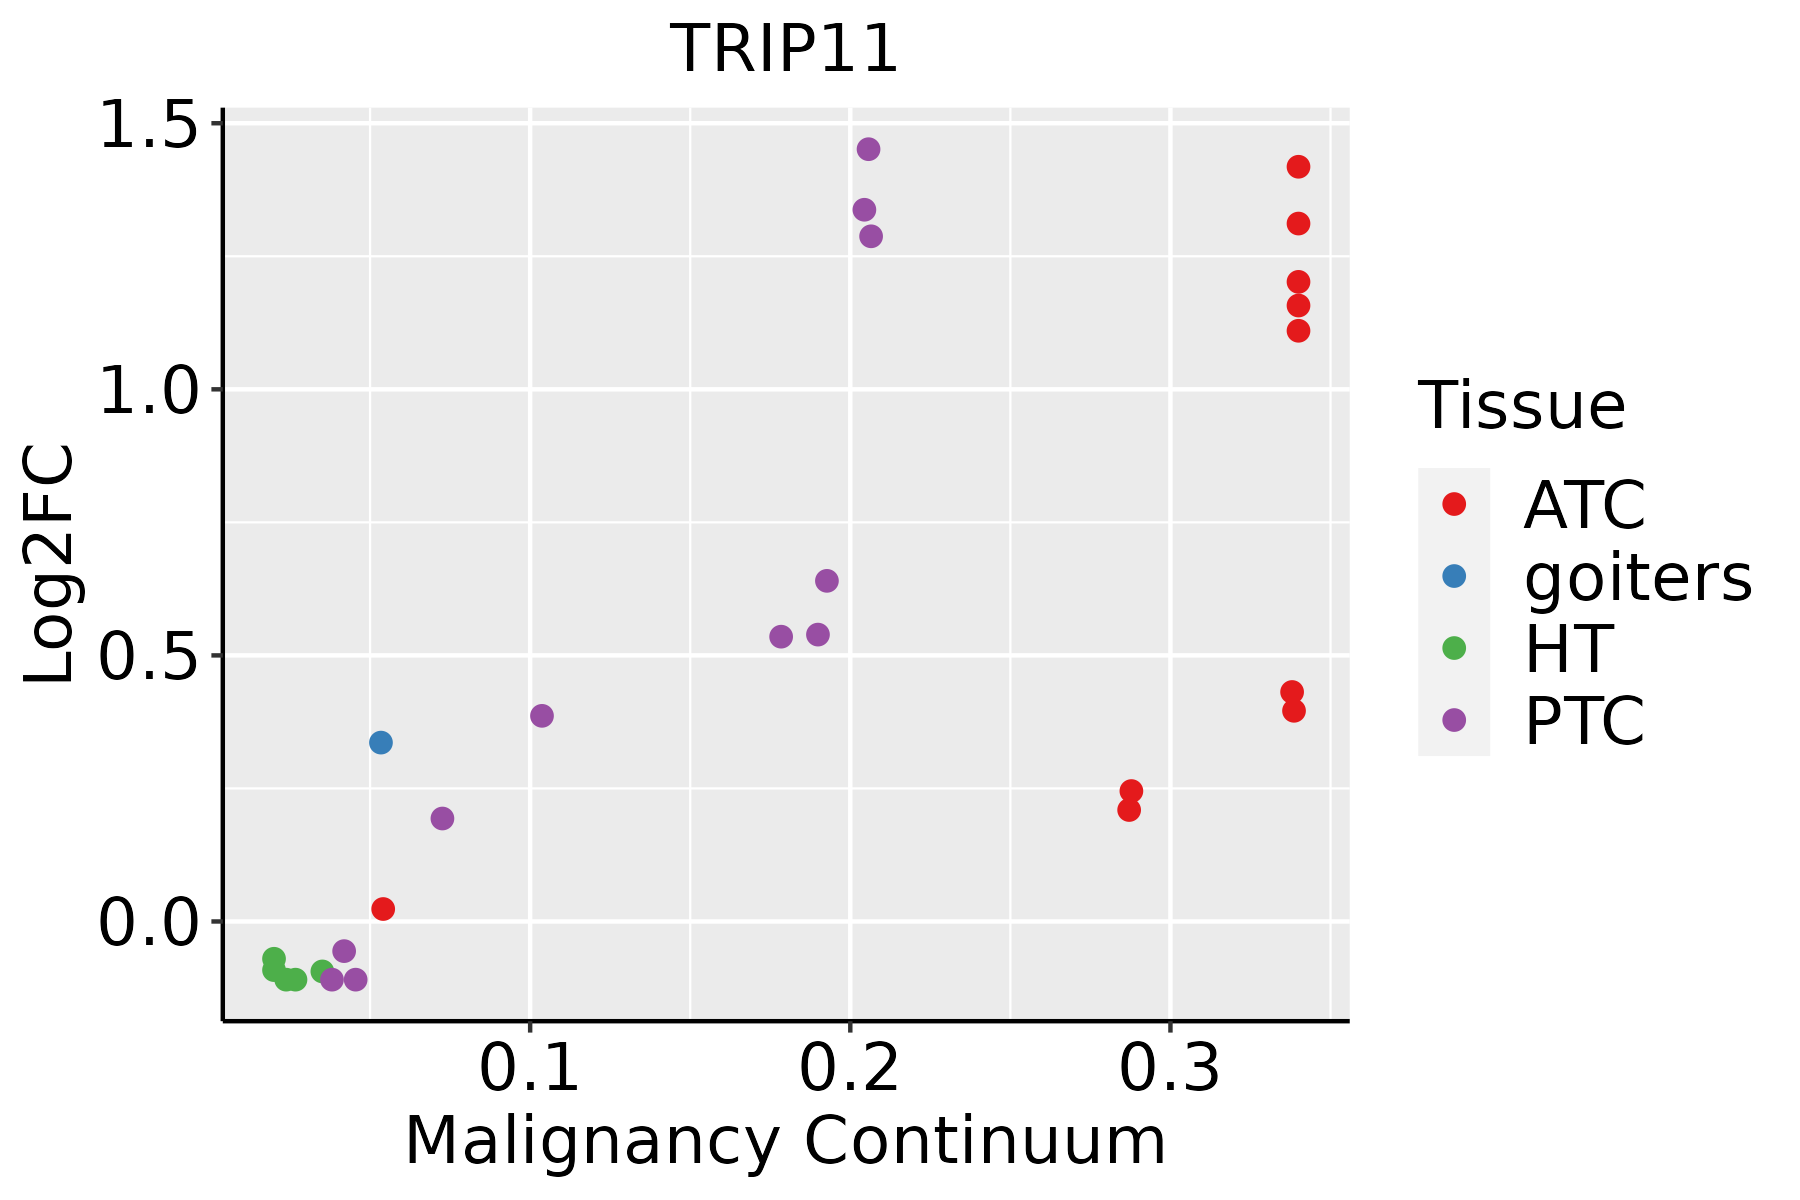 | ATC: Anaplastic thyroid cancer |
| HT: Hashimoto's thyroiditis | ||
| PTC: Papillary thyroid cancer |
| ∗log2FC in expression of this searched gene in stem-like cells from each diseased tissue sample relative to stem-like cells in normal samples in each tissue plotted against the malignancy continuum. Samples are colored based on if they are from different disease stage. |
Top |
Malignant transformation related pathway analysis |
| Find out the enriched GO biological processes and KEGG pathways involved in transition from healthy to precancer to cancer |
| Tissue | Disease Stage | Enriched GO biological Processes |
| Thyroid | PTC |  |
| Thyroid | goiters |  |
| Thyroid | ATC |  |
| ∗Top 15 enriched GO BP terms are showed in the bar plot of each disease state in each tissue. Each row represents a significant GO biological process which is colored according to the -log10(p.adjust). |
| Page: 1 2 3 4 5 6 7 8 9 |
| GO ID | Tissue | Disease Stage | Description | Gene Ratio | Bg Ratio | pvalue | p.adjust | Count |
| GO:004819318 | Esophagus | ESCC | Golgi vesicle transport | 231/8552 | 296/18723 | 1.82e-30 | 9.63e-28 | 231 |
| GO:005165617 | Esophagus | ESCC | establishment of organelle localization | 273/8552 | 390/18723 | 9.13e-23 | 1.81e-20 | 273 |
| GO:000688815 | Esophagus | ESCC | endoplasmic reticulum to Golgi vesicle-mediated transport | 102/8552 | 130/18723 | 1.73e-14 | 9.22e-13 | 102 |
| GO:005165016 | Esophagus | ESCC | establishment of vesicle localization | 114/8552 | 161/18723 | 8.20e-11 | 2.53e-09 | 114 |
| GO:005164815 | Esophagus | ESCC | vesicle localization | 119/8552 | 177/18723 | 5.16e-09 | 1.08e-07 | 119 |
| GO:00069038 | Esophagus | ESCC | vesicle targeting | 38/8552 | 45/18723 | 8.42e-08 | 1.43e-06 | 38 |
| GO:00091002 | Esophagus | ESCC | glycoprotein metabolic process | 226/8552 | 387/18723 | 2.64e-07 | 3.94e-06 | 226 |
| GO:00070308 | Esophagus | ESCC | Golgi organization | 101/8552 | 157/18723 | 1.78e-06 | 2.10e-05 | 101 |
| GO:00700854 | Esophagus | ESCC | glycosylation | 144/8552 | 240/18723 | 5.12e-06 | 5.38e-05 | 144 |
| GO:00064865 | Esophagus | ESCC | protein glycosylation | 135/8552 | 226/18723 | 1.36e-05 | 1.24e-04 | 135 |
| GO:00434135 | Esophagus | ESCC | macromolecule glycosylation | 135/8552 | 226/18723 | 1.36e-05 | 1.24e-04 | 135 |
| GO:00091012 | Esophagus | ESCC | glycoprotein biosynthetic process | 181/8552 | 317/18723 | 2.54e-05 | 2.15e-04 | 181 |
| GO:00603485 | Esophagus | ESCC | bone development | 115/8552 | 205/18723 | 1.67e-03 | 7.72e-03 | 115 |
| GO:00990222 | Esophagus | ESCC | vesicle tethering | 10/8552 | 11/18723 | 2.54e-03 | 1.08e-02 | 10 |
| GO:00901614 | Esophagus | ESCC | Golgi ribbon formation | 11/8552 | 13/18723 | 4.76e-03 | 1.85e-02 | 11 |
| GO:00487052 | Esophagus | ESCC | skeletal system morphogenesis | 120/8552 | 220/18723 | 4.90e-03 | 1.89e-02 | 120 |
| GO:00512161 | Esophagus | ESCC | cartilage development | 103/8552 | 190/18723 | 1.08e-02 | 3.67e-02 | 103 |
| GO:00020623 | Esophagus | ESCC | chondrocyte differentiation | 60/8552 | 106/18723 | 1.53e-02 | 4.94e-02 | 60 |
| GO:00481936 | Liver | NAFLD | Golgi vesicle transport | 66/1882 | 296/18723 | 3.66e-10 | 9.30e-08 | 66 |
| GO:0007030 | Liver | NAFLD | Golgi organization | 36/1882 | 157/18723 | 1.76e-06 | 7.68e-05 | 36 |
| Page: 1 2 3 4 5 6 7 8 9 |
| Pathway ID | Tissue | Disease Stage | Description | Gene Ratio | Bg Ratio | pvalue | p.adjust | qvalue | Count |
| Page: 1 |
Top |
Cell-cell communication analysis |
| Identification of potential cell-cell interactions between two cell types and their ligand-receptor pairs for different disease states |
| Ligand | Receptor | LRpair | Pathway | Tissue | Disease Stage |
| Page: 1 |
Top |
Single-cell gene regulatory network inference analysis |
| Find out the significant the regulons (TFs) and the target genes of each regulon across cell types for different disease states |
| TF | Cell Type | Tissue | Disease Stage | Target Gene | RSS | Regulon Activity |
| ∗The dot plots of a searched regulon are shown for all cell subpopulations in each disease state of each tissue based on the regulon specific score inferred using pySCENIC and by calculating the average expression. |
| Page: 1 |
Top |
Somatic mutation of malignant transformation related genes |
| Annotation of somatic variants for genes involved in malignant transformation |
| Hugo Symbol | Variant Class | Variant Classification | dbSNP RS | HGVSc | HGVSp | HGVSp Short | SWISSPROT | BIOTYPE | SIFT | PolyPhen | Tumor Sample Barcode | Tissue | Histology | Sex | Age | Stage | Therapy Types | Drugs | Outcome |
| TRIP11 | SNV | Missense_Mutation | rs766430885 | c.187N>G | p.Ile63Val | p.I63V | Q15643 | protein_coding | tolerated(0.58) | benign(0.001) | TCGA-A2-A0CQ-01 | Breast | breast invasive carcinoma | Female | <65 | I/II | Chemotherapy | adriamycin | SD |
| TRIP11 | SNV | Missense_Mutation | c.4709N>C | p.Leu1570Ser | p.L1570S | Q15643 | protein_coding | deleterious(0.04) | possibly_damaging(0.733) | TCGA-A8-A09G-01 | Breast | breast invasive carcinoma | Female | >=65 | III/IV | Unknown | Unknown | SD | |
| TRIP11 | SNV | Missense_Mutation | c.151N>C | p.Asp51His | p.D51H | Q15643 | protein_coding | tolerated(0.09) | benign(0.038) | TCGA-AC-A23H-01 | Breast | breast invasive carcinoma | Female | >=65 | I/II | Unknown | Unknown | PD | |
| TRIP11 | SNV | Missense_Mutation | novel | c.1666N>C | p.Glu556Gln | p.E556Q | Q15643 | protein_coding | deleterious(0) | probably_damaging(0.99) | TCGA-AC-A3W6-01 | Breast | breast invasive carcinoma | Female | >=65 | III/IV | Unknown | Unknown | SD |
| TRIP11 | SNV | Missense_Mutation | rs770545491 | c.5297N>G | p.Lys1766Arg | p.K1766R | Q15643 | protein_coding | tolerated(0.34) | benign(0.009) | TCGA-AN-A046-01 | Breast | breast invasive carcinoma | Female | >=65 | I/II | Unknown | Unknown | SD |
| TRIP11 | SNV | Missense_Mutation | c.3295N>A | p.Glu1099Lys | p.E1099K | Q15643 | protein_coding | deleterious(0) | possibly_damaging(0.731) | TCGA-BH-A0DZ-01 | Breast | breast invasive carcinoma | Female | <65 | I/II | Chemotherapy | docetaxel | SD | |
| TRIP11 | SNV | Missense_Mutation | c.5752N>A | p.Asp1918Asn | p.D1918N | Q15643 | protein_coding | tolerated(0.08) | possibly_damaging(0.864) | TCGA-BH-A0EE-01 | Breast | breast invasive carcinoma | Female | >=65 | I/II | Chemotherapy | docetaxel | SD | |
| TRIP11 | SNV | Missense_Mutation | c.40C>G | p.Gln14Glu | p.Q14E | Q15643 | protein_coding | tolerated(0.06) | benign(0.269) | TCGA-BH-A0W5-01 | Breast | breast invasive carcinoma | Female | >=65 | I/II | Hormone Therapy | arimidex | CR | |
| TRIP11 | SNV | Missense_Mutation | c.720N>C | p.Gln240His | p.Q240H | Q15643 | protein_coding | deleterious(0) | probably_damaging(0.996) | TCGA-D8-A1JA-01 | Breast | breast invasive carcinoma | Female | <65 | III/IV | Chemotherapy | adriamycin | PD | |
| TRIP11 | SNV | Missense_Mutation | c.3590N>A | p.Gly1197Glu | p.G1197E | Q15643 | protein_coding | deleterious(0.03) | probably_damaging(0.993) | TCGA-EW-A1IY-01 | Breast | breast invasive carcinoma | Female | <65 | I/II | Chemotherapy | taxotere | SD |
| Page: 1 2 3 4 5 6 7 8 9 10 11 12 13 14 15 16 17 18 19 20 |
Top |
Related drugs of malignant transformation related genes |
| Identification of chemicals and drugs interact with genes involved in malignant transfromation |
| (DGIdb 4.0) |
| Entrez ID | Symbol | Category | Interaction Types | Drug Claim Name | Drug Name | PMIDs |
| Page: 1 |

Copyright 2023-Present -The University of Texas Health Science Center at Houston |