
|
|||||
|
 | |
| |
| |
| |
| |
| |
|
Gene: TRAK2 |
Gene summary for TRAK2 |
| Gene information | Species | Human | Gene symbol | TRAK2 | Gene ID | 66008 |
| Gene name | trafficking kinesin protein 2 | |
| Gene Alias | ALS2CR3 | |
| Cytomap | 2q33.1 | |
| Gene Type | protein-coding | GO ID | GO:0000902 | UniProtAcc | O60296 |
Top |
Malignant transformation analysis |
| Identification of the aberrant gene expression in precancerous and cancerous lesions by comparing the gene expression of stem-like cells in diseased tissues with normal stem cells |
| Entrez ID | Symbol | Replicates | Species | Organ | Tissue | Adj P-value | Log2FC | Malignancy |
| 66008 | TRAK2 | LZE4T | Human | Esophagus | ESCC | 1.83e-02 | 1.54e-01 | 0.0811 |
| 66008 | TRAK2 | LZE5T | Human | Esophagus | ESCC | 2.53e-03 | 2.59e-01 | 0.0514 |
| 66008 | TRAK2 | LZE24T | Human | Esophagus | ESCC | 1.24e-10 | 2.23e-01 | 0.0596 |
| 66008 | TRAK2 | P2T-E | Human | Esophagus | ESCC | 2.36e-11 | 4.71e-02 | 0.1177 |
| 66008 | TRAK2 | P4T-E | Human | Esophagus | ESCC | 1.37e-10 | 2.85e-01 | 0.1323 |
| 66008 | TRAK2 | P5T-E | Human | Esophagus | ESCC | 2.11e-06 | 5.14e-02 | 0.1327 |
| 66008 | TRAK2 | P8T-E | Human | Esophagus | ESCC | 1.51e-13 | 1.98e-01 | 0.0889 |
| 66008 | TRAK2 | P10T-E | Human | Esophagus | ESCC | 3.77e-09 | 1.10e-01 | 0.116 |
| 66008 | TRAK2 | P11T-E | Human | Esophagus | ESCC | 2.86e-06 | 3.92e-01 | 0.1426 |
| 66008 | TRAK2 | P12T-E | Human | Esophagus | ESCC | 1.96e-15 | 3.07e-01 | 0.1122 |
| 66008 | TRAK2 | P15T-E | Human | Esophagus | ESCC | 2.57e-05 | 1.43e-01 | 0.1149 |
| 66008 | TRAK2 | P16T-E | Human | Esophagus | ESCC | 7.50e-03 | 6.43e-02 | 0.1153 |
| 66008 | TRAK2 | P20T-E | Human | Esophagus | ESCC | 1.46e-08 | 1.83e-01 | 0.1124 |
| 66008 | TRAK2 | P21T-E | Human | Esophagus | ESCC | 1.30e-09 | 1.75e-01 | 0.1617 |
| 66008 | TRAK2 | P22T-E | Human | Esophagus | ESCC | 1.49e-07 | 1.49e-01 | 0.1236 |
| 66008 | TRAK2 | P23T-E | Human | Esophagus | ESCC | 1.57e-02 | 6.98e-02 | 0.108 |
| 66008 | TRAK2 | P24T-E | Human | Esophagus | ESCC | 2.28e-06 | 1.01e-01 | 0.1287 |
| 66008 | TRAK2 | P26T-E | Human | Esophagus | ESCC | 7.44e-03 | 8.58e-02 | 0.1276 |
| 66008 | TRAK2 | P27T-E | Human | Esophagus | ESCC | 4.14e-14 | 1.72e-01 | 0.1055 |
| 66008 | TRAK2 | P28T-E | Human | Esophagus | ESCC | 1.22e-11 | 1.64e-01 | 0.1149 |
| Page: 1 2 3 4 |
| Tissue | Expression Dynamics | Abbreviation |
| Esophagus | 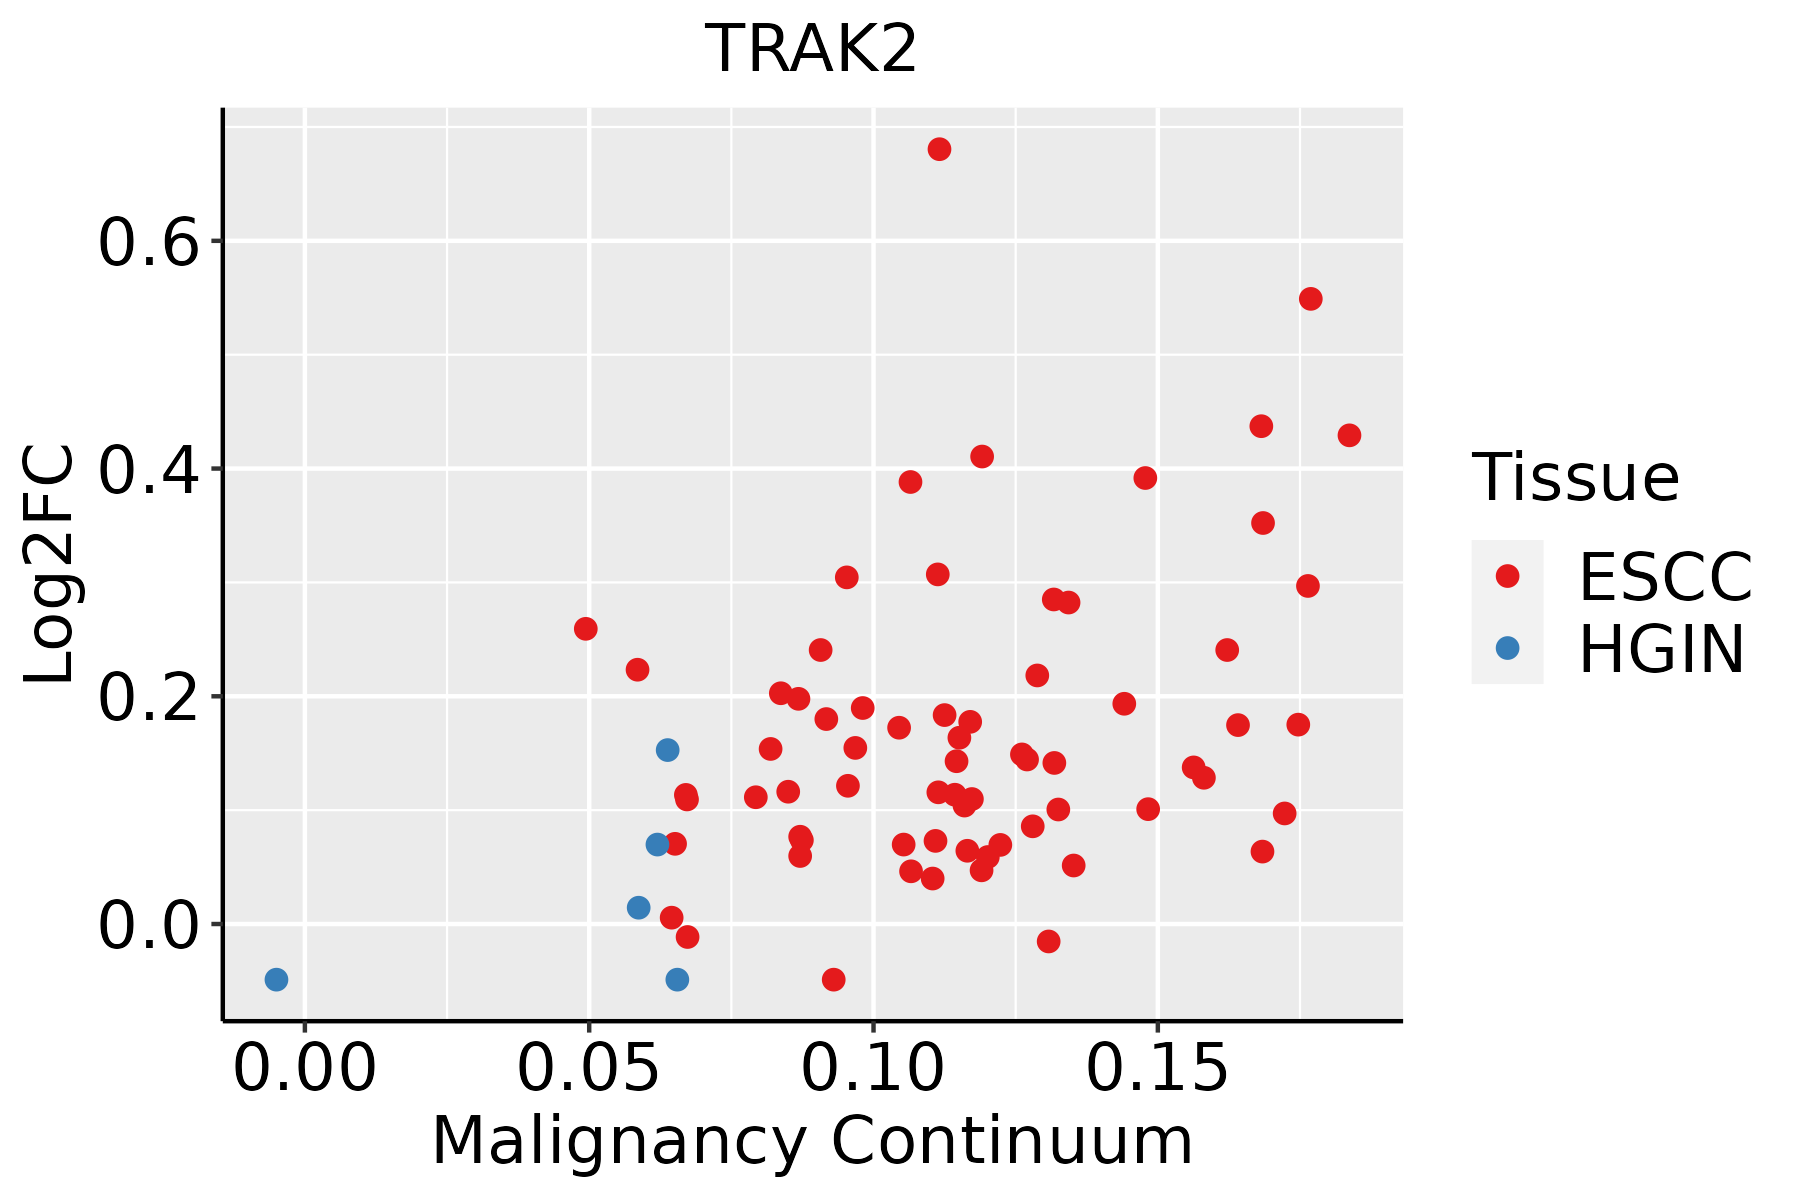 | ESCC: Esophageal squamous cell carcinoma |
| HGIN: High-grade intraepithelial neoplasias | ||
| LGIN: Low-grade intraepithelial neoplasias | ||
| Liver | 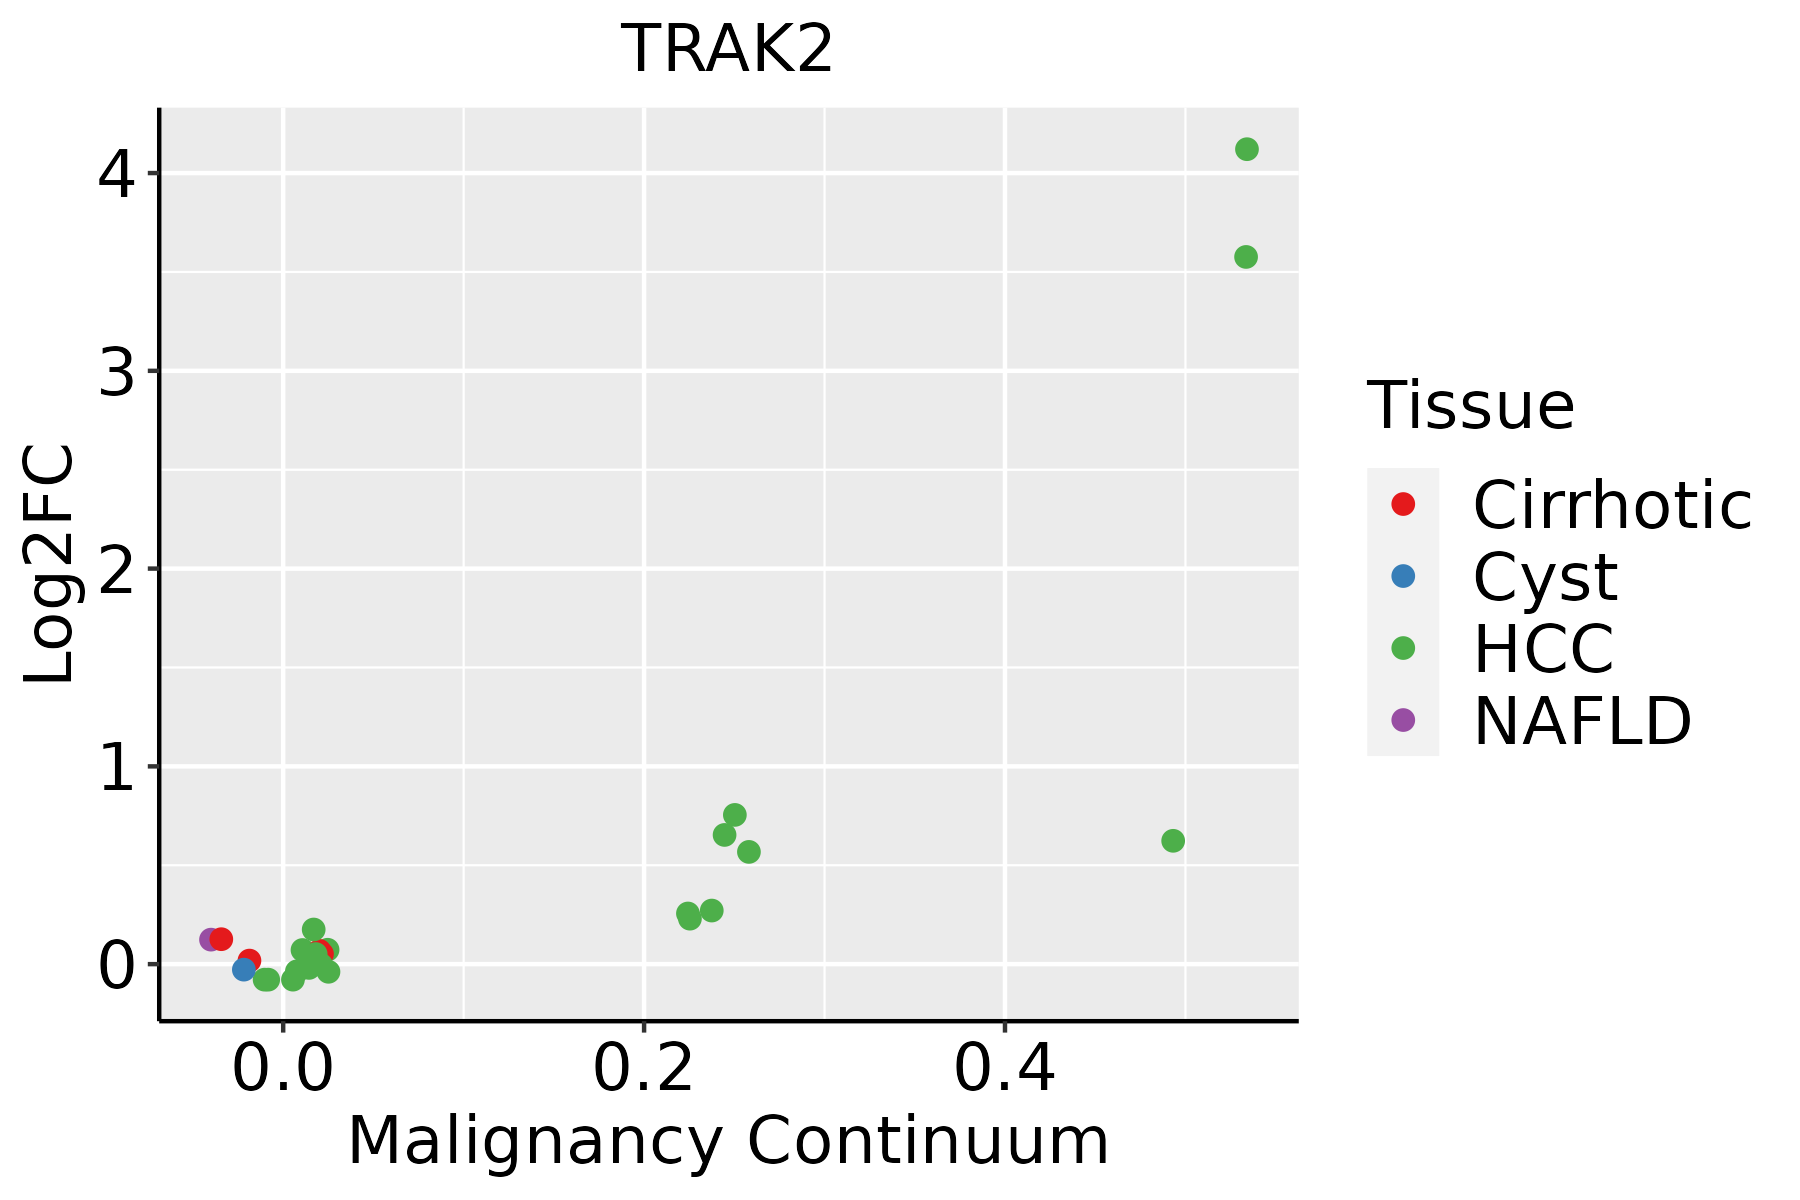 | HCC: Hepatocellular carcinoma |
| NAFLD: Non-alcoholic fatty liver disease | ||
| Thyroid | 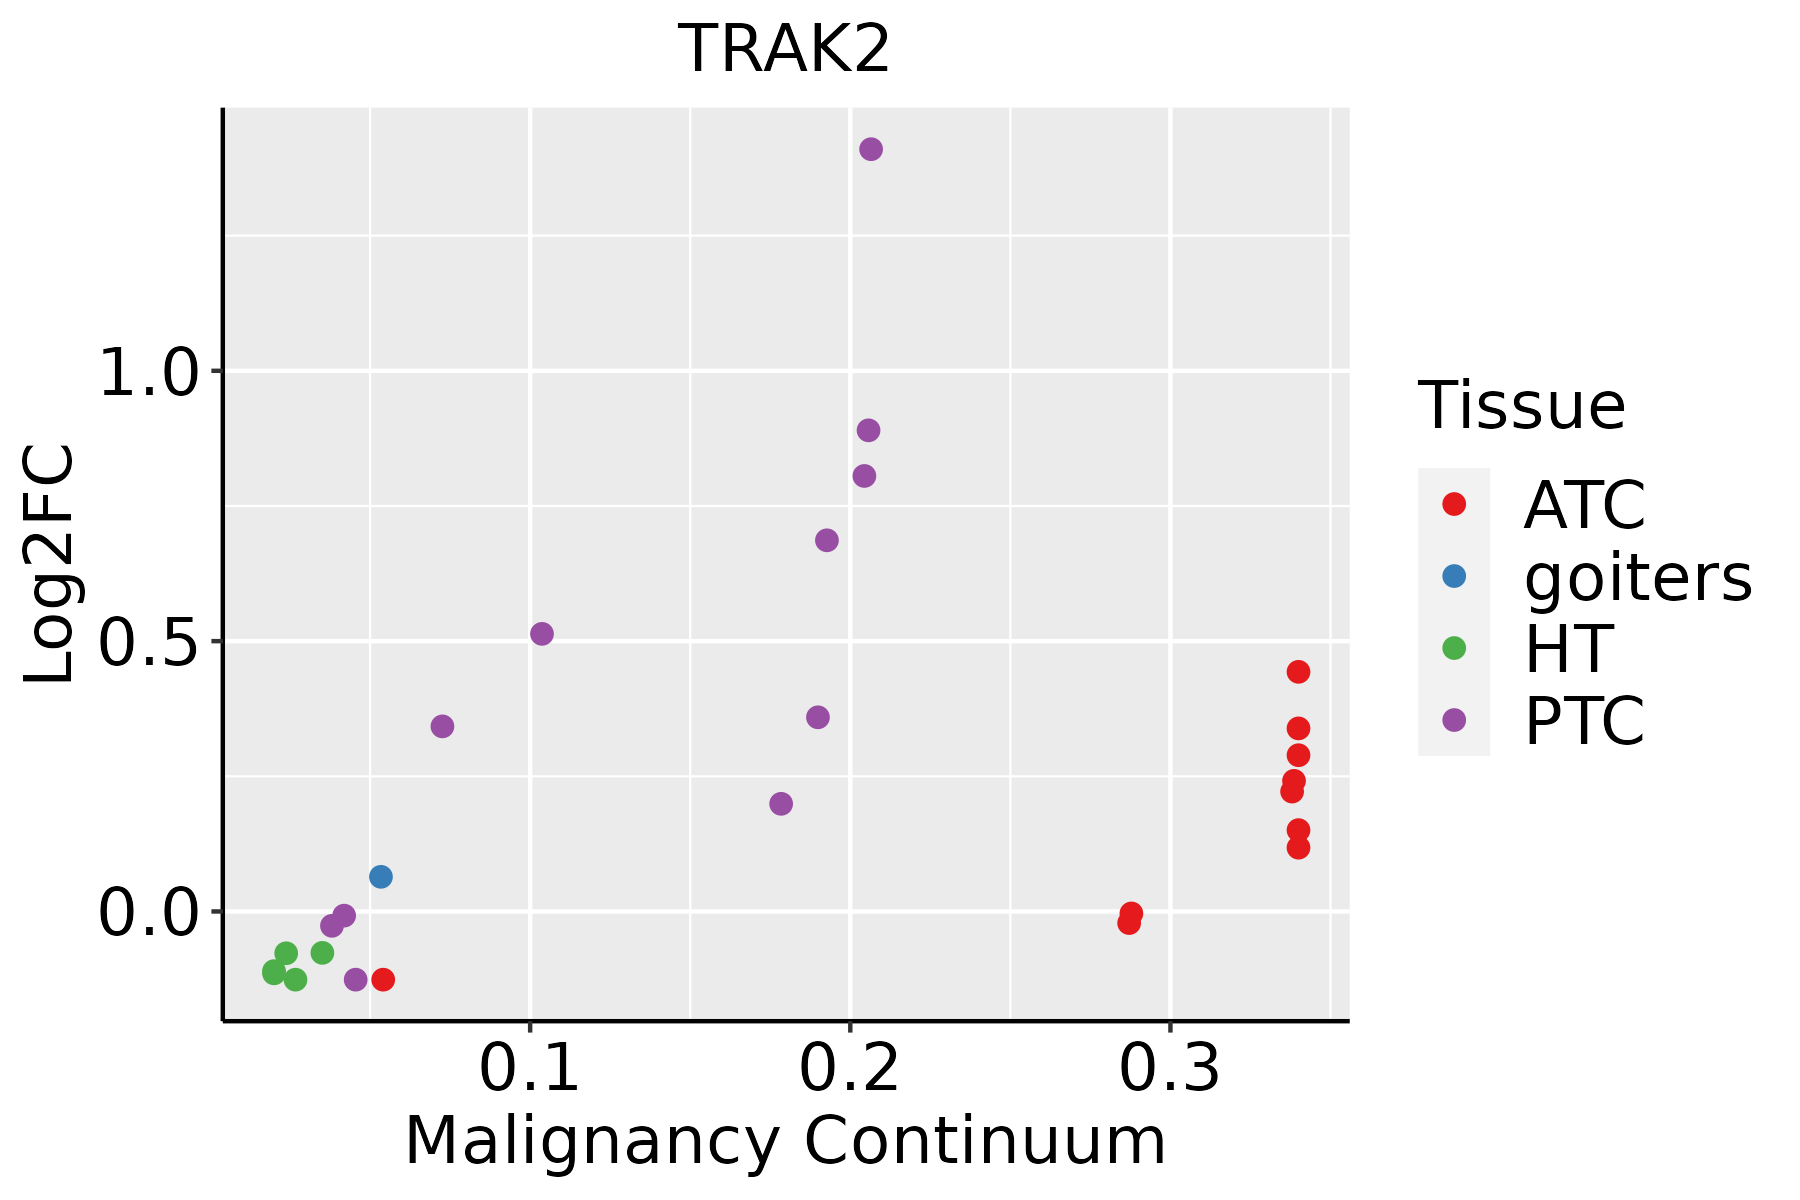 | ATC: Anaplastic thyroid cancer |
| HT: Hashimoto's thyroiditis | ||
| PTC: Papillary thyroid cancer |
| ∗log2FC in expression of this searched gene in stem-like cells from each diseased tissue sample relative to stem-like cells in normal samples in each tissue plotted against the malignancy continuum. Samples are colored based on if they are from different disease stage. |
Top |
Malignant transformation related pathway analysis |
| Find out the enriched GO biological processes and KEGG pathways involved in transition from healthy to precancer to cancer |
| Tissue | Disease Stage | Enriched GO biological Processes |
| Thyroid | PTC |  |
| Thyroid | goiters |  |
| Thyroid | ATC |  |
| ∗Top 15 enriched GO BP terms are showed in the bar plot of each disease state in each tissue. Each row represents a significant GO biological process which is colored according to the -log10(p.adjust). |
| Page: 1 2 3 4 5 6 7 8 9 |
| GO ID | Tissue | Disease Stage | Description | Gene Ratio | Bg Ratio | pvalue | p.adjust | Count |
| GO:0006605111 | Esophagus | ESCC | protein targeting | 229/8552 | 314/18723 | 4.93e-23 | 1.01e-20 | 229 |
| GO:005165617 | Esophagus | ESCC | establishment of organelle localization | 273/8552 | 390/18723 | 9.13e-23 | 1.81e-20 | 273 |
| GO:000703417 | Esophagus | ESCC | vacuolar transport | 119/8552 | 157/18723 | 1.16e-14 | 6.30e-13 | 119 |
| GO:005165016 | Esophagus | ESCC | establishment of vesicle localization | 114/8552 | 161/18723 | 8.20e-11 | 2.53e-09 | 114 |
| GO:003070518 | Esophagus | ESCC | cytoskeleton-dependent intracellular transport | 133/8552 | 195/18723 | 1.48e-10 | 4.27e-09 | 133 |
| GO:001097013 | Esophagus | ESCC | transport along microtubule | 107/8552 | 155/18723 | 3.17e-09 | 6.80e-08 | 107 |
| GO:00070419 | Esophagus | ESCC | lysosomal transport | 83/8552 | 114/18723 | 3.52e-09 | 7.41e-08 | 83 |
| GO:005164815 | Esophagus | ESCC | vesicle localization | 119/8552 | 177/18723 | 5.16e-09 | 1.08e-07 | 119 |
| GO:00723846 | Esophagus | ESCC | organelle transport along microtubule | 65/8552 | 85/18723 | 6.61e-09 | 1.35e-07 | 65 |
| GO:000808810 | Esophagus | ESCC | axo-dendritic transport | 58/8552 | 75/18723 | 2.09e-08 | 4.02e-07 | 58 |
| GO:00091002 | Esophagus | ESCC | glycoprotein metabolic process | 226/8552 | 387/18723 | 2.64e-07 | 3.94e-06 | 226 |
| GO:00989304 | Esophagus | ESCC | axonal transport | 49/8552 | 64/18723 | 4.54e-07 | 6.15e-06 | 49 |
| GO:00700854 | Esophagus | ESCC | glycosylation | 144/8552 | 240/18723 | 5.12e-06 | 5.38e-05 | 144 |
| GO:00064865 | Esophagus | ESCC | protein glycosylation | 135/8552 | 226/18723 | 1.36e-05 | 1.24e-04 | 135 |
| GO:00434135 | Esophagus | ESCC | macromolecule glycosylation | 135/8552 | 226/18723 | 1.36e-05 | 1.24e-04 | 135 |
| GO:00474962 | Esophagus | ESCC | vesicle transport along microtubule | 36/8552 | 47/18723 | 1.53e-05 | 1.38e-04 | 36 |
| GO:00991114 | Esophagus | ESCC | microtubule-based transport | 115/8552 | 190/18723 | 2.54e-05 | 2.15e-04 | 115 |
| GO:00091012 | Esophagus | ESCC | glycoprotein biosynthetic process | 181/8552 | 317/18723 | 2.54e-05 | 2.15e-04 | 181 |
| GO:00083333 | Esophagus | ESCC | endosome to lysosome transport | 40/8552 | 55/18723 | 4.27e-05 | 3.42e-04 | 40 |
| GO:00080892 | Esophagus | ESCC | anterograde axonal transport | 37/8552 | 50/18723 | 4.42e-05 | 3.51e-04 | 37 |
| Page: 1 2 3 4 5 6 7 |
| Pathway ID | Tissue | Disease Stage | Description | Gene Ratio | Bg Ratio | pvalue | p.adjust | qvalue | Count |
| Page: 1 |
Top |
Cell-cell communication analysis |
| Identification of potential cell-cell interactions between two cell types and their ligand-receptor pairs for different disease states |
| Ligand | Receptor | LRpair | Pathway | Tissue | Disease Stage |
| Page: 1 |
Top |
Single-cell gene regulatory network inference analysis |
| Find out the significant the regulons (TFs) and the target genes of each regulon across cell types for different disease states |
| TF | Cell Type | Tissue | Disease Stage | Target Gene | RSS | Regulon Activity |
| ∗The dot plots of a searched regulon are shown for all cell subpopulations in each disease state of each tissue based on the regulon specific score inferred using pySCENIC and by calculating the average expression. |
| Page: 1 |
Top |
Somatic mutation of malignant transformation related genes |
| Annotation of somatic variants for genes involved in malignant transformation |
| Hugo Symbol | Variant Class | Variant Classification | dbSNP RS | HGVSc | HGVSp | HGVSp Short | SWISSPROT | BIOTYPE | SIFT | PolyPhen | Tumor Sample Barcode | Tissue | Histology | Sex | Age | Stage | Therapy Types | Drugs | Outcome |
| TRAK2 | SNV | Missense_Mutation | novel | c.1044N>C | p.Lys348Asn | p.K348N | O60296 | protein_coding | deleterious(0) | probably_damaging(0.966) | TCGA-A2-A3XY-01 | Breast | breast invasive carcinoma | Female | <65 | I/II | Chemotherapy | adriamycin | PD |
| TRAK2 | SNV | Missense_Mutation | c.202G>C | p.Asp68His | p.D68H | O60296 | protein_coding | deleterious(0) | probably_damaging(0.977) | TCGA-A8-A08P-01 | Breast | breast invasive carcinoma | Female | >=65 | III/IV | Chemotherapy | 5-fluorouracil | CR | |
| TRAK2 | SNV | Missense_Mutation | c.1327N>C | p.Glu443Gln | p.E443Q | O60296 | protein_coding | tolerated(0.59) | benign(0.011) | TCGA-AC-A23H-01 | Breast | breast invasive carcinoma | Female | >=65 | I/II | Unknown | Unknown | PD | |
| TRAK2 | SNV | Missense_Mutation | rs774108541 | c.836N>A | p.Arg279Gln | p.R279Q | O60296 | protein_coding | deleterious(0.01) | probably_damaging(0.938) | TCGA-AC-A23H-01 | Breast | breast invasive carcinoma | Female | >=65 | I/II | Unknown | Unknown | PD |
| TRAK2 | SNV | Missense_Mutation | novel | c.2135N>A | p.Ser712Tyr | p.S712Y | O60296 | protein_coding | deleterious(0) | possibly_damaging(0.883) | TCGA-AN-A046-01 | Breast | breast invasive carcinoma | Female | >=65 | I/II | Unknown | Unknown | SD |
| TRAK2 | SNV | Missense_Mutation | rs201575231 | c.1763N>A | p.Arg588Gln | p.R588Q | O60296 | protein_coding | deleterious(0) | possibly_damaging(0.878) | TCGA-AN-A046-01 | Breast | breast invasive carcinoma | Female | >=65 | I/II | Unknown | Unknown | SD |
| TRAK2 | SNV | Missense_Mutation | novel | c.1118N>A | p.Ser373Tyr | p.S373Y | O60296 | protein_coding | deleterious(0) | probably_damaging(0.997) | TCGA-AN-A046-01 | Breast | breast invasive carcinoma | Female | >=65 | I/II | Unknown | Unknown | SD |
| TRAK2 | SNV | Missense_Mutation | c.1116N>C | p.Glu372Asp | p.E372D | O60296 | protein_coding | tolerated(1) | benign(0.003) | TCGA-B6-A0RL-01 | Breast | breast invasive carcinoma | Female | <65 | I/II | Unknown | Unknown | SD | |
| TRAK2 | SNV | Missense_Mutation | c.2517N>C | p.Lys839Asn | p.K839N | O60296 | protein_coding | deleterious(0) | probably_damaging(0.966) | TCGA-D8-A1J8-01 | Breast | breast invasive carcinoma | Female | >=65 | I/II | Hormone Therapy | nolvadex | SD | |
| TRAK2 | SNV | Missense_Mutation | c.2197N>G | p.Thr733Ala | p.T733A | O60296 | protein_coding | tolerated(0.38) | benign(0.006) | TCGA-E2-A1IH-01 | Breast | breast invasive carcinoma | Female | >=65 | I/II | Hormone Therapy | aromasin | SD |
| Page: 1 2 3 4 5 6 7 8 9 |
Top |
Related drugs of malignant transformation related genes |
| Identification of chemicals and drugs interact with genes involved in malignant transfromation |
| (DGIdb 4.0) |
| Entrez ID | Symbol | Category | Interaction Types | Drug Claim Name | Drug Name | PMIDs |
| Page: 1 |

Copyright 2023-Present -The University of Texas Health Science Center at Houston |