
|
|||||
|
 | |
| |
| |
| |
| |
| |
|
Gene: TCIM |
Gene summary for TCIM |
| Gene information | Species | Human | Gene symbol | TCIM | Gene ID | 56892 |
| Gene name | transcriptional and immune response regulator | |
| Gene Alias | C8orf4 | |
| Cytomap | 8p11.21 | |
| Gene Type | protein-coding | GO ID | GO:0001775 | UniProtAcc | Q9NR00 |
Top |
Malignant transformation analysis |
| Identification of the aberrant gene expression in precancerous and cancerous lesions by comparing the gene expression of stem-like cells in diseased tissues with normal stem cells |
| Entrez ID | Symbol | Replicates | Species | Organ | Tissue | Adj P-value | Log2FC | Malignancy |
| 56892 | TCIM | GSM4909281 | Human | Breast | IDC | 1.32e-08 | -2.92e-01 | 0.21 |
| 56892 | TCIM | GSM4909282 | Human | Breast | IDC | 2.03e-06 | -2.83e-01 | -0.0288 |
| 56892 | TCIM | GSM4909285 | Human | Breast | IDC | 5.27e-08 | -2.79e-01 | 0.21 |
| 56892 | TCIM | GSM4909286 | Human | Breast | IDC | 3.52e-11 | -3.01e-01 | 0.1081 |
| 56892 | TCIM | GSM4909293 | Human | Breast | IDC | 7.59e-03 | -2.07e-01 | 0.1581 |
| 56892 | TCIM | GSM4909296 | Human | Breast | IDC | 1.49e-06 | -2.79e-01 | 0.1524 |
| 56892 | TCIM | GSM4909297 | Human | Breast | IDC | 7.24e-29 | 9.95e-01 | 0.1517 |
| 56892 | TCIM | GSM4909298 | Human | Breast | IDC | 1.31e-08 | -2.93e-01 | 0.1551 |
| 56892 | TCIM | GSM4909301 | Human | Breast | IDC | 2.28e-07 | -2.88e-01 | 0.1577 |
| 56892 | TCIM | GSM4909306 | Human | Breast | IDC | 1.10e-11 | 5.06e-01 | 0.1564 |
| 56892 | TCIM | GSM4909307 | Human | Breast | IDC | 1.16e-13 | 5.51e-01 | 0.1569 |
| 56892 | TCIM | GSM4909308 | Human | Breast | IDC | 5.89e-78 | 1.09e+00 | 0.158 |
| 56892 | TCIM | GSM4909311 | Human | Breast | IDC | 5.26e-07 | -2.64e-01 | 0.1534 |
| 56892 | TCIM | GSM4909312 | Human | Breast | IDC | 9.03e-06 | -2.57e-01 | 0.1552 |
| 56892 | TCIM | GSM4909315 | Human | Breast | IDC | 8.04e-10 | -2.99e-01 | 0.21 |
| 56892 | TCIM | GSM4909319 | Human | Breast | IDC | 8.04e-10 | -2.97e-01 | 0.1563 |
| 56892 | TCIM | GSM4909321 | Human | Breast | IDC | 3.52e-11 | -3.01e-01 | 0.1559 |
| 56892 | TCIM | ctrl6 | Human | Breast | Precancer | 1.64e-13 | 6.41e-01 | -0.0061 |
| 56892 | TCIM | brca1 | Human | Breast | Precancer | 1.69e-10 | -3.01e-01 | -0.0338 |
| 56892 | TCIM | brca2 | Human | Breast | Precancer | 3.80e-09 | -3.01e-01 | -0.024 |
| Page: 1 2 3 4 5 6 7 8 |
| Tissue | Expression Dynamics | Abbreviation |
| Breast | 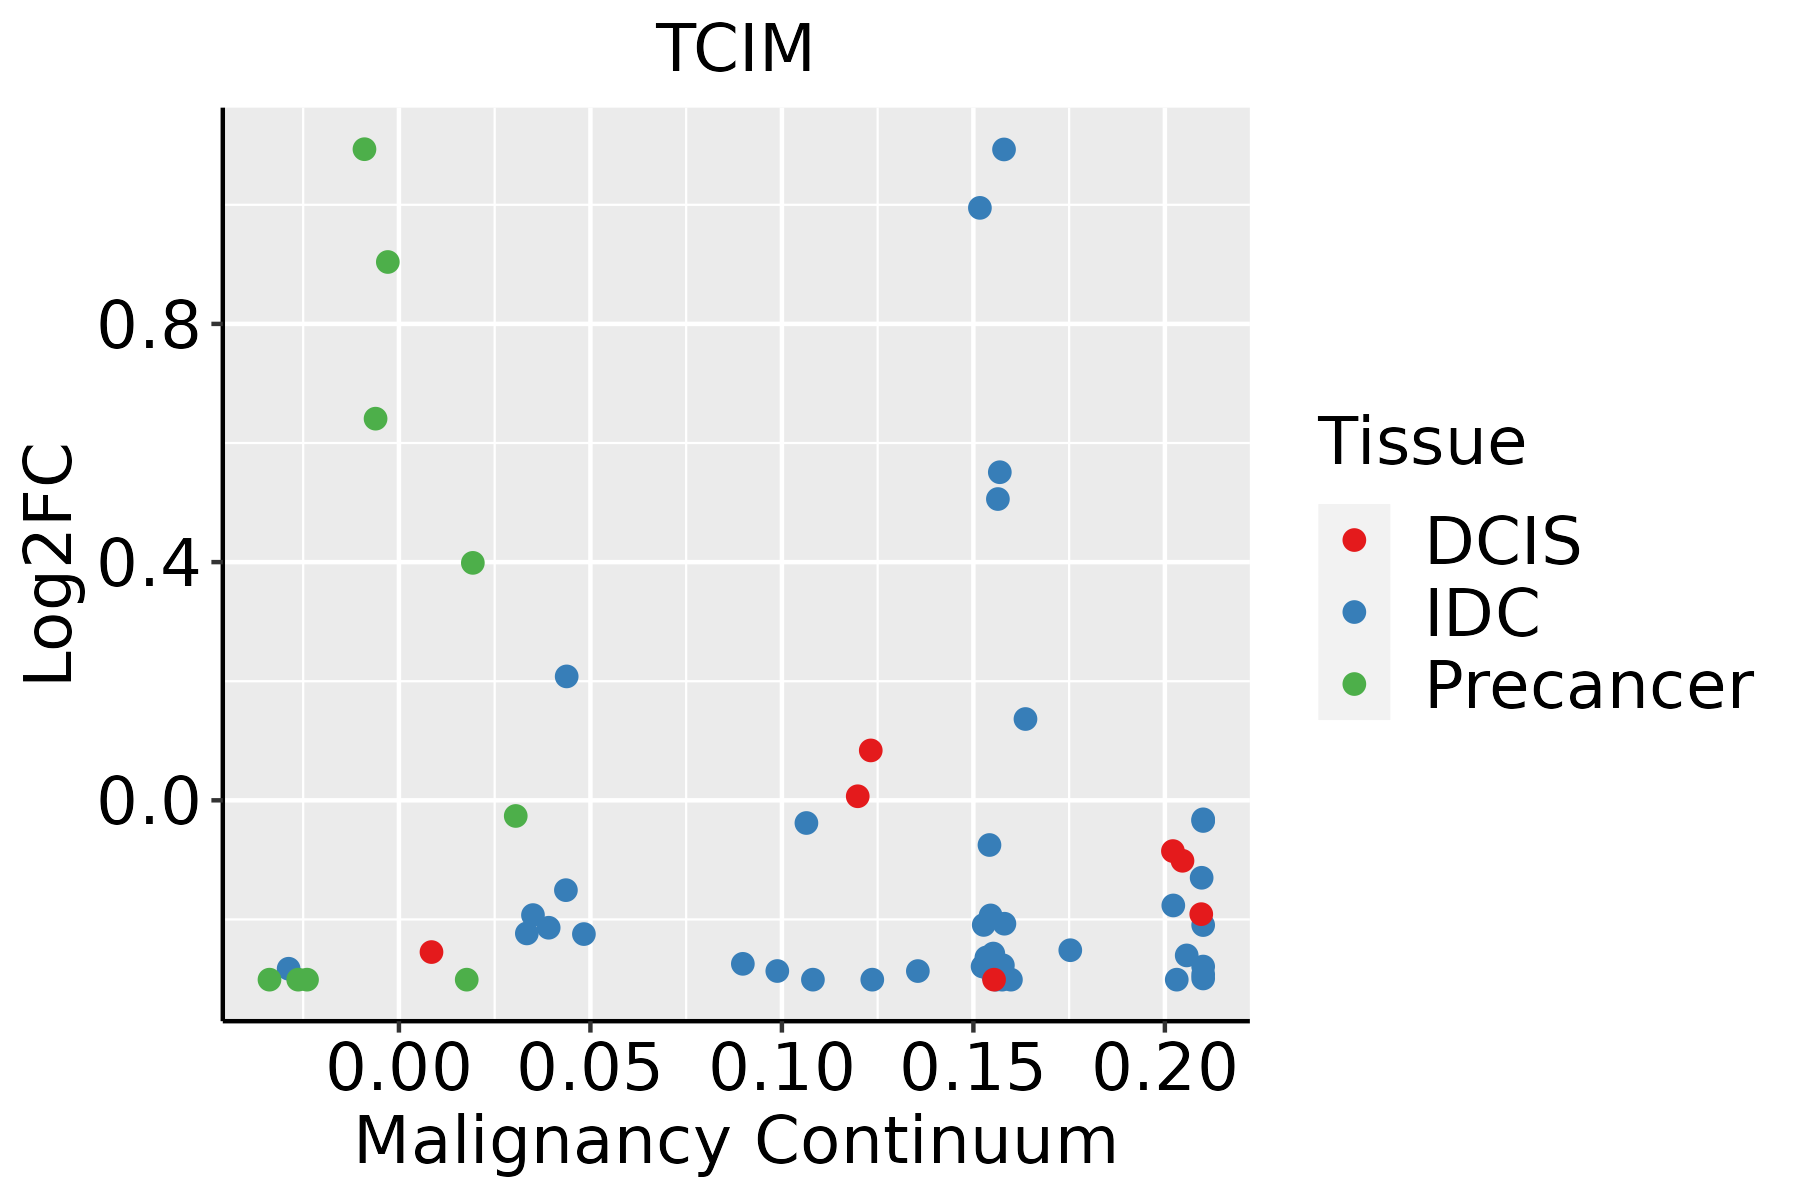 | IDC: Invasive ductal carcinoma |
| DCIS: Ductal carcinoma in situ | ||
| Precancer(BRCA1-mut): Precancerous lesion from BRCA1 mutation carriers | ||
| Cervix |  | CC: Cervix cancer |
| HSIL_HPV: HPV-infected high-grade squamous intraepithelial lesions | ||
| N_HPV: HPV-infected normal cervix | ||
| Endometrium |  | AEH: Atypical endometrial hyperplasia |
| EEC: Endometrioid Cancer | ||
| Esophagus | 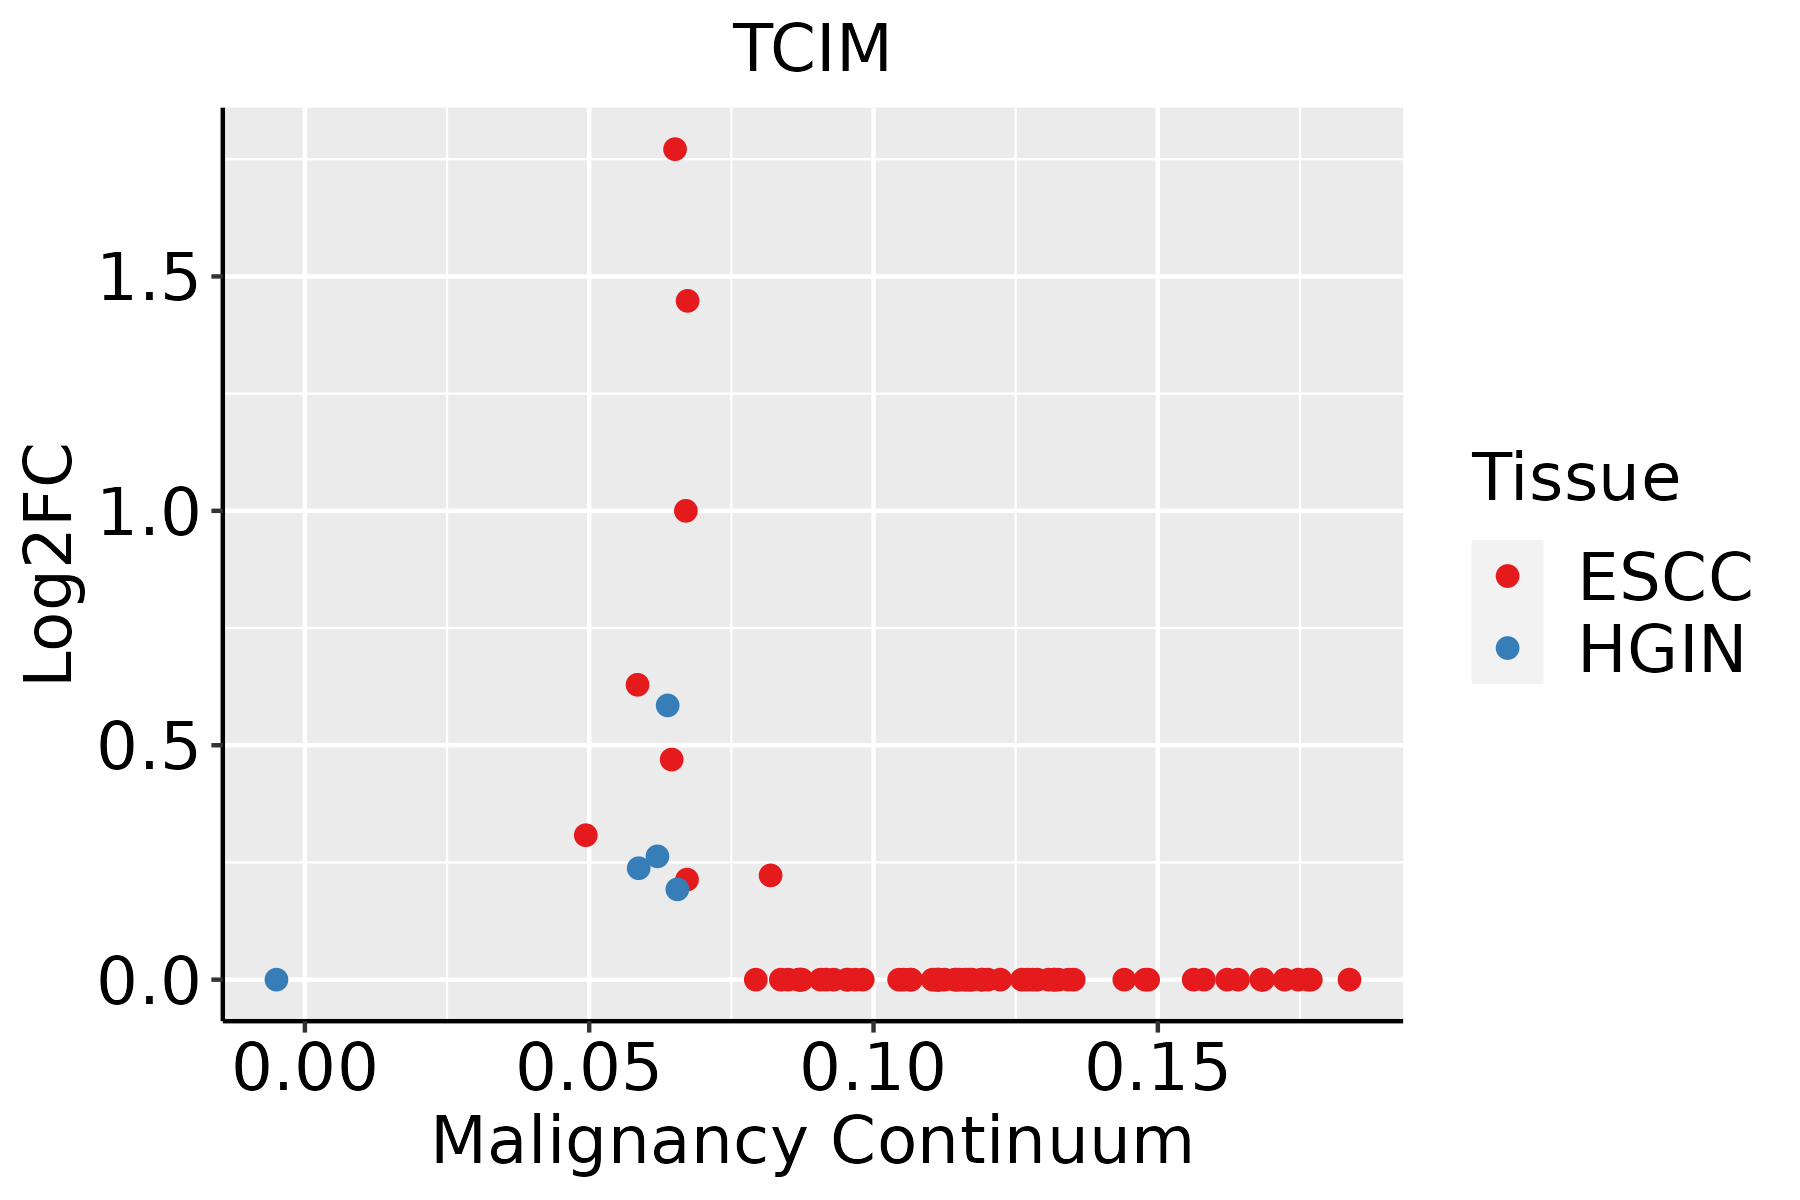 | ESCC: Esophageal squamous cell carcinoma |
| HGIN: High-grade intraepithelial neoplasias | ||
| LGIN: Low-grade intraepithelial neoplasias | ||
| GC |  | CAG: Chronic atrophic gastritis |
| CAG with IM: Chronic atrophic gastritis with intestinal metaplasia | ||
| CSG: Chronic superficial gastritis | ||
| GC: Gastric cancer | ||
| SIM: Severe intestinal metaplasia | ||
| WIM: Wild intestinal metaplasia | ||
| Liver | 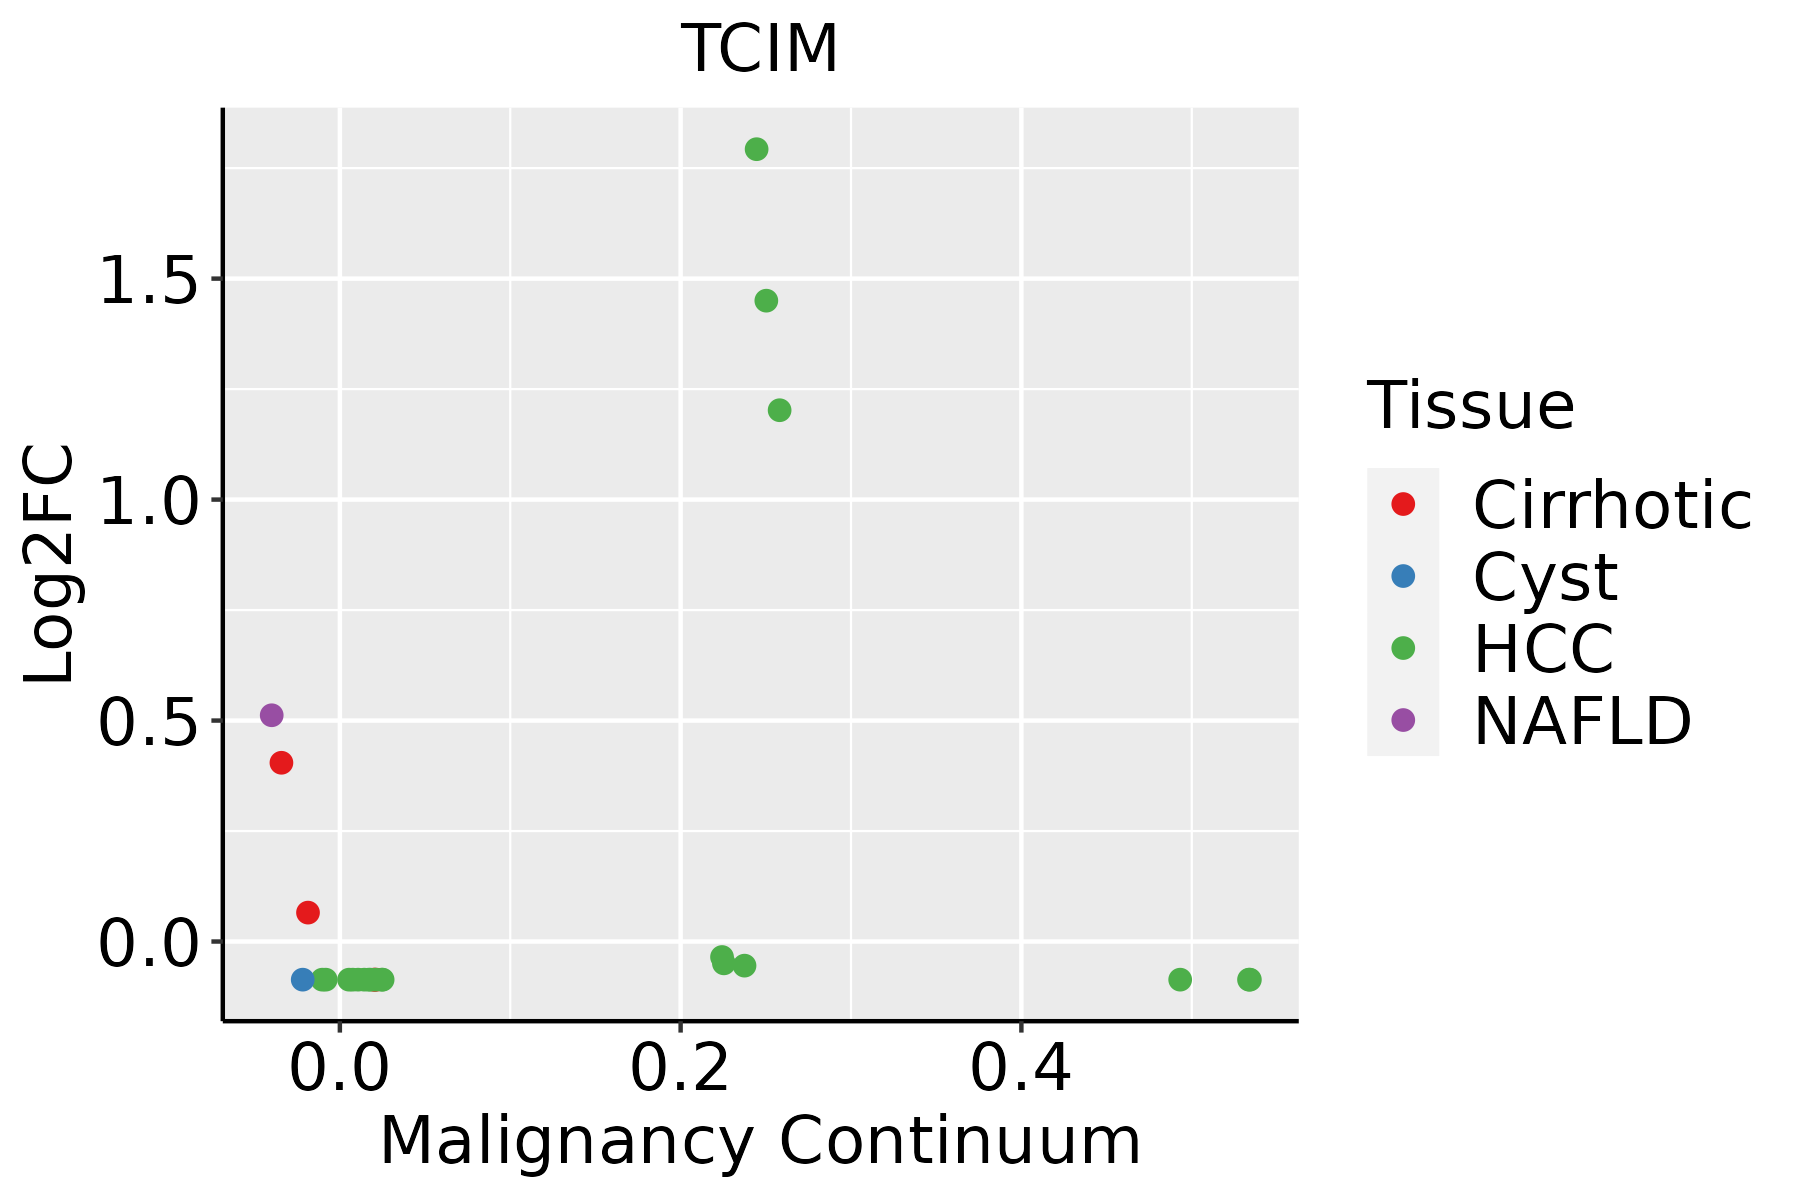 | HCC: Hepatocellular carcinoma |
| NAFLD: Non-alcoholic fatty liver disease | ||
| Lung |  | AAH: Atypical adenomatous hyperplasia |
| AIS: Adenocarcinoma in situ | ||
| IAC: Invasive lung adenocarcinoma | ||
| MIA: Minimally invasive adenocarcinoma | ||
| Prostate |  | BPH: Benign Prostatic Hyperplasia |
| Thyroid | 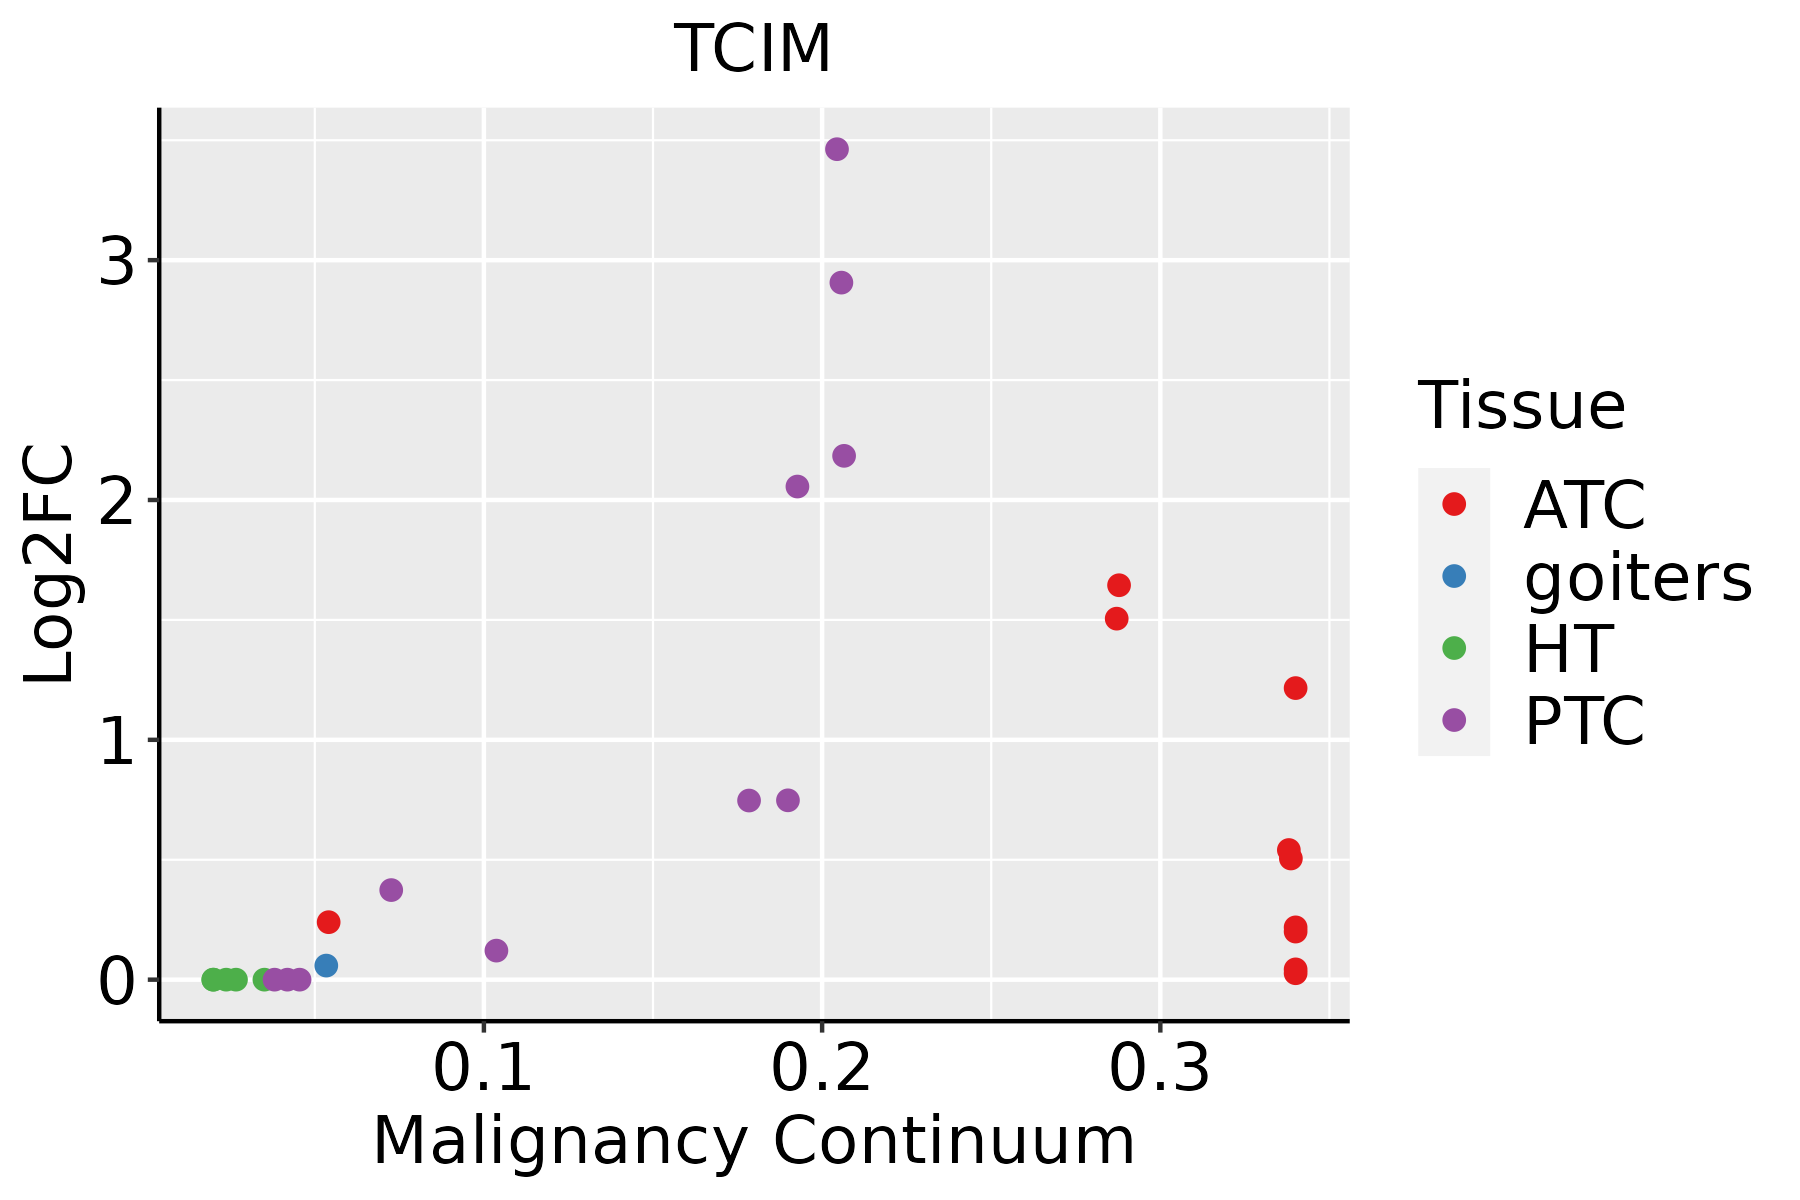 | ATC: Anaplastic thyroid cancer |
| HT: Hashimoto's thyroiditis | ||
| PTC: Papillary thyroid cancer |
| ∗log2FC in expression of this searched gene in stem-like cells from each diseased tissue sample relative to stem-like cells in normal samples in each tissue plotted against the malignancy continuum. Samples are colored based on if they are from different disease stage. |
Top |
Malignant transformation related pathway analysis |
| Find out the enriched GO biological processes and KEGG pathways involved in transition from healthy to precancer to cancer |
| Tissue | Disease Stage | Enriched GO biological Processes |
| Thyroid | PTC |  |
| Thyroid | goiters |  |
| Thyroid | ATC |  |
| ∗Top 15 enriched GO BP terms are showed in the bar plot of each disease state in each tissue. Each row represents a significant GO biological process which is colored according to the -log10(p.adjust). |
| Page: 1 2 3 4 5 6 7 8 9 |
| GO ID | Tissue | Disease Stage | Description | Gene Ratio | Bg Ratio | pvalue | p.adjust | Count |
| GO:00092667 | Breast | Precancer | response to temperature stimulus | 27/1080 | 178/18723 | 3.85e-06 | 1.21e-04 | 27 |
| GO:00436209 | Breast | Precancer | regulation of DNA-templated transcription in response to stress | 13/1080 | 53/18723 | 7.06e-06 | 1.95e-04 | 13 |
| GO:00346059 | Breast | Precancer | cellular response to heat | 15/1080 | 69/18723 | 7.08e-06 | 1.95e-04 | 15 |
| GO:00094088 | Breast | Precancer | response to heat | 18/1080 | 110/18723 | 5.57e-05 | 1.15e-03 | 18 |
| GO:00336749 | Breast | Precancer | positive regulation of kinase activity | 42/1080 | 467/18723 | 2.94e-03 | 2.54e-02 | 42 |
| GO:000926612 | Breast | IDC | response to temperature stimulus | 34/1434 | 178/18723 | 5.88e-07 | 2.83e-05 | 34 |
| GO:003460513 | Breast | IDC | cellular response to heat | 17/1434 | 69/18723 | 1.26e-05 | 3.29e-04 | 17 |
| GO:000940812 | Breast | IDC | response to heat | 21/1434 | 110/18723 | 8.12e-05 | 1.60e-03 | 21 |
| GO:004362014 | Breast | IDC | regulation of DNA-templated transcription in response to stress | 13/1434 | 53/18723 | 1.37e-04 | 2.47e-03 | 13 |
| GO:003367410 | Cervix | CC | positive regulation of kinase activity | 101/2311 | 467/18723 | 8.66e-09 | 7.22e-07 | 101 |
| GO:00458608 | Cervix | CC | positive regulation of protein kinase activity | 85/2311 | 386/18723 | 5.61e-08 | 3.29e-06 | 85 |
| GO:004362010 | Cervix | CC | regulation of DNA-templated transcription in response to stress | 22/2311 | 53/18723 | 9.29e-08 | 5.19e-06 | 22 |
| GO:00719007 | Cervix | CC | regulation of protein serine/threonine kinase activity | 75/2311 | 359/18723 | 2.76e-06 | 8.02e-05 | 75 |
| GO:19028062 | Cervix | CC | regulation of cell cycle G1/S phase transition | 41/2311 | 168/18723 | 1.18e-05 | 2.51e-04 | 41 |
| GO:003460510 | Cervix | CC | cellular response to heat | 22/2311 | 69/18723 | 1.65e-05 | 3.20e-04 | 22 |
| GO:00448434 | Cervix | CC | cell cycle G1/S phase transition | 53/2311 | 241/18723 | 1.76e-05 | 3.32e-04 | 53 |
| GO:00719025 | Cervix | CC | positive regulation of protein serine/threonine kinase activity | 46/2311 | 200/18723 | 1.87e-05 | 3.47e-04 | 46 |
| GO:19019873 | Cervix | CC | regulation of cell cycle phase transition | 74/2311 | 390/18723 | 9.80e-05 | 1.27e-03 | 74 |
| GO:00072194 | Cervix | CC | Notch signaling pathway | 39/2311 | 172/18723 | 1.08e-04 | 1.38e-03 | 39 |
| GO:00085933 | Cervix | CC | regulation of Notch signaling pathway | 25/2311 | 95/18723 | 1.61e-04 | 1.93e-03 | 25 |
| Page: 1 2 3 4 5 6 7 8 9 |
| Pathway ID | Tissue | Disease Stage | Description | Gene Ratio | Bg Ratio | pvalue | p.adjust | qvalue | Count |
| Page: 1 |
Top |
Cell-cell communication analysis |
| Identification of potential cell-cell interactions between two cell types and their ligand-receptor pairs for different disease states |
| Ligand | Receptor | LRpair | Pathway | Tissue | Disease Stage |
| Page: 1 |
Top |
Single-cell gene regulatory network inference analysis |
| Find out the significant the regulons (TFs) and the target genes of each regulon across cell types for different disease states |
| TF | Cell Type | Tissue | Disease Stage | Target Gene | RSS | Regulon Activity |
| ∗The dot plots of a searched regulon are shown for all cell subpopulations in each disease state of each tissue based on the regulon specific score inferred using pySCENIC and by calculating the average expression. |
| Page: 1 |
Top |
Somatic mutation of malignant transformation related genes |
| Annotation of somatic variants for genes involved in malignant transformation |
| Hugo Symbol | Variant Class | Variant Classification | dbSNP RS | HGVSc | HGVSp | HGVSp Short | SWISSPROT | BIOTYPE | SIFT | PolyPhen | Tumor Sample Barcode | Tissue | Histology | Sex | Age | Stage | Therapy Types | Drugs | Outcome |
| Page: 1 |
Top |
Related drugs of malignant transformation related genes |
| Identification of chemicals and drugs interact with genes involved in malignant transfromation |
| (DGIdb 4.0) |
| Entrez ID | Symbol | Category | Interaction Types | Drug Claim Name | Drug Name | PMIDs |
| 56892 | TCIM | NA | ANTIANGIOGENIC | 15289477 |
| Page: 1 |

Copyright 2023-Present -The University of Texas Health Science Center at Houston |