
|
|||||
|
 | |
| |
| |
| |
| |
| |
|
Gene: TCHP |
Gene summary for TCHP |
| Gene information | Species | Human | Gene symbol | TCHP | Gene ID | 84260 |
| Gene name | trichoplein keratin filament binding | |
| Gene Alias | TpMs | |
| Cytomap | 12q24.11 | |
| Gene Type | protein-coding | GO ID | GO:0001558 | UniProtAcc | A0A024RBM9 |
Top |
Malignant transformation analysis |
| Identification of the aberrant gene expression in precancerous and cancerous lesions by comparing the gene expression of stem-like cells in diseased tissues with normal stem cells |
| Entrez ID | Symbol | Replicates | Species | Organ | Tissue | Adj P-value | Log2FC | Malignancy |
| 84260 | TCHP | LZE7T | Human | Esophagus | ESCC | 1.64e-08 | 3.73e-01 | 0.0667 |
| 84260 | TCHP | LZE24T | Human | Esophagus | ESCC | 4.53e-08 | 3.07e-01 | 0.0596 |
| 84260 | TCHP | P1T-E | Human | Esophagus | ESCC | 3.12e-05 | 2.49e-01 | 0.0875 |
| 84260 | TCHP | P2T-E | Human | Esophagus | ESCC | 5.17e-34 | 5.91e-01 | 0.1177 |
| 84260 | TCHP | P4T-E | Human | Esophagus | ESCC | 2.98e-17 | 3.94e-01 | 0.1323 |
| 84260 | TCHP | P5T-E | Human | Esophagus | ESCC | 2.47e-16 | 3.07e-01 | 0.1327 |
| 84260 | TCHP | P8T-E | Human | Esophagus | ESCC | 4.37e-05 | 1.23e-01 | 0.0889 |
| 84260 | TCHP | P9T-E | Human | Esophagus | ESCC | 3.32e-06 | 2.11e-01 | 0.1131 |
| 84260 | TCHP | P10T-E | Human | Esophagus | ESCC | 1.64e-11 | 2.34e-01 | 0.116 |
| 84260 | TCHP | P11T-E | Human | Esophagus | ESCC | 7.40e-08 | 3.79e-01 | 0.1426 |
| 84260 | TCHP | P12T-E | Human | Esophagus | ESCC | 4.53e-06 | 1.76e-01 | 0.1122 |
| 84260 | TCHP | P15T-E | Human | Esophagus | ESCC | 1.09e-08 | 2.31e-01 | 0.1149 |
| 84260 | TCHP | P16T-E | Human | Esophagus | ESCC | 1.04e-13 | 2.78e-01 | 0.1153 |
| 84260 | TCHP | P17T-E | Human | Esophagus | ESCC | 1.01e-02 | 3.48e-01 | 0.1278 |
| 84260 | TCHP | P20T-E | Human | Esophagus | ESCC | 3.90e-14 | 2.69e-01 | 0.1124 |
| 84260 | TCHP | P21T-E | Human | Esophagus | ESCC | 1.41e-11 | 3.05e-01 | 0.1617 |
| 84260 | TCHP | P22T-E | Human | Esophagus | ESCC | 2.14e-09 | 2.39e-01 | 0.1236 |
| 84260 | TCHP | P23T-E | Human | Esophagus | ESCC | 3.53e-14 | 3.20e-01 | 0.108 |
| 84260 | TCHP | P24T-E | Human | Esophagus | ESCC | 6.29e-06 | 1.98e-01 | 0.1287 |
| 84260 | TCHP | P26T-E | Human | Esophagus | ESCC | 1.38e-08 | 2.22e-01 | 0.1276 |
| Page: 1 2 3 4 |
| Tissue | Expression Dynamics | Abbreviation |
| Esophagus | 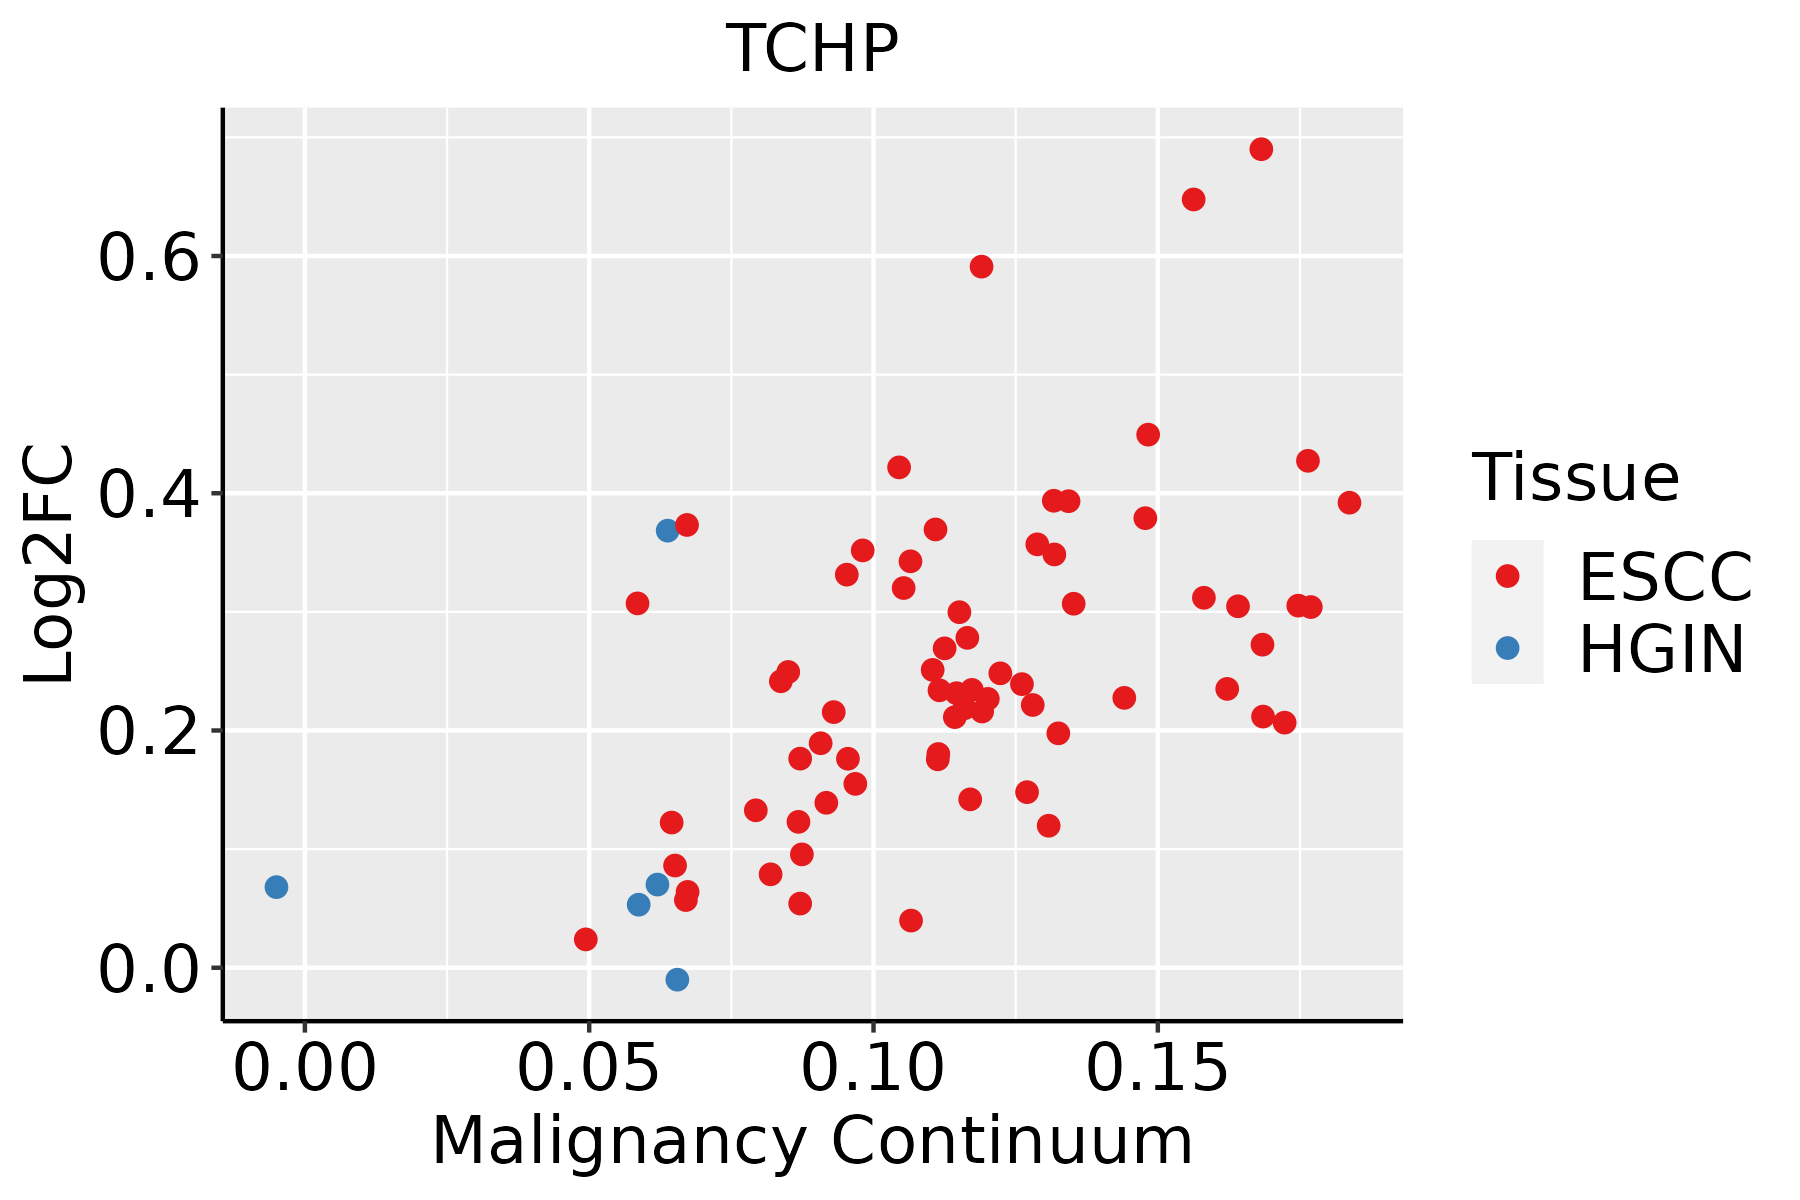 | ESCC: Esophageal squamous cell carcinoma |
| HGIN: High-grade intraepithelial neoplasias | ||
| LGIN: Low-grade intraepithelial neoplasias | ||
| Liver | 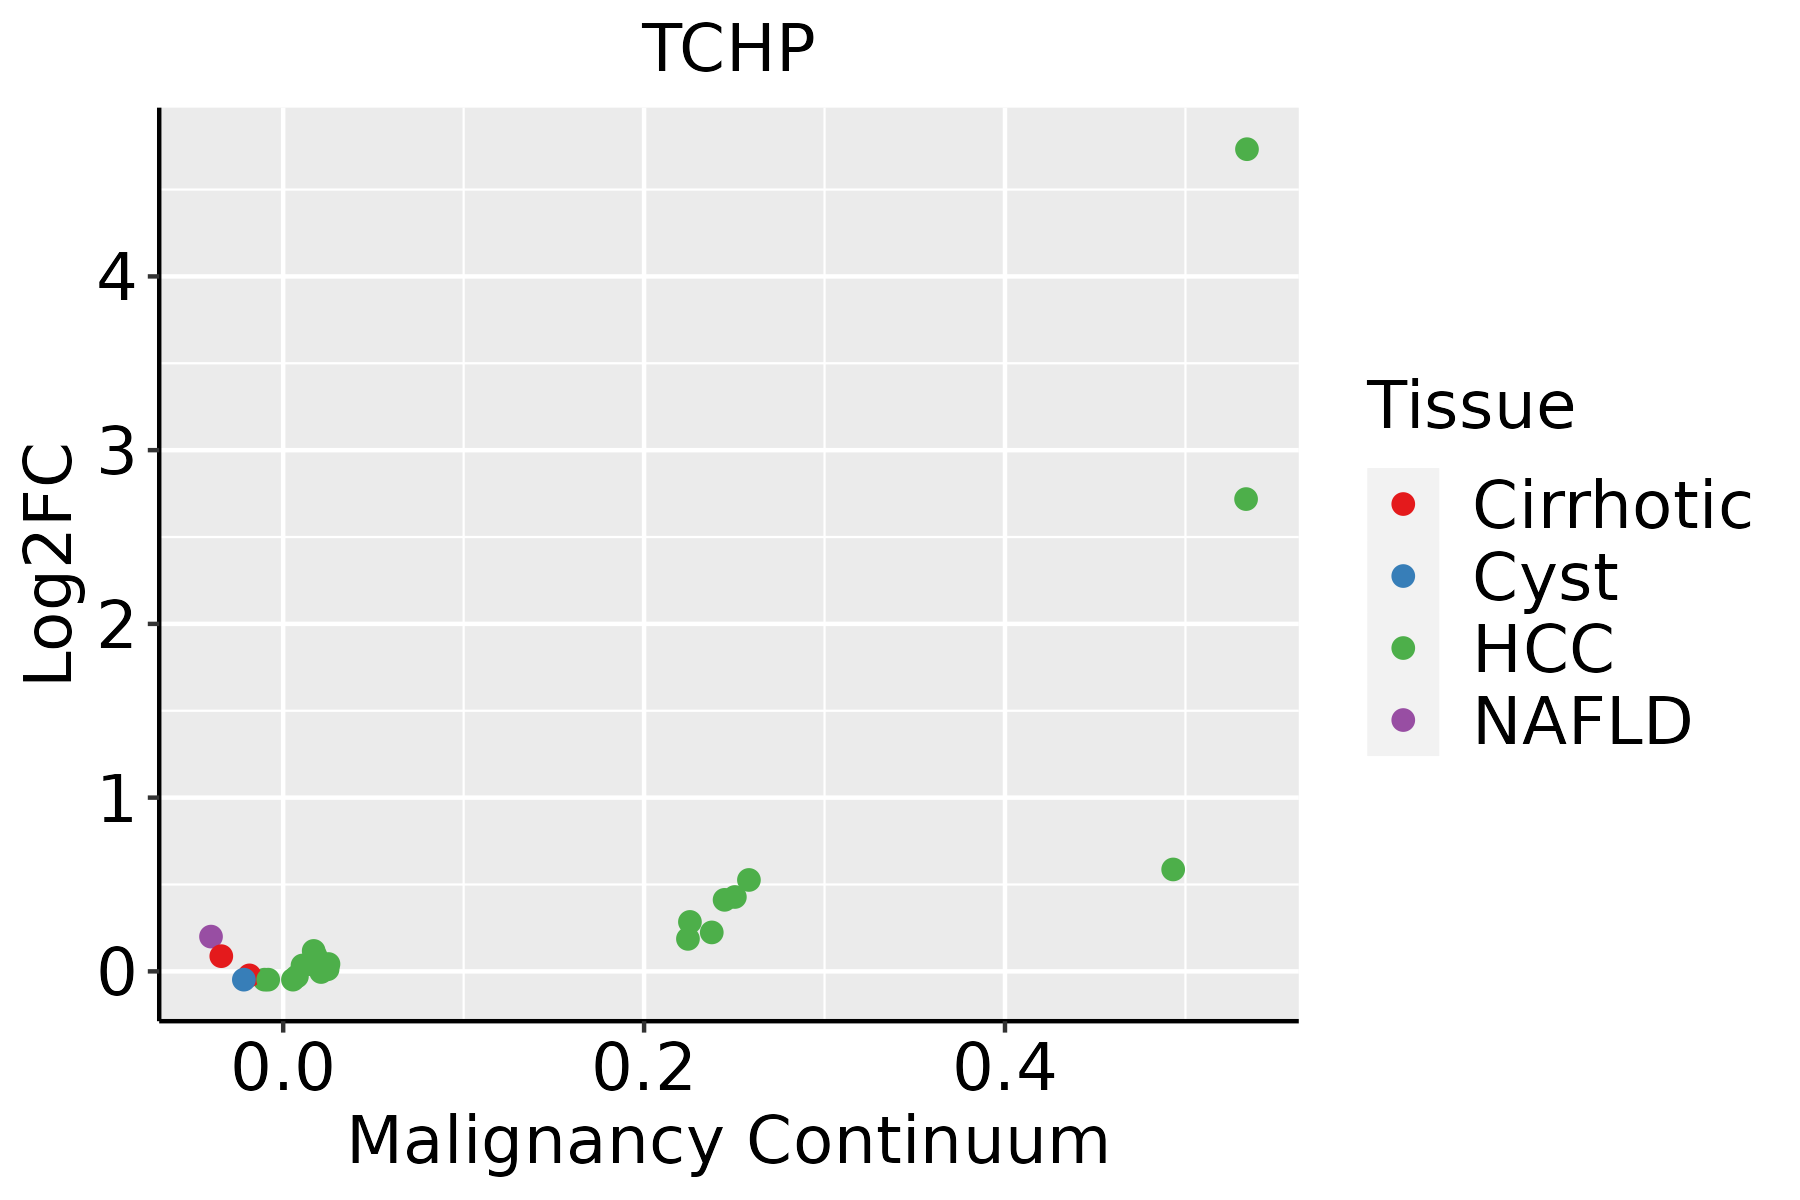 | HCC: Hepatocellular carcinoma |
| NAFLD: Non-alcoholic fatty liver disease | ||
| Oral Cavity | 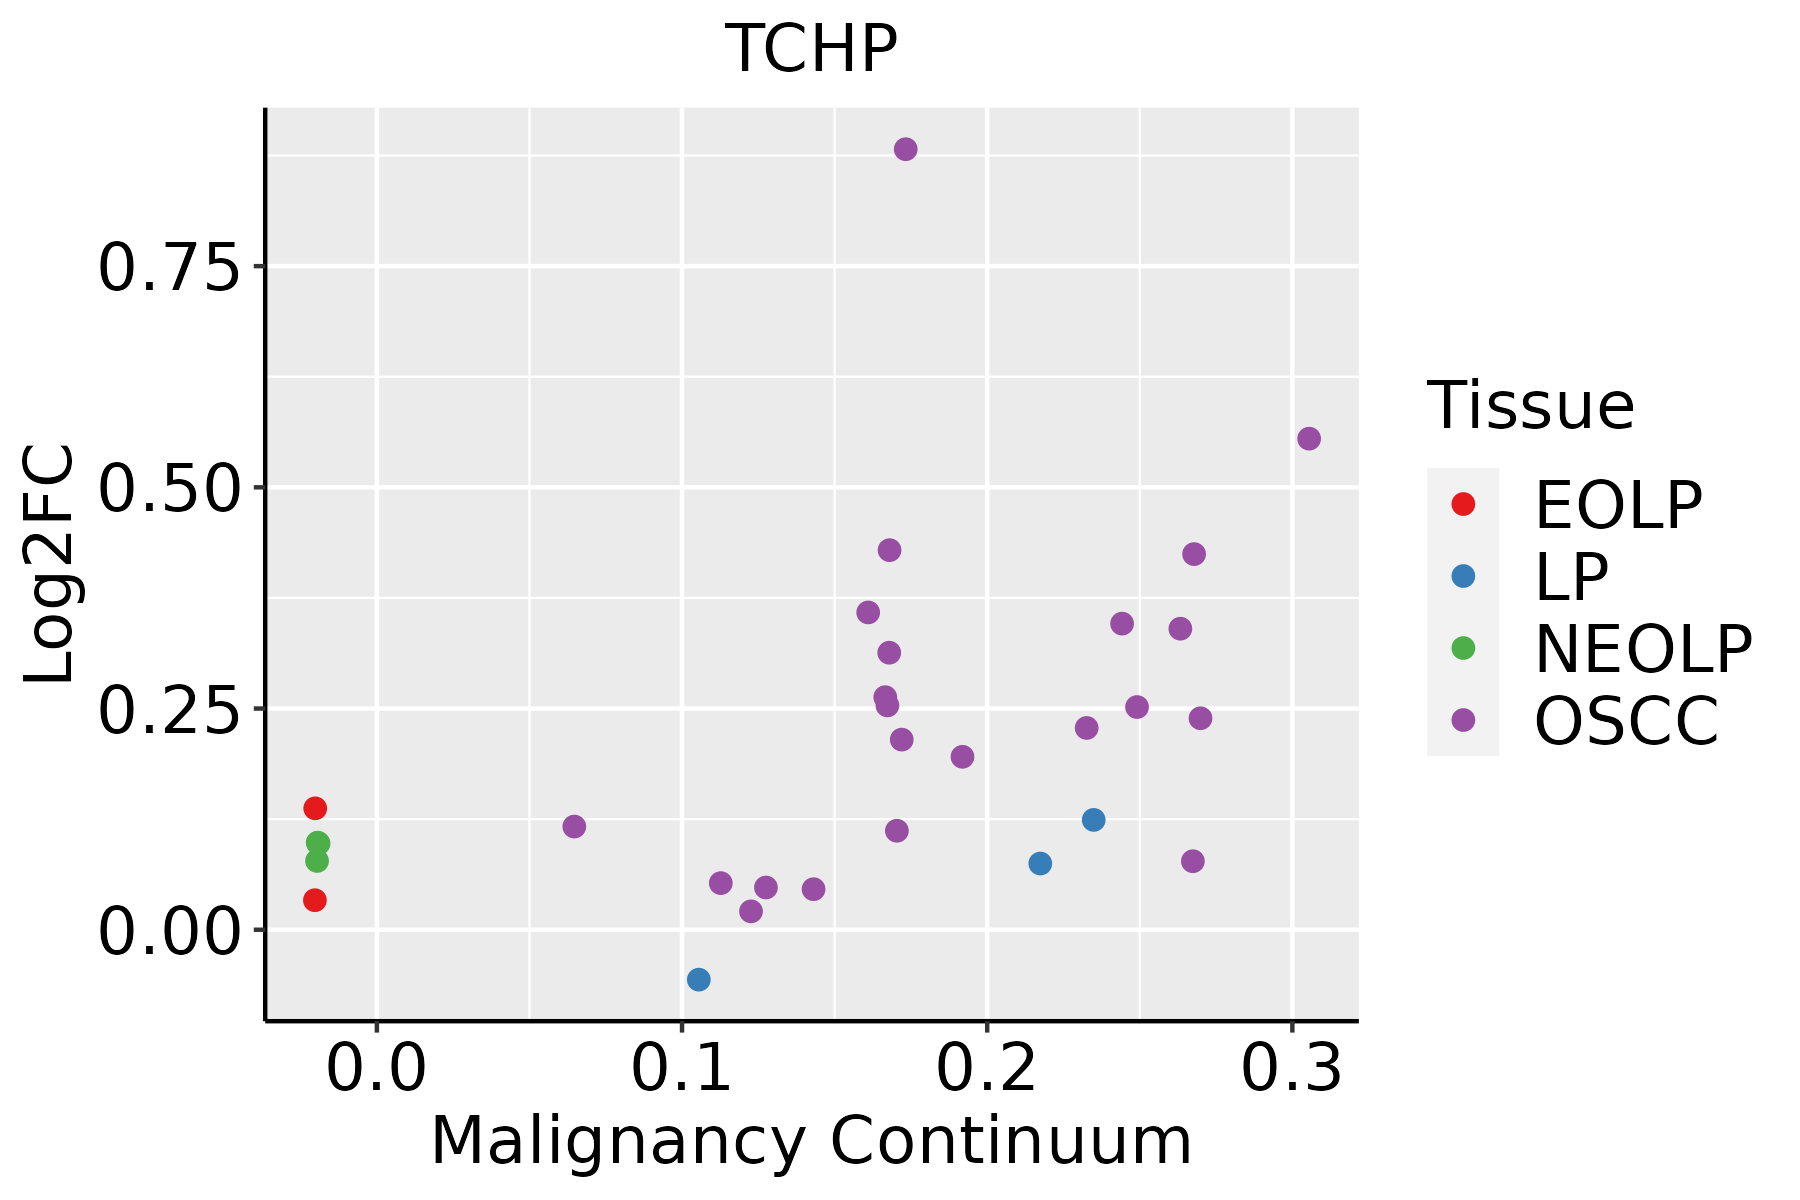 | EOLP: Erosive Oral lichen planus |
| LP: leukoplakia | ||
| NEOLP: Non-erosive oral lichen planus | ||
| OSCC: Oral squamous cell carcinoma |
| ∗log2FC in expression of this searched gene in stem-like cells from each diseased tissue sample relative to stem-like cells in normal samples in each tissue plotted against the malignancy continuum. Samples are colored based on if they are from different disease stage. |
Top |
Malignant transformation related pathway analysis |
| Find out the enriched GO biological processes and KEGG pathways involved in transition from healthy to precancer to cancer |
| Tissue | Disease Stage | Enriched GO biological Processes |
| Thyroid | PTC |  |
| Thyroid | goiters |  |
| Thyroid | ATC |  |
| ∗Top 15 enriched GO BP terms are showed in the bar plot of each disease state in each tissue. Each row represents a significant GO biological process which is colored according to the -log10(p.adjust). |
| Page: 1 2 3 4 5 6 7 8 9 |
| GO ID | Tissue | Disease Stage | Description | Gene Ratio | Bg Ratio | pvalue | p.adjust | Count |
| GO:0016049110 | Esophagus | ESCC | cell growth | 289/8552 | 482/18723 | 1.29e-10 | 3.77e-09 | 289 |
| GO:0010639110 | Esophagus | ESCC | negative regulation of organelle organization | 215/8552 | 348/18723 | 8.20e-10 | 2.01e-08 | 215 |
| GO:000155819 | Esophagus | ESCC | regulation of cell growth | 248/8552 | 414/18723 | 2.97e-09 | 6.45e-08 | 248 |
| GO:190211514 | Esophagus | ESCC | regulation of organelle assembly | 116/8552 | 186/18723 | 3.15e-06 | 3.53e-05 | 116 |
| GO:00459267 | Esophagus | ESCC | negative regulation of growth | 148/8552 | 249/18723 | 7.88e-06 | 7.73e-05 | 148 |
| GO:006049118 | Esophagus | ESCC | regulation of cell projection assembly | 110/8552 | 188/18723 | 2.60e-04 | 1.58e-03 | 110 |
| GO:012003218 | Esophagus | ESCC | regulation of plasma membrane bounded cell projection assembly | 108/8552 | 186/18723 | 4.37e-04 | 2.46e-03 | 108 |
| GO:00303085 | Esophagus | ESCC | negative regulation of cell growth | 108/8552 | 188/18723 | 7.46e-04 | 3.87e-03 | 108 |
| GO:190211611 | Esophagus | ESCC | negative regulation of organelle assembly | 28/8552 | 41/18723 | 2.88e-03 | 1.21e-02 | 28 |
| GO:001063912 | Liver | HCC | negative regulation of organelle organization | 204/7958 | 348/18723 | 7.67e-10 | 2.37e-08 | 204 |
| GO:001604921 | Liver | HCC | cell growth | 269/7958 | 482/18723 | 1.84e-09 | 5.35e-08 | 269 |
| GO:000155821 | Liver | HCC | regulation of cell growth | 228/7958 | 414/18723 | 1.34e-07 | 2.55e-06 | 228 |
| GO:19021151 | Liver | HCC | regulation of organelle assembly | 110/7958 | 186/18723 | 3.30e-06 | 4.34e-05 | 110 |
| GO:1902116 | Liver | HCC | negative regulation of organelle assembly | 28/7958 | 41/18723 | 7.54e-04 | 4.55e-03 | 28 |
| GO:006049112 | Liver | HCC | regulation of cell projection assembly | 101/7958 | 188/18723 | 1.20e-03 | 6.69e-03 | 101 |
| GO:012003212 | Liver | HCC | regulation of plasma membrane bounded cell projection assembly | 100/7958 | 186/18723 | 1.23e-03 | 6.81e-03 | 100 |
| GO:00459263 | Liver | HCC | negative regulation of growth | 129/7958 | 249/18723 | 1.81e-03 | 9.37e-03 | 129 |
| GO:0030308 | Liver | HCC | negative regulation of cell growth | 98/7958 | 188/18723 | 4.74e-03 | 2.02e-02 | 98 |
| GO:001604917 | Oral cavity | OSCC | cell growth | 268/7305 | 482/18723 | 6.55e-14 | 3.51e-12 | 268 |
| GO:000155816 | Oral cavity | OSCC | regulation of cell growth | 228/7305 | 414/18723 | 1.74e-11 | 6.09e-10 | 228 |
| Page: 1 2 |
| Pathway ID | Tissue | Disease Stage | Description | Gene Ratio | Bg Ratio | pvalue | p.adjust | qvalue | Count |
| Page: 1 |
Top |
Cell-cell communication analysis |
| Identification of potential cell-cell interactions between two cell types and their ligand-receptor pairs for different disease states |
| Ligand | Receptor | LRpair | Pathway | Tissue | Disease Stage |
| Page: 1 |
Top |
Single-cell gene regulatory network inference analysis |
| Find out the significant the regulons (TFs) and the target genes of each regulon across cell types for different disease states |
| TF | Cell Type | Tissue | Disease Stage | Target Gene | RSS | Regulon Activity |
| ∗The dot plots of a searched regulon are shown for all cell subpopulations in each disease state of each tissue based on the regulon specific score inferred using pySCENIC and by calculating the average expression. |
| Page: 1 |
Top |
Somatic mutation of malignant transformation related genes |
| Annotation of somatic variants for genes involved in malignant transformation |
| Hugo Symbol | Variant Class | Variant Classification | dbSNP RS | HGVSc | HGVSp | HGVSp Short | SWISSPROT | BIOTYPE | SIFT | PolyPhen | Tumor Sample Barcode | Tissue | Histology | Sex | Age | Stage | Therapy Types | Drugs | Outcome |
| TCHP | SNV | Missense_Mutation | novel | c.374C>T | p.Ser125Leu | p.S125L | Q9BT92 | protein_coding | deleterious(0.05) | benign(0.006) | TCGA-5L-AAT1-01 | Breast | breast invasive carcinoma | Female | <65 | III/IV | Hormone Therapy | letrozol | SD |
| TCHP | SNV | Missense_Mutation | novel | c.1187G>T | p.Arg396Leu | p.R396L | Q9BT92 | protein_coding | tolerated(0.06) | benign(0.137) | TCGA-A2-A25A-01 | Breast | breast invasive carcinoma | Female | <65 | I/II | Unspecific | Cytoxan | SD |
| TCHP | SNV | Missense_Mutation | rs747428120 | c.167N>T | p.Ser56Phe | p.S56F | Q9BT92 | protein_coding | deleterious(0) | probably_damaging(0.995) | TCGA-AC-A23H-01 | Breast | breast invasive carcinoma | Female | >=65 | I/II | Unknown | Unknown | PD |
| TCHP | SNV | Missense_Mutation | rs199860940 | c.452N>A | p.Arg151Gln | p.R151Q | Q9BT92 | protein_coding | tolerated(0.1) | possibly_damaging(0.686) | TCGA-AN-A046-01 | Breast | breast invasive carcinoma | Female | >=65 | I/II | Unknown | Unknown | SD |
| TCHP | SNV | Missense_Mutation | c.1304A>C | p.Gln435Pro | p.Q435P | Q9BT92 | protein_coding | deleterious(0.01) | benign(0.305) | TCGA-BH-A0BZ-01 | Breast | breast invasive carcinoma | Female | <65 | III/IV | Chemotherapy | doxorubicin | CR | |
| TCHP | SNV | Missense_Mutation | novel | c.764N>G | p.Glu255Gly | p.E255G | Q9BT92 | protein_coding | deleterious(0) | possibly_damaging(0.739) | TCGA-BH-A0HO-01 | Breast | breast invasive carcinoma | Female | <65 | I/II | Chemotherapy | cyclophosphamide | SD |
| TCHP | SNV | Missense_Mutation | novel | c.764A>G | p.Glu255Gly | p.E255G | Q9BT92 | protein_coding | deleterious(0) | possibly_damaging(0.739) | TCGA-BH-A1F5-01 | Breast | breast invasive carcinoma | Female | <65 | I/II | Unknown | Unknown | SD |
| TCHP | SNV | Missense_Mutation | novel | c.764A>G | p.Glu255Gly | p.E255G | Q9BT92 | protein_coding | deleterious(0) | possibly_damaging(0.739) | TCGA-C8-A273-01 | Breast | breast invasive carcinoma | Female | <65 | I/II | Hormone Therapy | tamoxiphen | SD |
| TCHP | SNV | Missense_Mutation | novel | c.764N>G | p.Glu255Gly | p.E255G | Q9BT92 | protein_coding | deleterious(0) | possibly_damaging(0.739) | TCGA-E9-A295-01 | Breast | breast invasive carcinoma | Female | >=65 | I/II | Hormone Therapy | tamoxiphen | SD |
| TCHP | insertion | Frame_Shift_Ins | novel | c.534_535insGCTGGGATTACAGGCGTGGGCCACAGGGTCCAGCTAGG | p.Thr179AlafsTer34 | p.T179Afs*34 | Q9BT92 | protein_coding | TCGA-A8-A06O-01 | Breast | breast invasive carcinoma | Female | <65 | I/II | Hormone Therapy | letrozole | SD |
| Page: 1 2 3 4 5 6 |
Top |
Related drugs of malignant transformation related genes |
| Identification of chemicals and drugs interact with genes involved in malignant transfromation |
| (DGIdb 4.0) |
| Entrez ID | Symbol | Category | Interaction Types | Drug Claim Name | Drug Name | PMIDs |
| Page: 1 |

Copyright 2023-Present -The University of Texas Health Science Center at Houston |