
|
|||||
|
 | |
| |
| |
| |
| |
| |
|
Gene: STRA13 |
Gene summary for STRA13 |
| Gene information | Species | Human | Gene symbol | STRA13 | Gene ID | 8553 |
| Gene name | basic helix-loop-helix family member e40 | |
| Gene Alias | BHLHB2 | |
| Cytomap | 3p26.1 | |
| Gene Type | protein-coding | GO ID | GO:0000122 | UniProtAcc | O14503 |
Top |
Malignant transformation analysis |
| Identification of the aberrant gene expression in precancerous and cancerous lesions by comparing the gene expression of stem-like cells in diseased tissues with normal stem cells |
| Entrez ID | Symbol | Replicates | Species | Organ | Tissue | Adj P-value | Log2FC | Malignancy |
| 8553 | STRA13 | HTA11_99999970781_79442 | Human | Colorectum | MSS | 1.58e-13 | 3.38e-01 | 0.294 |
| 8553 | STRA13 | HTA11_99999965062_69753 | Human | Colorectum | MSI-H | 5.36e-07 | 6.32e-01 | 0.3487 |
| 8553 | STRA13 | HTA11_99999965104_69814 | Human | Colorectum | MSS | 1.42e-20 | 5.72e-01 | 0.281 |
| 8553 | STRA13 | HTA11_99999971662_82457 | Human | Colorectum | MSS | 1.44e-19 | 4.33e-01 | 0.3859 |
| 8553 | STRA13 | HTA11_99999973899_84307 | Human | Colorectum | MSS | 2.22e-05 | 3.86e-01 | 0.2585 |
| 8553 | STRA13 | HTA11_99999974143_84620 | Human | Colorectum | MSS | 1.28e-34 | 6.44e-01 | 0.3005 |
| 8553 | STRA13 | P1T-E | Human | Esophagus | ESCC | 2.35e-15 | 1.24e+00 | 0.0875 |
| 8553 | STRA13 | P2T-E | Human | Esophagus | ESCC | 2.47e-44 | 1.01e+00 | 0.1177 |
| 8553 | STRA13 | P4T-E | Human | Esophagus | ESCC | 1.54e-38 | 1.09e+00 | 0.1323 |
| 8553 | STRA13 | P5T-E | Human | Esophagus | ESCC | 6.86e-50 | 1.02e+00 | 0.1327 |
| 8553 | STRA13 | P8T-E | Human | Esophagus | ESCC | 1.03e-39 | 8.77e-01 | 0.0889 |
| 8553 | STRA13 | P9T-E | Human | Esophagus | ESCC | 2.02e-40 | 1.03e+00 | 0.1131 |
| 8553 | STRA13 | P10T-E | Human | Esophagus | ESCC | 2.79e-59 | 1.34e+00 | 0.116 |
| 8553 | STRA13 | P11T-E | Human | Esophagus | ESCC | 1.98e-25 | 2.08e+00 | 0.1426 |
| 8553 | STRA13 | P12T-E | Human | Esophagus | ESCC | 1.46e-48 | 9.36e-01 | 0.1122 |
| 8553 | STRA13 | P15T-E | Human | Esophagus | ESCC | 7.52e-35 | 1.03e+00 | 0.1149 |
| 8553 | STRA13 | P16T-E | Human | Esophagus | ESCC | 4.10e-40 | 9.44e-01 | 0.1153 |
| 8553 | STRA13 | P17T-E | Human | Esophagus | ESCC | 5.11e-23 | 1.17e+00 | 0.1278 |
| 8553 | STRA13 | P19T-E | Human | Esophagus | ESCC | 2.55e-09 | 1.17e+00 | 0.1662 |
| 8553 | STRA13 | P20T-E | Human | Esophagus | ESCC | 1.89e-86 | 2.75e+00 | 0.1124 |
| Page: 1 2 3 4 5 6 7 |
| Tissue | Expression Dynamics | Abbreviation |
| Colorectum (GSE201348) |  | FAP: Familial adenomatous polyposis |
| CRC: Colorectal cancer | ||
| Colorectum (HTA11) |  | AD: Adenomas |
| SER: Sessile serrated lesions | ||
| MSI-H: Microsatellite-high colorectal cancer | ||
| MSS: Microsatellite stable colorectal cancer | ||
| Esophagus | 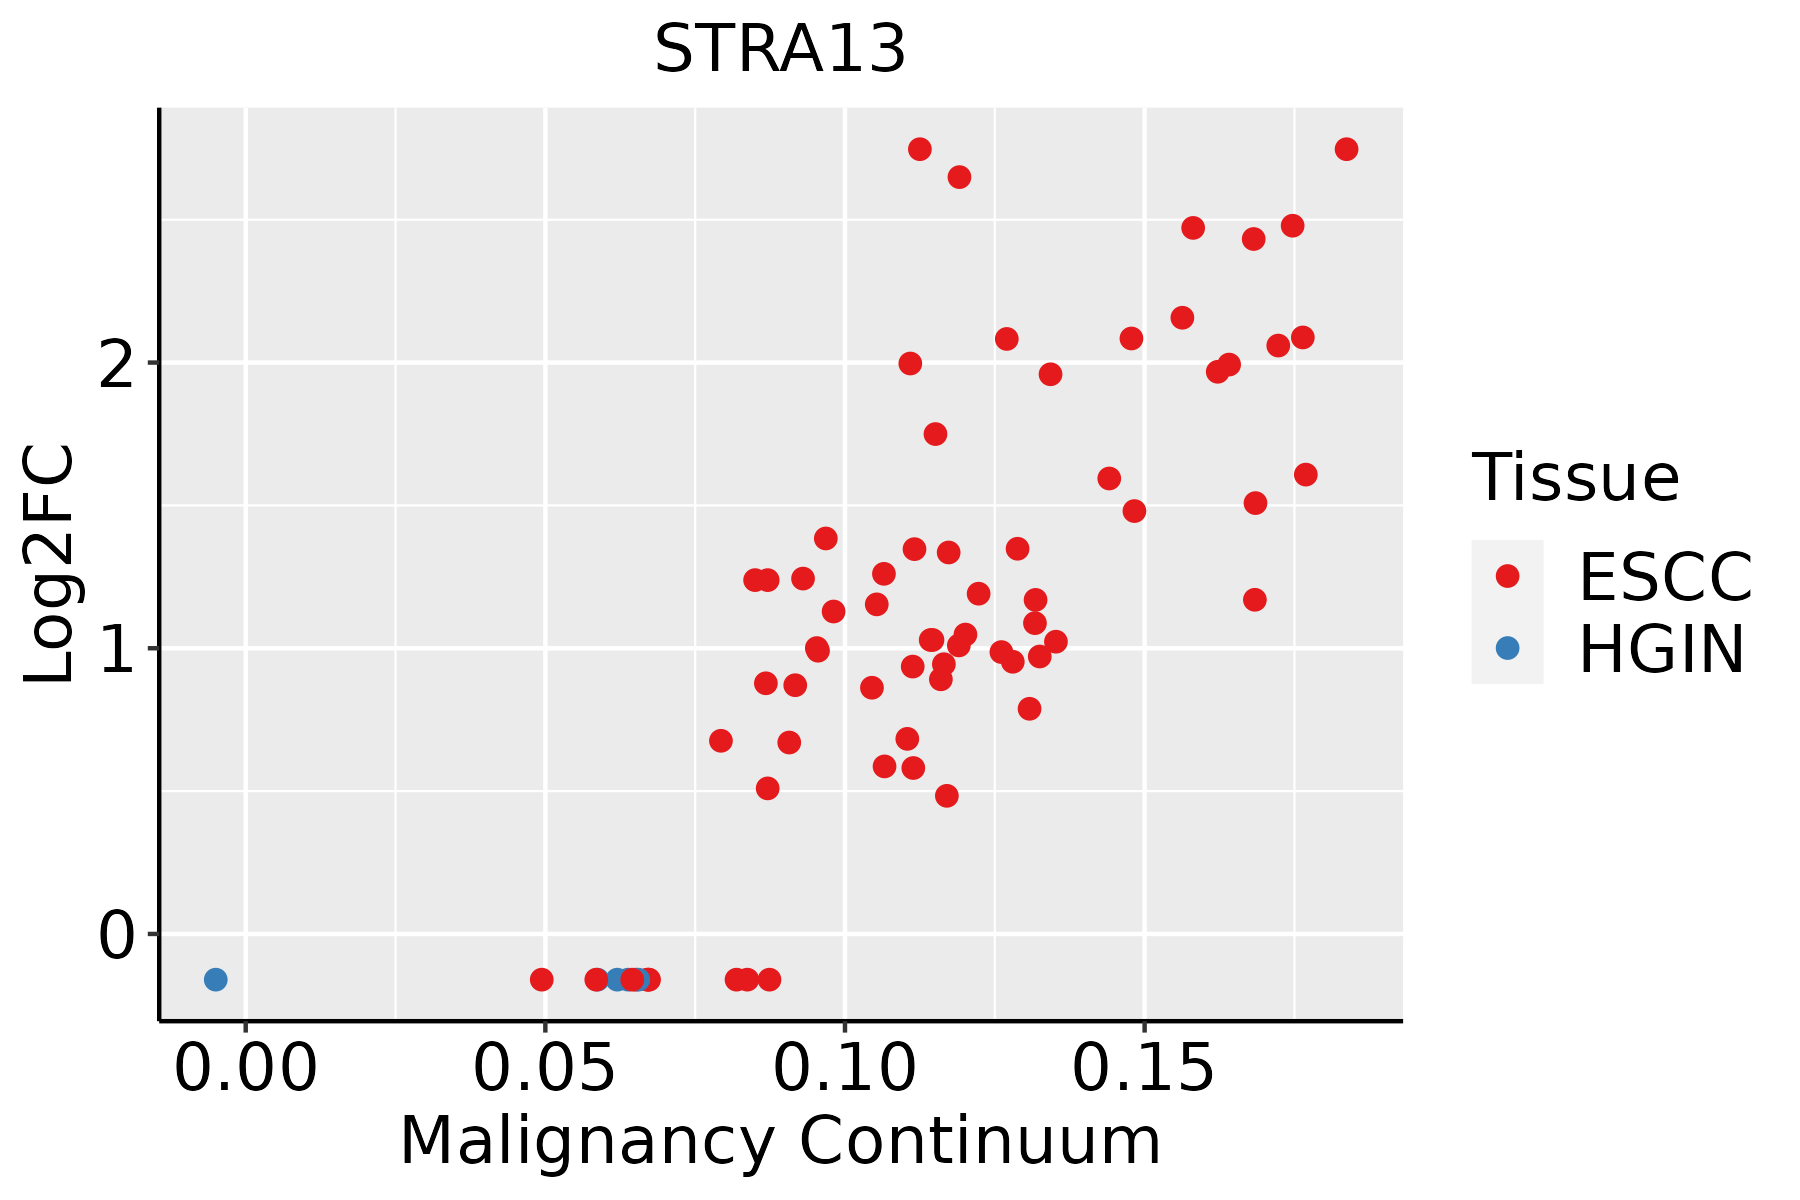 | ESCC: Esophageal squamous cell carcinoma |
| HGIN: High-grade intraepithelial neoplasias | ||
| LGIN: Low-grade intraepithelial neoplasias | ||
| Oral Cavity | 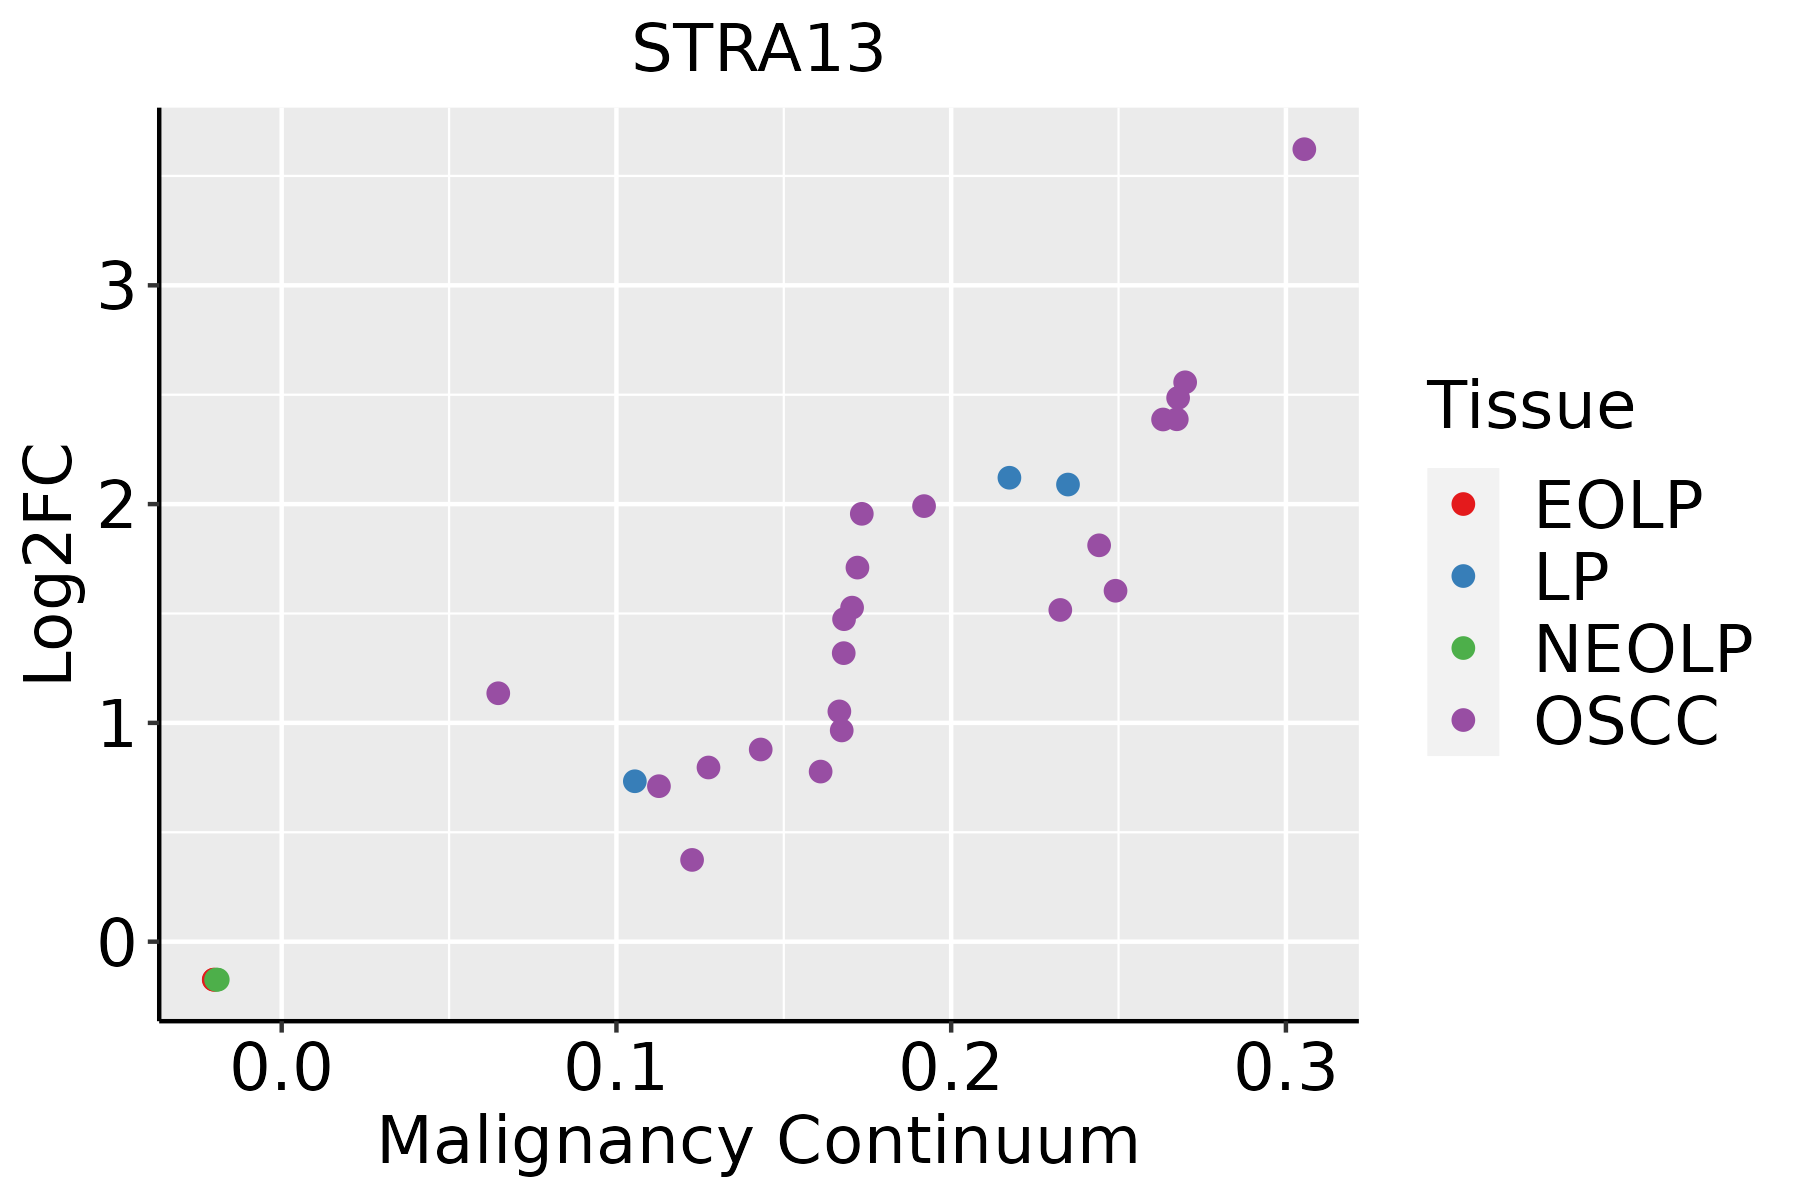 | EOLP: Erosive Oral lichen planus |
| LP: leukoplakia | ||
| NEOLP: Non-erosive oral lichen planus | ||
| OSCC: Oral squamous cell carcinoma | ||
| Prostate | 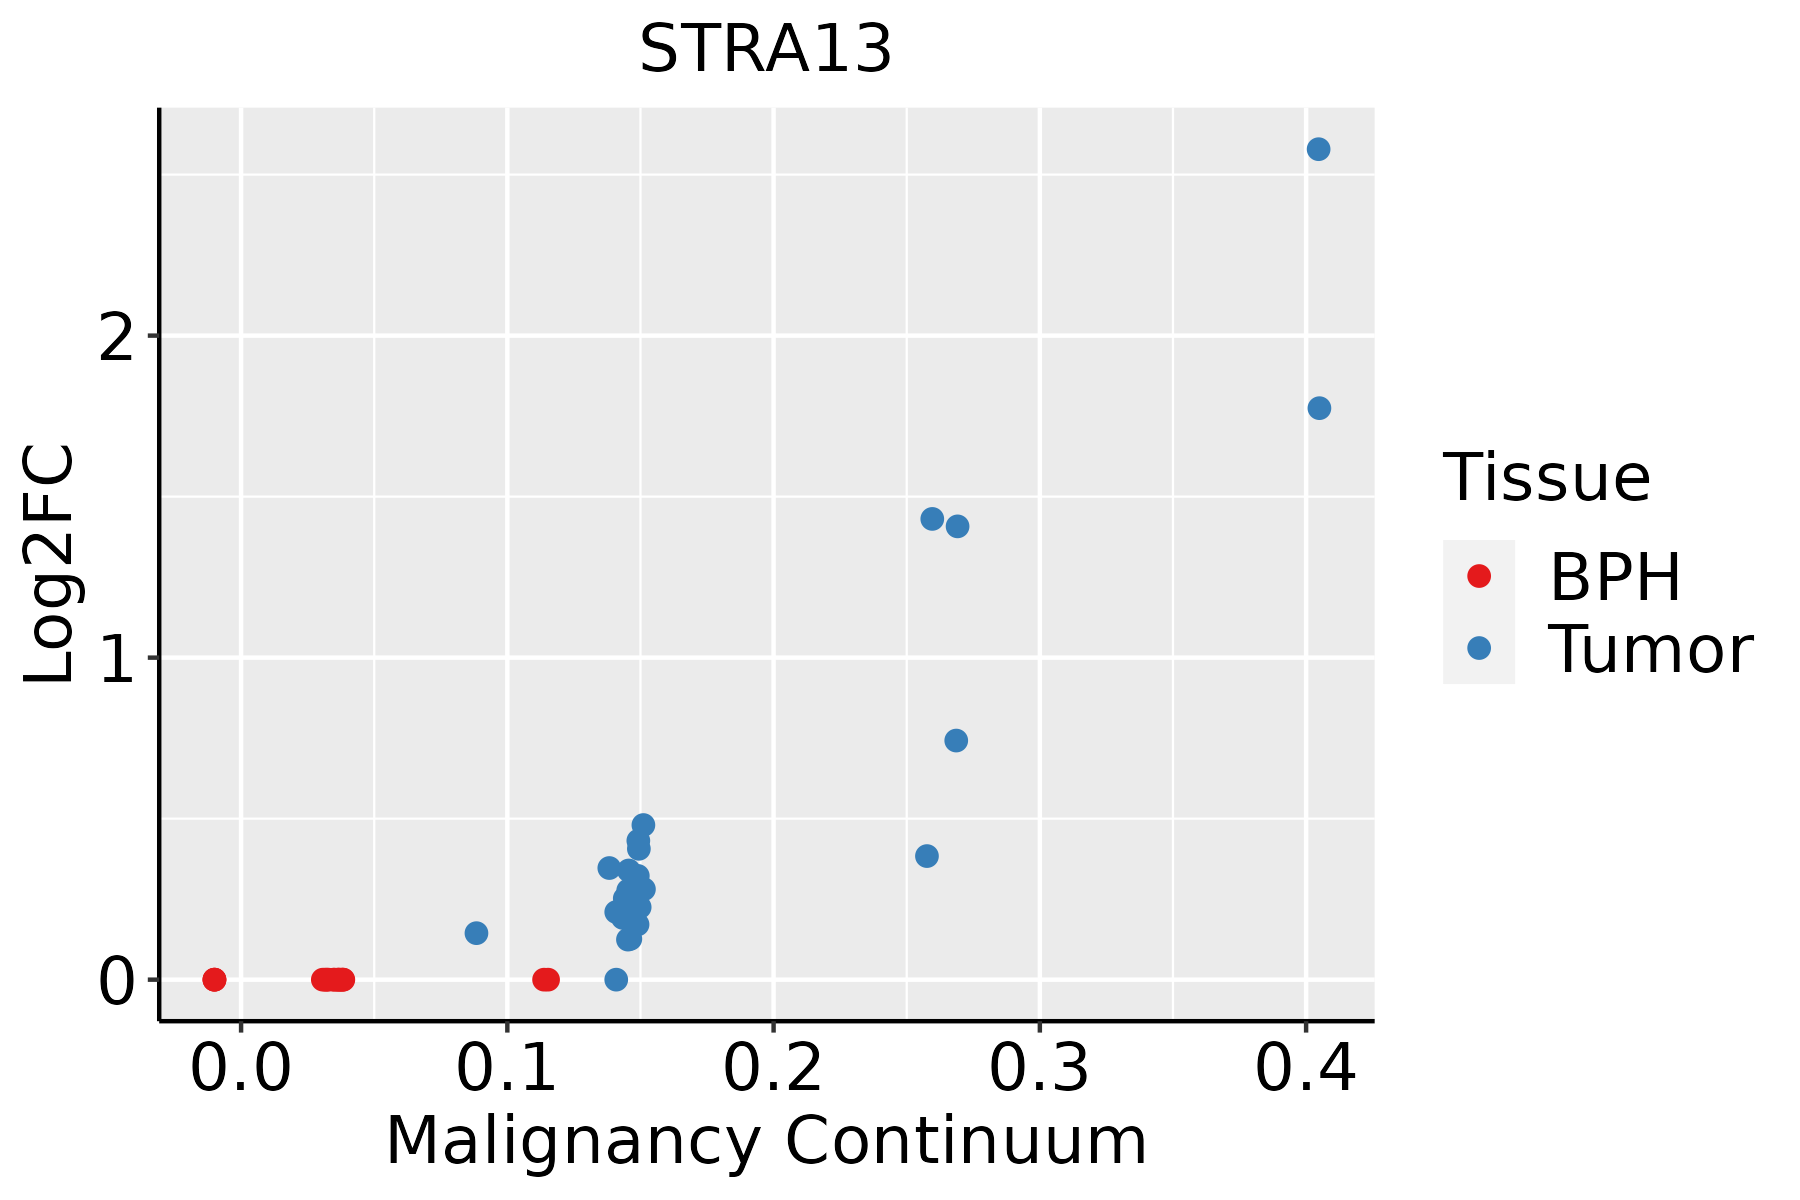 | BPH: Benign Prostatic Hyperplasia |
| Skin | 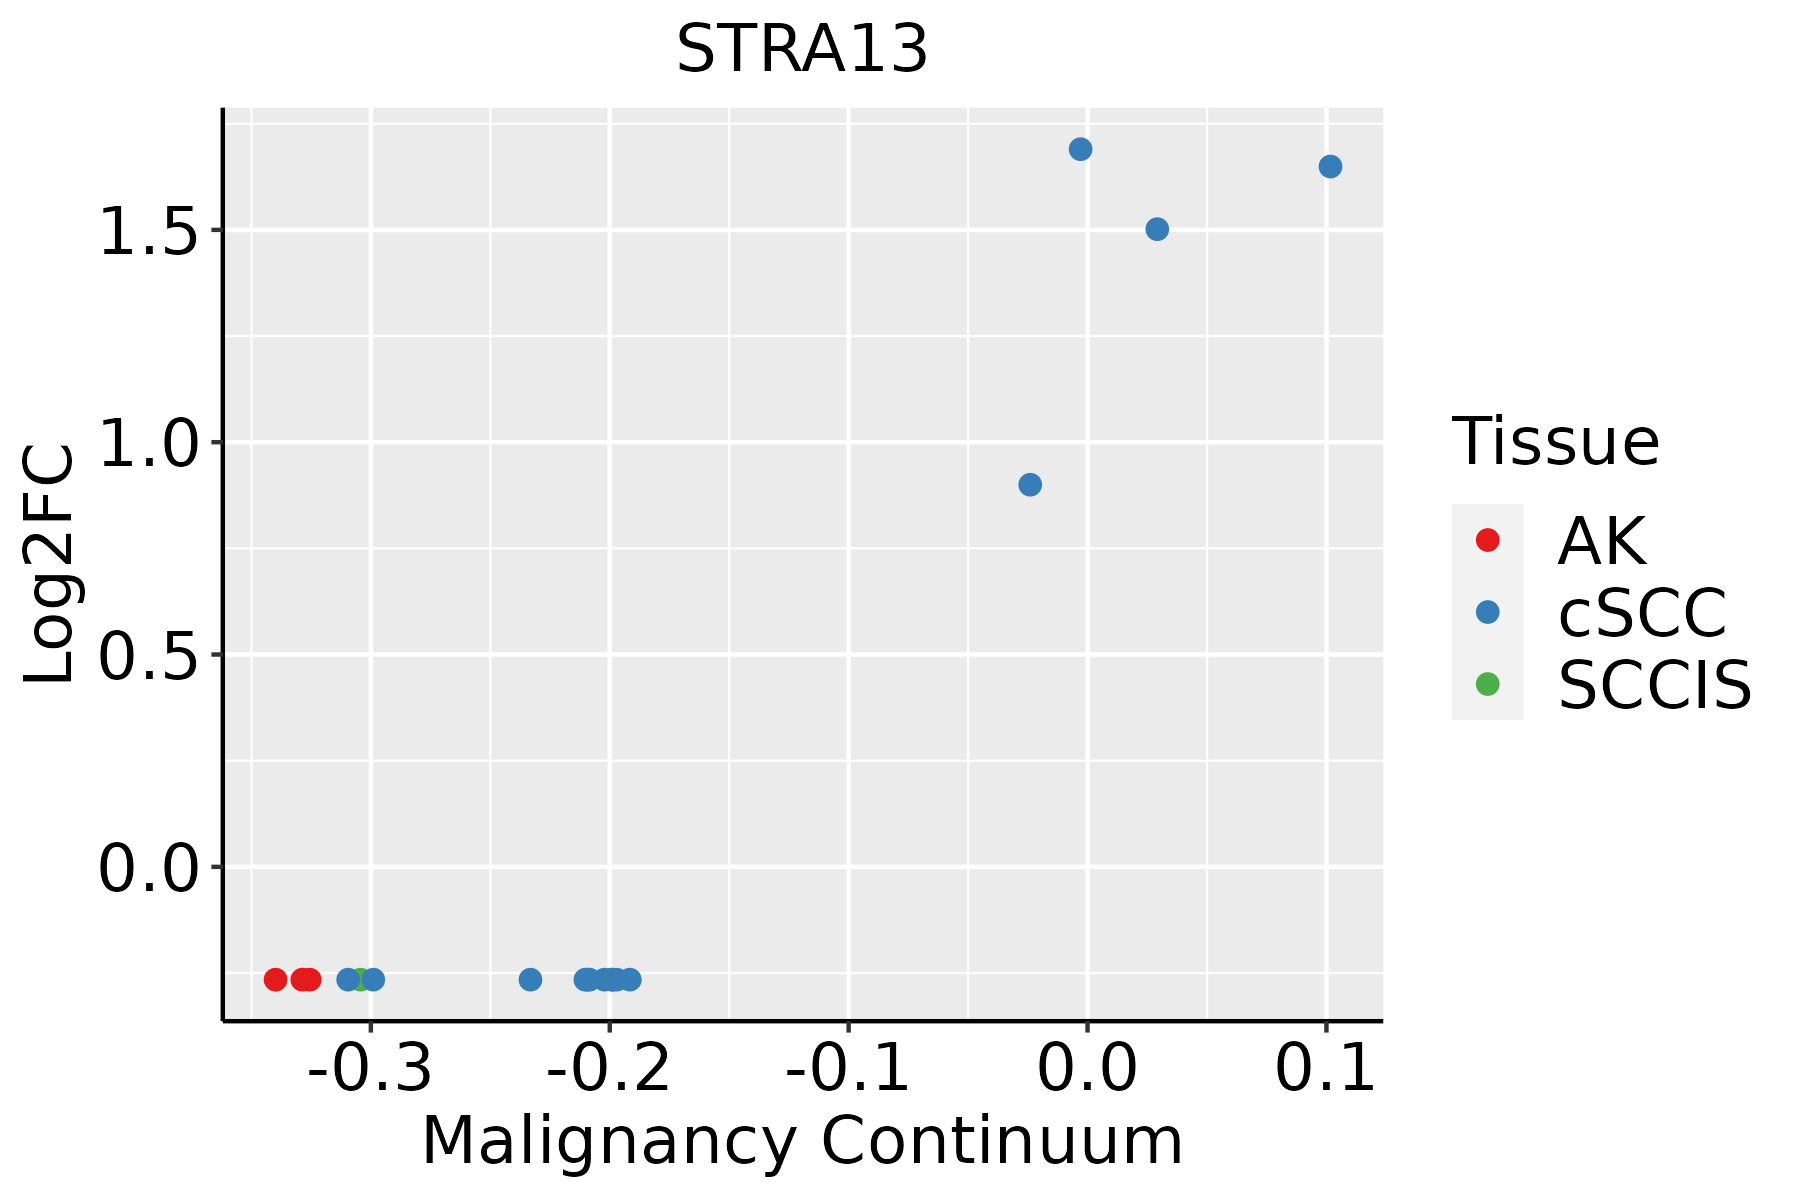 | AK: Actinic keratosis |
| cSCC: Cutaneous squamous cell carcinoma | ||
| SCCIS:squamous cell carcinoma in situ |
| ∗log2FC in expression of this searched gene in stem-like cells from each diseased tissue sample relative to stem-like cells in normal samples in each tissue plotted against the malignancy continuum. Samples are colored based on if they are from different disease stage. |
Top |
Malignant transformation related pathway analysis |
| Find out the enriched GO biological processes and KEGG pathways involved in transition from healthy to precancer to cancer |
| Tissue | Disease Stage | Enriched GO biological Processes |
| Thyroid | PTC |  |
| Thyroid | goiters |  |
| Thyroid | ATC |  |
| ∗Top 15 enriched GO BP terms are showed in the bar plot of each disease state in each tissue. Each row represents a significant GO biological process which is colored according to the -log10(p.adjust). |
| Page: 1 2 3 4 5 6 7 8 9 |
| GO ID | Tissue | Disease Stage | Description | Gene Ratio | Bg Ratio | pvalue | p.adjust | Count |
| Page: 1 |
| Pathway ID | Tissue | Disease Stage | Description | Gene Ratio | Bg Ratio | pvalue | p.adjust | qvalue | Count |
| hsa047105 | Esophagus | ESCC | Circadian rhythm | 24/4205 | 34/8465 | 1.09e-02 | 2.51e-02 | 1.29e-02 | 24 |
| hsa0471012 | Esophagus | ESCC | Circadian rhythm | 24/4205 | 34/8465 | 1.09e-02 | 2.51e-02 | 1.29e-02 | 24 |
| hsa047104 | Prostate | BPH | Circadian rhythm | 15/1718 | 34/8465 | 1.40e-03 | 5.85e-03 | 3.62e-03 | 15 |
| hsa0471011 | Prostate | BPH | Circadian rhythm | 15/1718 | 34/8465 | 1.40e-03 | 5.85e-03 | 3.62e-03 | 15 |
| Page: 1 |
Top |
Cell-cell communication analysis |
| Identification of potential cell-cell interactions between two cell types and their ligand-receptor pairs for different disease states |
| Ligand | Receptor | LRpair | Pathway | Tissue | Disease Stage |
| Page: 1 |
Top |
Single-cell gene regulatory network inference analysis |
| Find out the significant the regulons (TFs) and the target genes of each regulon across cell types for different disease states |
| TF | Cell Type | Tissue | Disease Stage | Target Gene | RSS | Regulon Activity |
| ∗The dot plots of a searched regulon are shown for all cell subpopulations in each disease state of each tissue based on the regulon specific score inferred using pySCENIC and by calculating the average expression. |
| Page: 1 |
Top |
Somatic mutation of malignant transformation related genes |
| Annotation of somatic variants for genes involved in malignant transformation |
| Hugo Symbol | Variant Class | Variant Classification | dbSNP RS | HGVSc | HGVSp | HGVSp Short | SWISSPROT | BIOTYPE | SIFT | PolyPhen | Tumor Sample Barcode | Tissue | Histology | Sex | Age | Stage | Therapy Types | Drugs | Outcome |
| Page: 1 |
Top |
Related drugs of malignant transformation related genes |
| Identification of chemicals and drugs interact with genes involved in malignant transfromation |
| (DGIdb 4.0) |
| Entrez ID | Symbol | Category | Interaction Types | Drug Claim Name | Drug Name | PMIDs |
| Page: 1 |

Copyright 2023-Present -The University of Texas Health Science Center at Houston |