
|
|||||
|
 | |
| |
| |
| |
| |
| |
|
Gene: SPINK8 |
Gene summary for SPINK8 |
| Gene information | Species | Human | Gene symbol | SPINK8 | Gene ID | 646424 |
| Gene name | serine peptidase inhibitor Kazal type 8 (putative) | |
| Gene Alias | SPINK8 | |
| Cytomap | 3p21.31 | |
| Gene Type | protein-coding | GO ID | GO:0006508 | UniProtAcc | P0C7L1 |
Top |
Malignant transformation analysis |
| Identification of the aberrant gene expression in precancerous and cancerous lesions by comparing the gene expression of stem-like cells in diseased tissues with normal stem cells |
| Entrez ID | Symbol | Replicates | Species | Organ | Tissue | Adj P-value | Log2FC | Malignancy |
| 646424 | SPINK8 | GSM4909289 | Human | Breast | IDC | 7.90e-05 | 4.38e-01 | 0.1064 |
| 646424 | SPINK8 | GSM4909290 | Human | Breast | IDC | 1.15e-08 | 3.27e-01 | 0.2096 |
| 646424 | SPINK8 | GSM4909293 | Human | Breast | IDC | 1.06e-12 | 3.05e-01 | 0.1581 |
| 646424 | SPINK8 | GSM4909294 | Human | Breast | IDC | 4.23e-31 | 7.72e-01 | 0.2022 |
| 646424 | SPINK8 | GSM4909298 | Human | Breast | IDC | 6.81e-10 | 1.82e-01 | 0.1551 |
| 646424 | SPINK8 | GSM4909306 | Human | Breast | IDC | 1.04e-06 | 2.80e-01 | 0.1564 |
| 646424 | SPINK8 | GSM4909315 | Human | Breast | IDC | 6.73e-18 | 5.12e-01 | 0.21 |
| 646424 | SPINK8 | GSM4909316 | Human | Breast | IDC | 1.74e-12 | 7.28e-01 | 0.21 |
| 646424 | SPINK8 | NCCBC6 | Human | Breast | DCIS | 2.25e-05 | 5.52e-01 | 0.2095 |
| 646424 | SPINK8 | DCIS2 | Human | Breast | DCIS | 1.28e-03 | 3.37e-02 | 0.0085 |
| Page: 1 |
| Tissue | Expression Dynamics | Abbreviation |
| Breast | 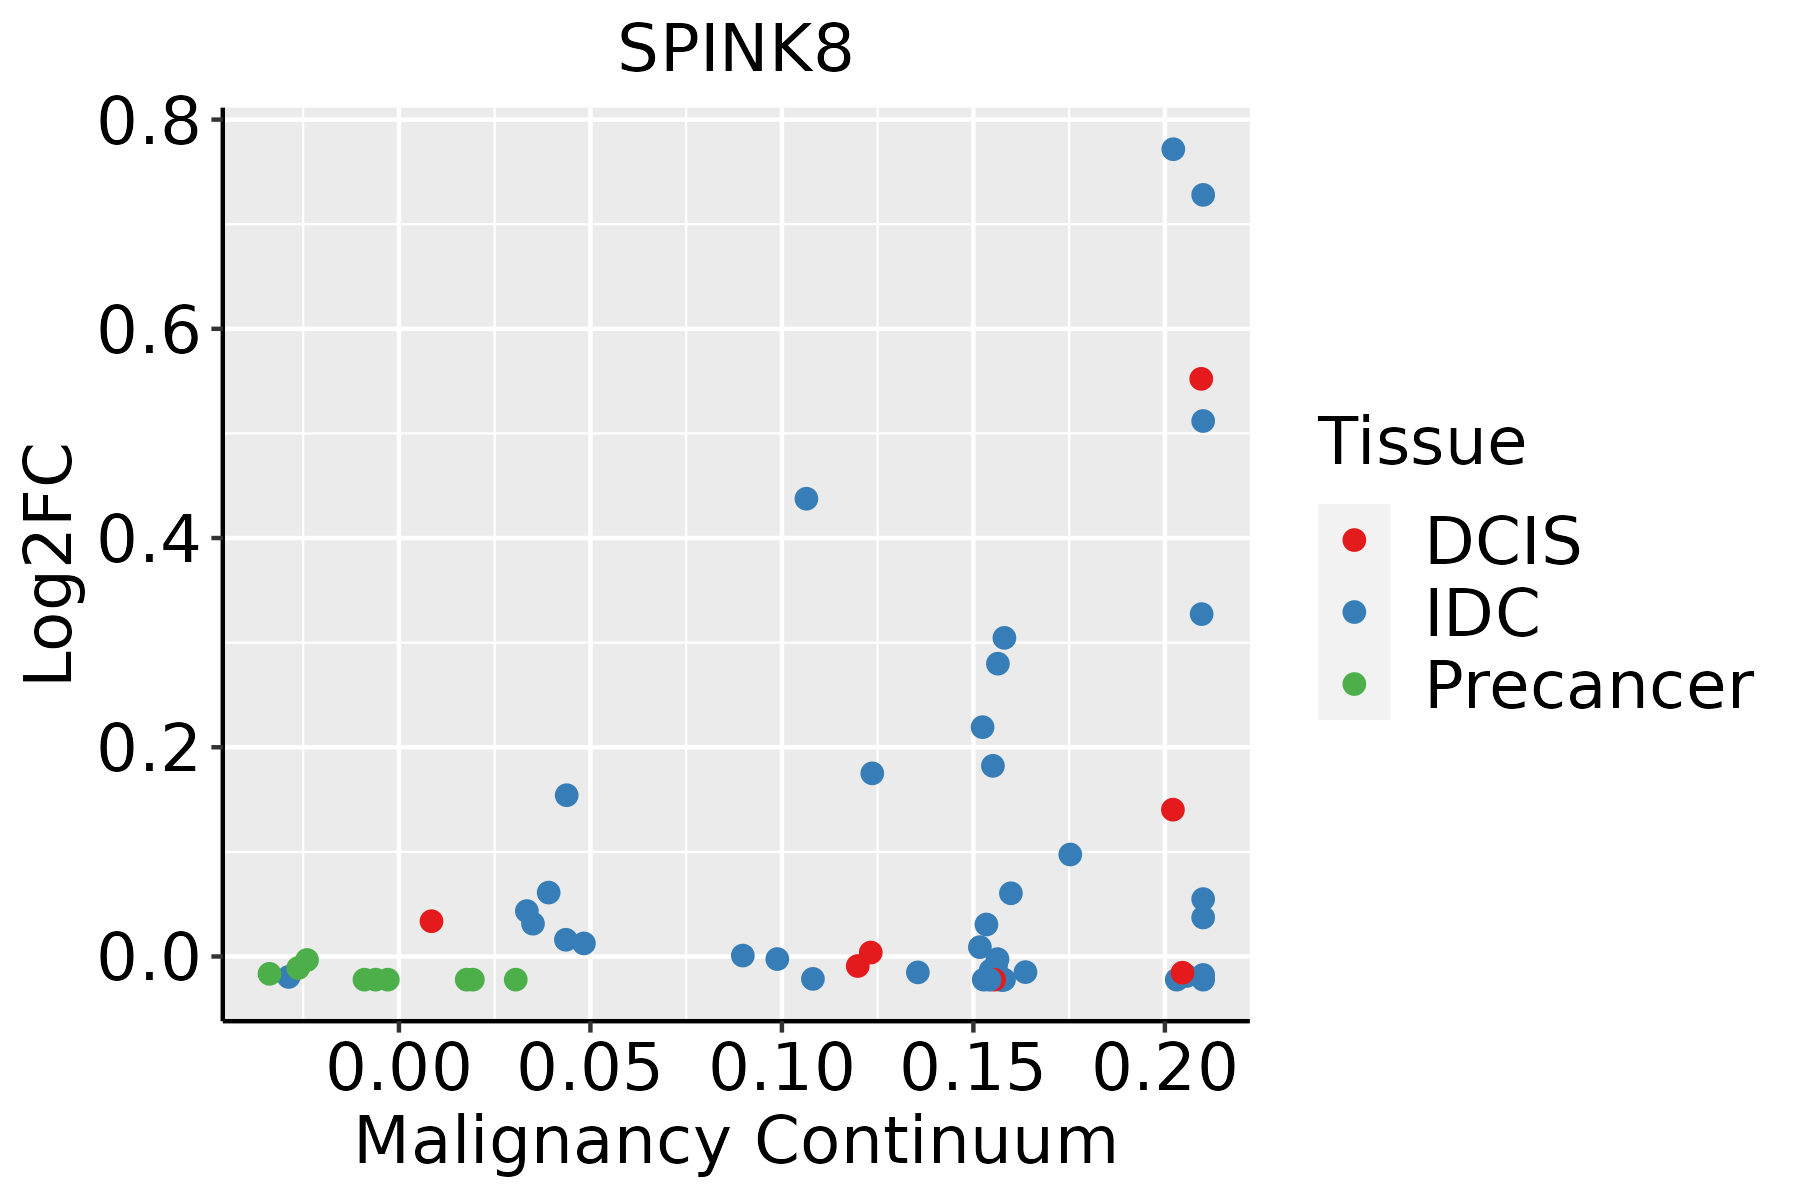 | IDC: Invasive ductal carcinoma |
| DCIS: Ductal carcinoma in situ | ||
| Precancer(BRCA1-mut): Precancerous lesion from BRCA1 mutation carriers |
| ∗log2FC in expression of this searched gene in stem-like cells from each diseased tissue sample relative to stem-like cells in normal samples in each tissue plotted against the malignancy continuum. Samples are colored based on if they are from different disease stage. |
Top |
Malignant transformation related pathway analysis |
| Find out the enriched GO biological processes and KEGG pathways involved in transition from healthy to precancer to cancer |
| Tissue | Disease Stage | Enriched GO biological Processes |
| Thyroid | PTC |  |
| Thyroid | goiters |  |
| Thyroid | ATC |  |
| ∗Top 15 enriched GO BP terms are showed in the bar plot of each disease state in each tissue. Each row represents a significant GO biological process which is colored according to the -log10(p.adjust). |
| Page: 1 2 3 4 5 6 7 8 9 |
| GO ID | Tissue | Disease Stage | Description | Gene Ratio | Bg Ratio | pvalue | p.adjust | Count |
| GO:005254714 | Breast | IDC | regulation of peptidase activity | 96/1434 | 461/18723 | 7.58e-20 | 6.15e-17 | 96 |
| GO:005254814 | Breast | IDC | regulation of endopeptidase activity | 88/1434 | 432/18723 | 1.20e-17 | 4.85e-15 | 88 |
| GO:004586114 | Breast | IDC | negative regulation of proteolysis | 70/1434 | 351/18723 | 8.21e-14 | 2.22e-11 | 70 |
| GO:005134613 | Breast | IDC | negative regulation of hydrolase activity | 71/1434 | 379/18723 | 1.33e-12 | 2.90e-10 | 71 |
| GO:001046613 | Breast | IDC | negative regulation of peptidase activity | 56/1434 | 262/18723 | 1.39e-12 | 2.92e-10 | 56 |
| GO:001095112 | Breast | IDC | negative regulation of endopeptidase activity | 52/1434 | 252/18723 | 3.53e-11 | 5.57e-09 | 52 |
| GO:005254723 | Breast | DCIS | regulation of peptidase activity | 88/1390 | 461/18723 | 1.18e-16 | 4.78e-14 | 88 |
| GO:005254823 | Breast | DCIS | regulation of endopeptidase activity | 83/1390 | 432/18723 | 6.07e-16 | 2.15e-13 | 83 |
| GO:004586123 | Breast | DCIS | negative regulation of proteolysis | 63/1390 | 351/18723 | 4.39e-11 | 6.06e-09 | 63 |
| GO:005134623 | Breast | DCIS | negative regulation of hydrolase activity | 64/1390 | 379/18723 | 4.32e-10 | 4.80e-08 | 64 |
| GO:001046622 | Breast | DCIS | negative regulation of peptidase activity | 49/1390 | 262/18723 | 1.54e-09 | 1.43e-07 | 49 |
| GO:001095122 | Breast | DCIS | negative regulation of endopeptidase activity | 47/1390 | 252/18723 | 3.63e-09 | 3.11e-07 | 47 |
| Page: 1 |
| Pathway ID | Tissue | Disease Stage | Description | Gene Ratio | Bg Ratio | pvalue | p.adjust | qvalue | Count |
| Page: 1 |
Top |
Cell-cell communication analysis |
| Identification of potential cell-cell interactions between two cell types and their ligand-receptor pairs for different disease states |
| Ligand | Receptor | LRpair | Pathway | Tissue | Disease Stage |
| Page: 1 |
Top |
Single-cell gene regulatory network inference analysis |
| Find out the significant the regulons (TFs) and the target genes of each regulon across cell types for different disease states |
| TF | Cell Type | Tissue | Disease Stage | Target Gene | RSS | Regulon Activity |
| ∗The dot plots of a searched regulon are shown for all cell subpopulations in each disease state of each tissue based on the regulon specific score inferred using pySCENIC and by calculating the average expression. |
| Page: 1 |
Top |
Somatic mutation of malignant transformation related genes |
| Annotation of somatic variants for genes involved in malignant transformation |
| Hugo Symbol | Variant Class | Variant Classification | dbSNP RS | HGVSc | HGVSp | HGVSp Short | SWISSPROT | BIOTYPE | SIFT | PolyPhen | Tumor Sample Barcode | Tissue | Histology | Sex | Age | Stage | Therapy Types | Drugs | Outcome |
| SPINK8 | SNV | Missense_Mutation | c.256N>G | p.Ile86Val | p.I86V | P0C7L1 | protein_coding | tolerated(0.26) | benign(0.017) | TCGA-E9-A22B-01 | Breast | breast invasive carcinoma | Female | >=65 | I/II | Hormone Therapy | tamoxiphen | SD | |
| SPINK8 | SNV | Missense_Mutation | novel | c.127N>A | p.Leu43Ile | p.L43I | P0C7L1 | protein_coding | tolerated(0.37) | benign(0.001) | TCGA-A5-A1OF-01 | Endometrium | uterine corpus endometrioid carcinoma | Female | <65 | I/II | Unknown | Unknown | SD |
| SPINK8 | SNV | Missense_Mutation | novel | c.80N>A | p.Pro27His | p.P27H | P0C7L1 | protein_coding | deleterious(0) | probably_damaging(0.952) | TCGA-D1-A1NY-01 | Endometrium | uterine corpus endometrioid carcinoma | Female | >=65 | I/II | Chemotherapy | carboplatin | SD |
| Page: 1 |
Top |
Related drugs of malignant transformation related genes |
| Identification of chemicals and drugs interact with genes involved in malignant transfromation |
| (DGIdb 4.0) |
| Entrez ID | Symbol | Category | Interaction Types | Drug Claim Name | Drug Name | PMIDs |
| Page: 1 |

Copyright 2023-Present -The University of Texas Health Science Center at Houston |