
|
|||||
|
 | |
| |
| |
| |
| |
| |
|
Gene: SLC39A14 |
Gene summary for SLC39A14 |
| Gene information | Species | Human | Gene symbol | SLC39A14 | Gene ID | 23516 |
| Gene name | solute carrier family 39 member 14 | |
| Gene Alias | HCIN | |
| Cytomap | 8p21.3 | |
| Gene Type | protein-coding | GO ID | GO:0000041 | UniProtAcc | Q15043 |
Top |
Malignant transformation analysis |
| Identification of the aberrant gene expression in precancerous and cancerous lesions by comparing the gene expression of stem-like cells in diseased tissues with normal stem cells |
| Entrez ID | Symbol | Replicates | Species | Organ | Tissue | Adj P-value | Log2FC | Malignancy |
| 23516 | SLC39A14 | HTA11_347_2000001011 | Human | Colorectum | AD | 4.10e-07 | 4.16e-01 | -0.1954 |
| 23516 | SLC39A14 | HTA11_1391_2000001011 | Human | Colorectum | AD | 2.02e-05 | 7.12e-01 | -0.059 |
| 23516 | SLC39A14 | A015-C-203 | Human | Colorectum | FAP | 4.58e-10 | -1.92e-01 | -0.1294 |
| 23516 | SLC39A14 | A015-C-204 | Human | Colorectum | FAP | 4.24e-05 | -2.81e-01 | -0.0228 |
| 23516 | SLC39A14 | A014-C-040 | Human | Colorectum | FAP | 4.17e-02 | -3.46e-01 | -0.1184 |
| 23516 | SLC39A14 | A002-C-201 | Human | Colorectum | FAP | 8.32e-07 | -2.35e-01 | 0.0324 |
| 23516 | SLC39A14 | A001-C-108 | Human | Colorectum | FAP | 9.30e-07 | -2.40e-01 | -0.0272 |
| 23516 | SLC39A14 | A002-C-205 | Human | Colorectum | FAP | 1.60e-10 | -2.47e-01 | -0.1236 |
| 23516 | SLC39A14 | A015-C-005 | Human | Colorectum | FAP | 6.21e-05 | -2.80e-01 | -0.0336 |
| 23516 | SLC39A14 | A015-C-006 | Human | Colorectum | FAP | 3.45e-08 | -3.03e-01 | -0.0994 |
| 23516 | SLC39A14 | A015-C-106 | Human | Colorectum | FAP | 2.01e-06 | -2.03e-01 | -0.0511 |
| 23516 | SLC39A14 | A002-C-114 | Human | Colorectum | FAP | 1.23e-08 | -2.08e-01 | -0.1561 |
| 23516 | SLC39A14 | A015-C-104 | Human | Colorectum | FAP | 7.45e-13 | -2.96e-01 | -0.1899 |
| 23516 | SLC39A14 | A001-C-014 | Human | Colorectum | FAP | 6.11e-05 | -2.32e-01 | 0.0135 |
| 23516 | SLC39A14 | A002-C-016 | Human | Colorectum | FAP | 1.15e-09 | -2.23e-01 | 0.0521 |
| 23516 | SLC39A14 | A015-C-002 | Human | Colorectum | FAP | 5.12e-04 | -2.21e-01 | -0.0763 |
| 23516 | SLC39A14 | A001-C-203 | Human | Colorectum | FAP | 3.61e-02 | -1.80e-01 | -0.0481 |
| 23516 | SLC39A14 | A002-C-116 | Human | Colorectum | FAP | 5.17e-11 | -1.93e-01 | -0.0452 |
| 23516 | SLC39A14 | A014-C-008 | Human | Colorectum | FAP | 5.61e-07 | -3.22e-01 | -0.191 |
| 23516 | SLC39A14 | A018-E-020 | Human | Colorectum | FAP | 3.74e-09 | -2.31e-01 | -0.2034 |
| Page: 1 2 3 4 5 6 |
| Tissue | Expression Dynamics | Abbreviation |
| Colorectum (GSE201348) |  | FAP: Familial adenomatous polyposis |
| CRC: Colorectal cancer | ||
| Colorectum (HTA11) |  | AD: Adenomas |
| SER: Sessile serrated lesions | ||
| MSI-H: Microsatellite-high colorectal cancer | ||
| MSS: Microsatellite stable colorectal cancer | ||
| Esophagus | 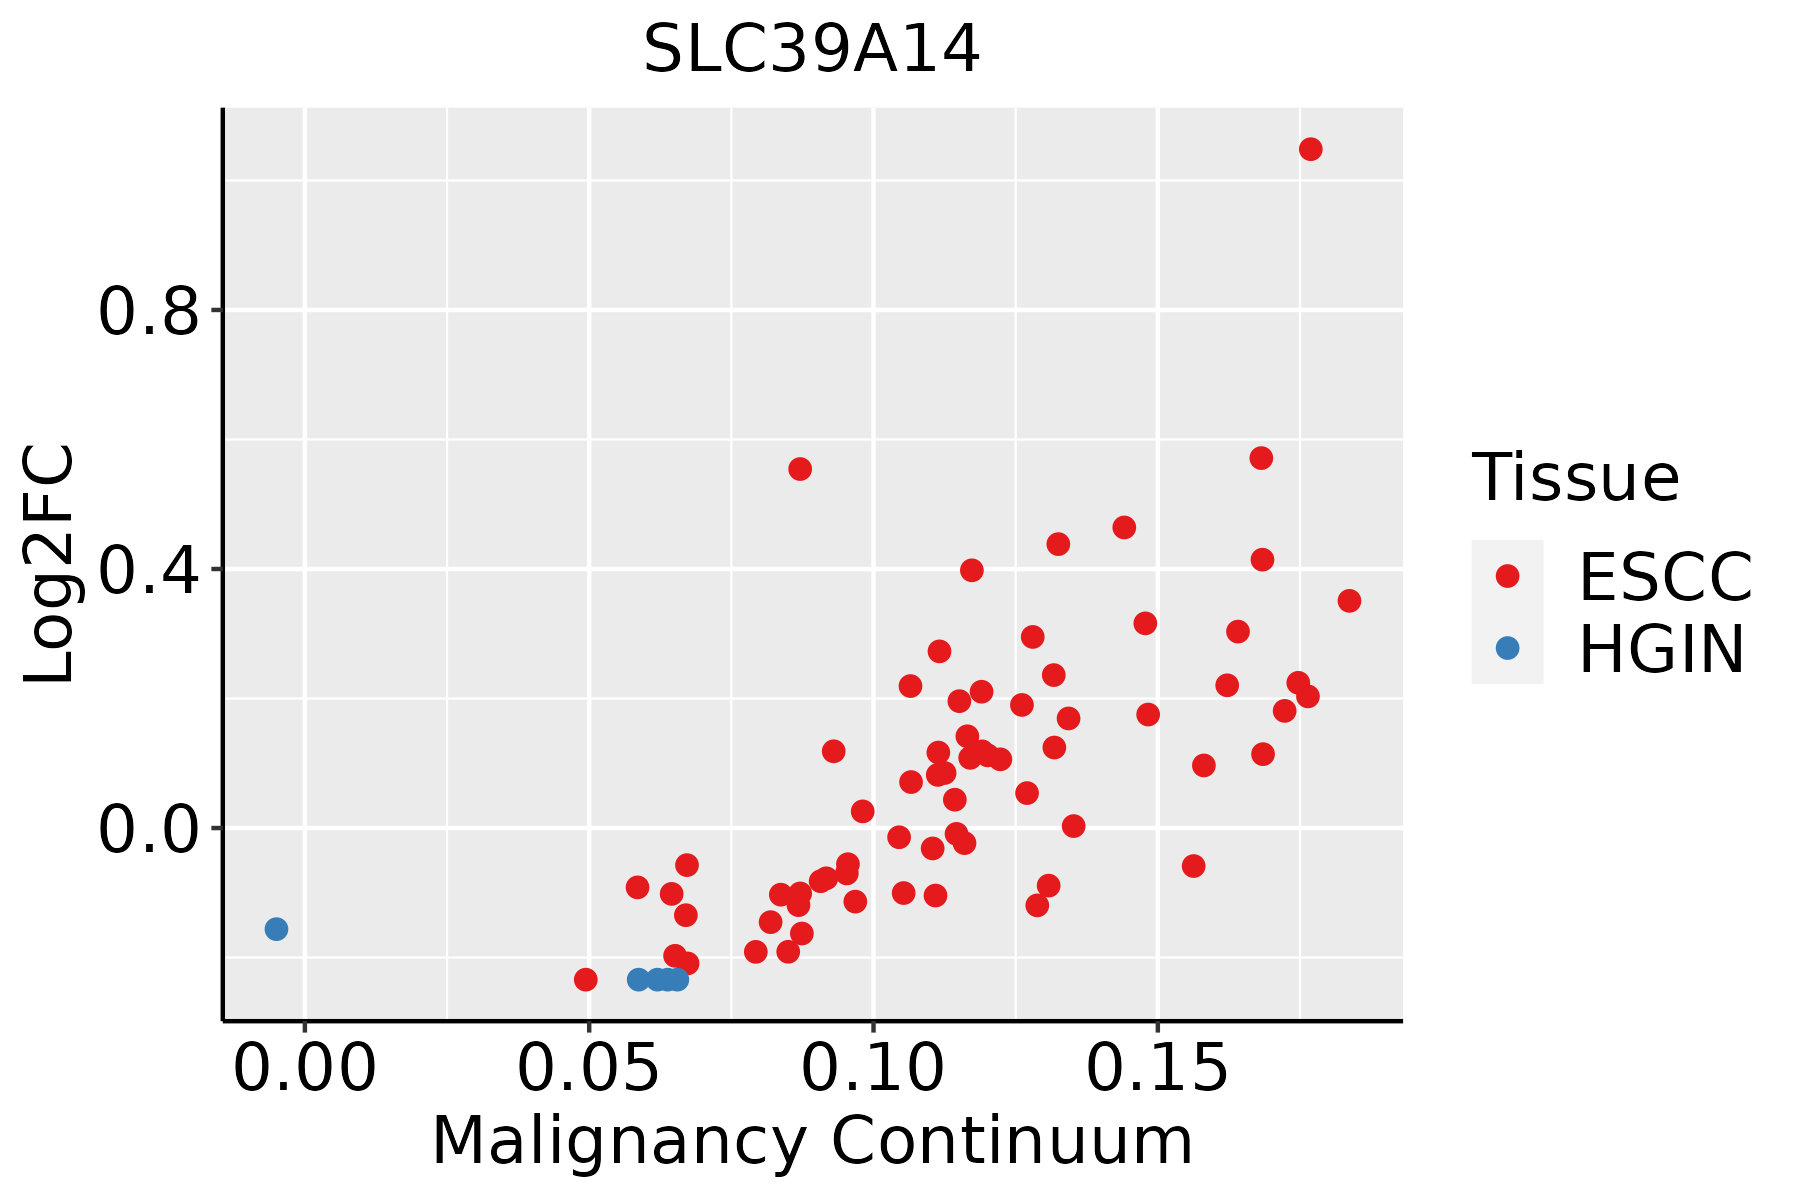 | ESCC: Esophageal squamous cell carcinoma |
| HGIN: High-grade intraepithelial neoplasias | ||
| LGIN: Low-grade intraepithelial neoplasias | ||
| Liver | 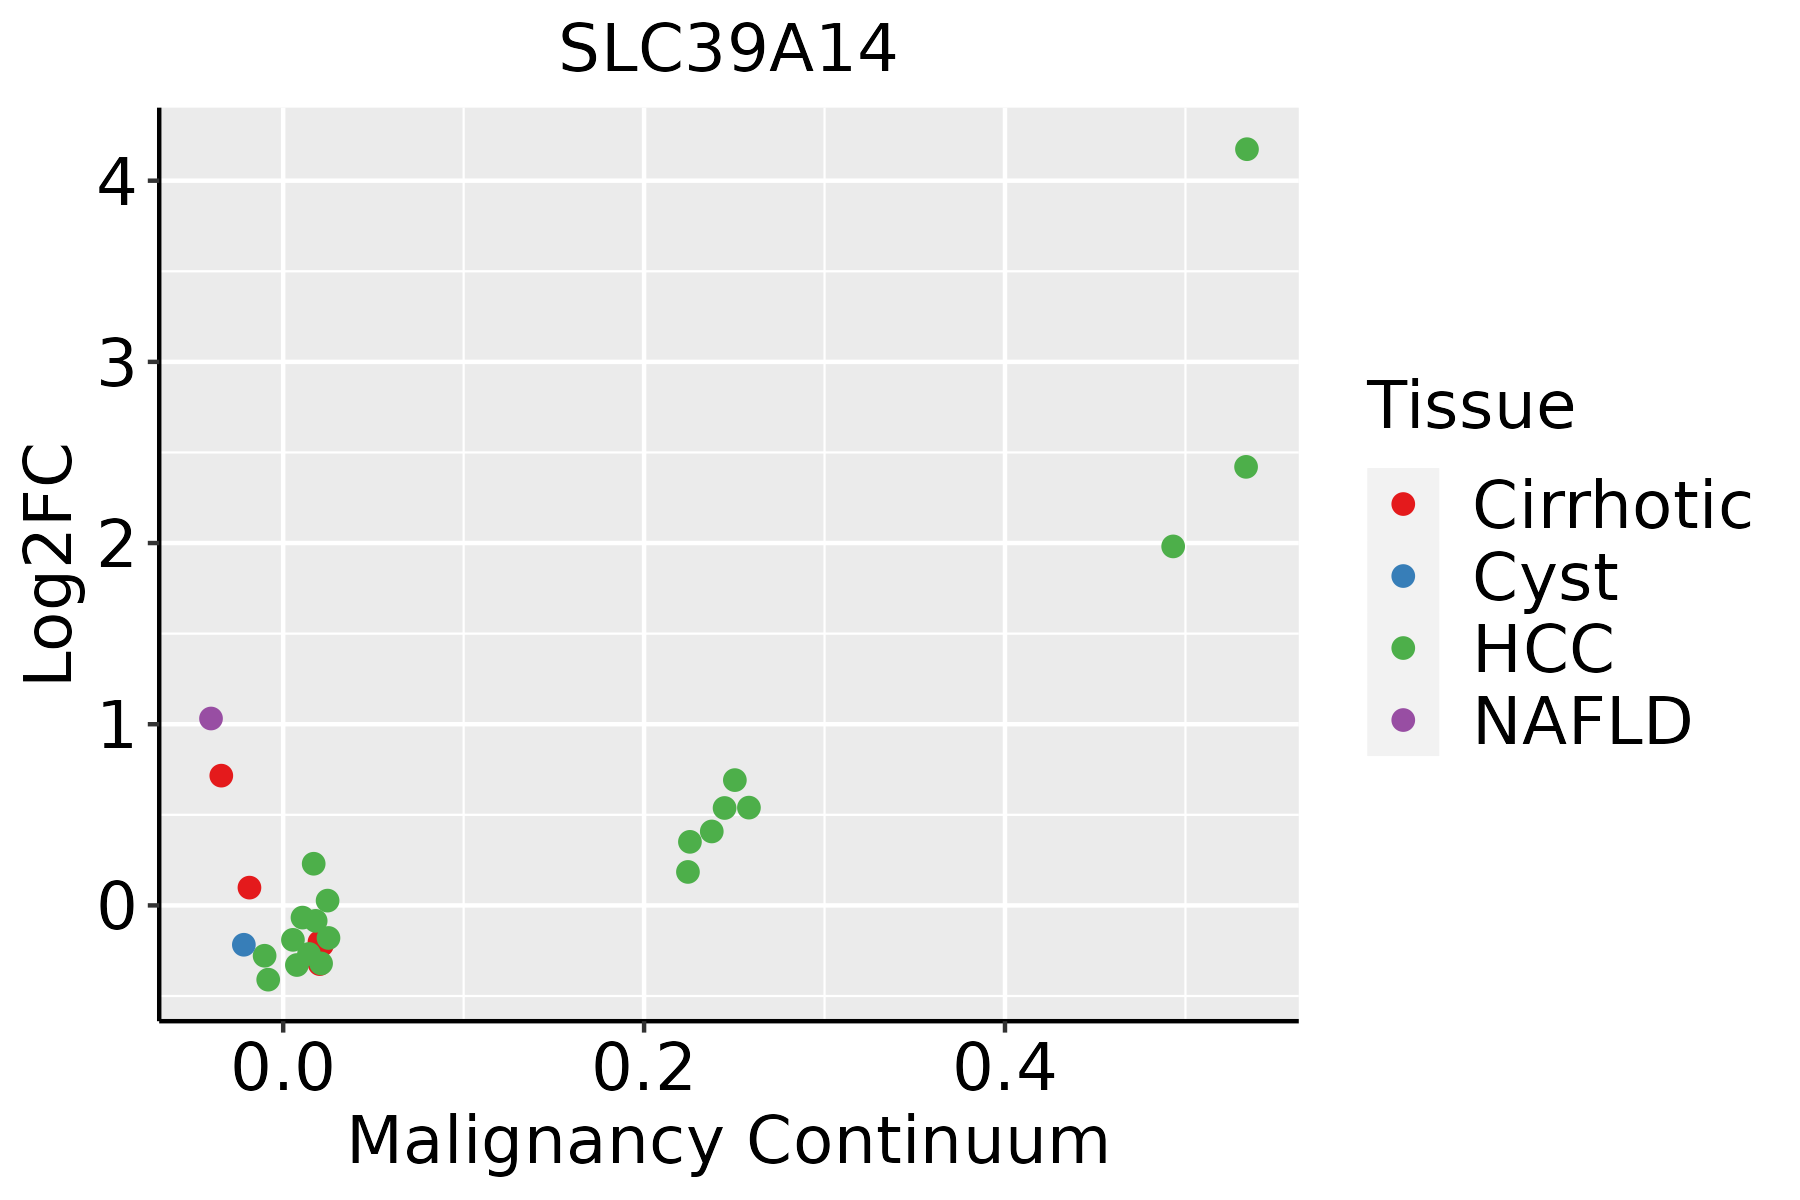 | HCC: Hepatocellular carcinoma |
| NAFLD: Non-alcoholic fatty liver disease | ||
| Oral Cavity | 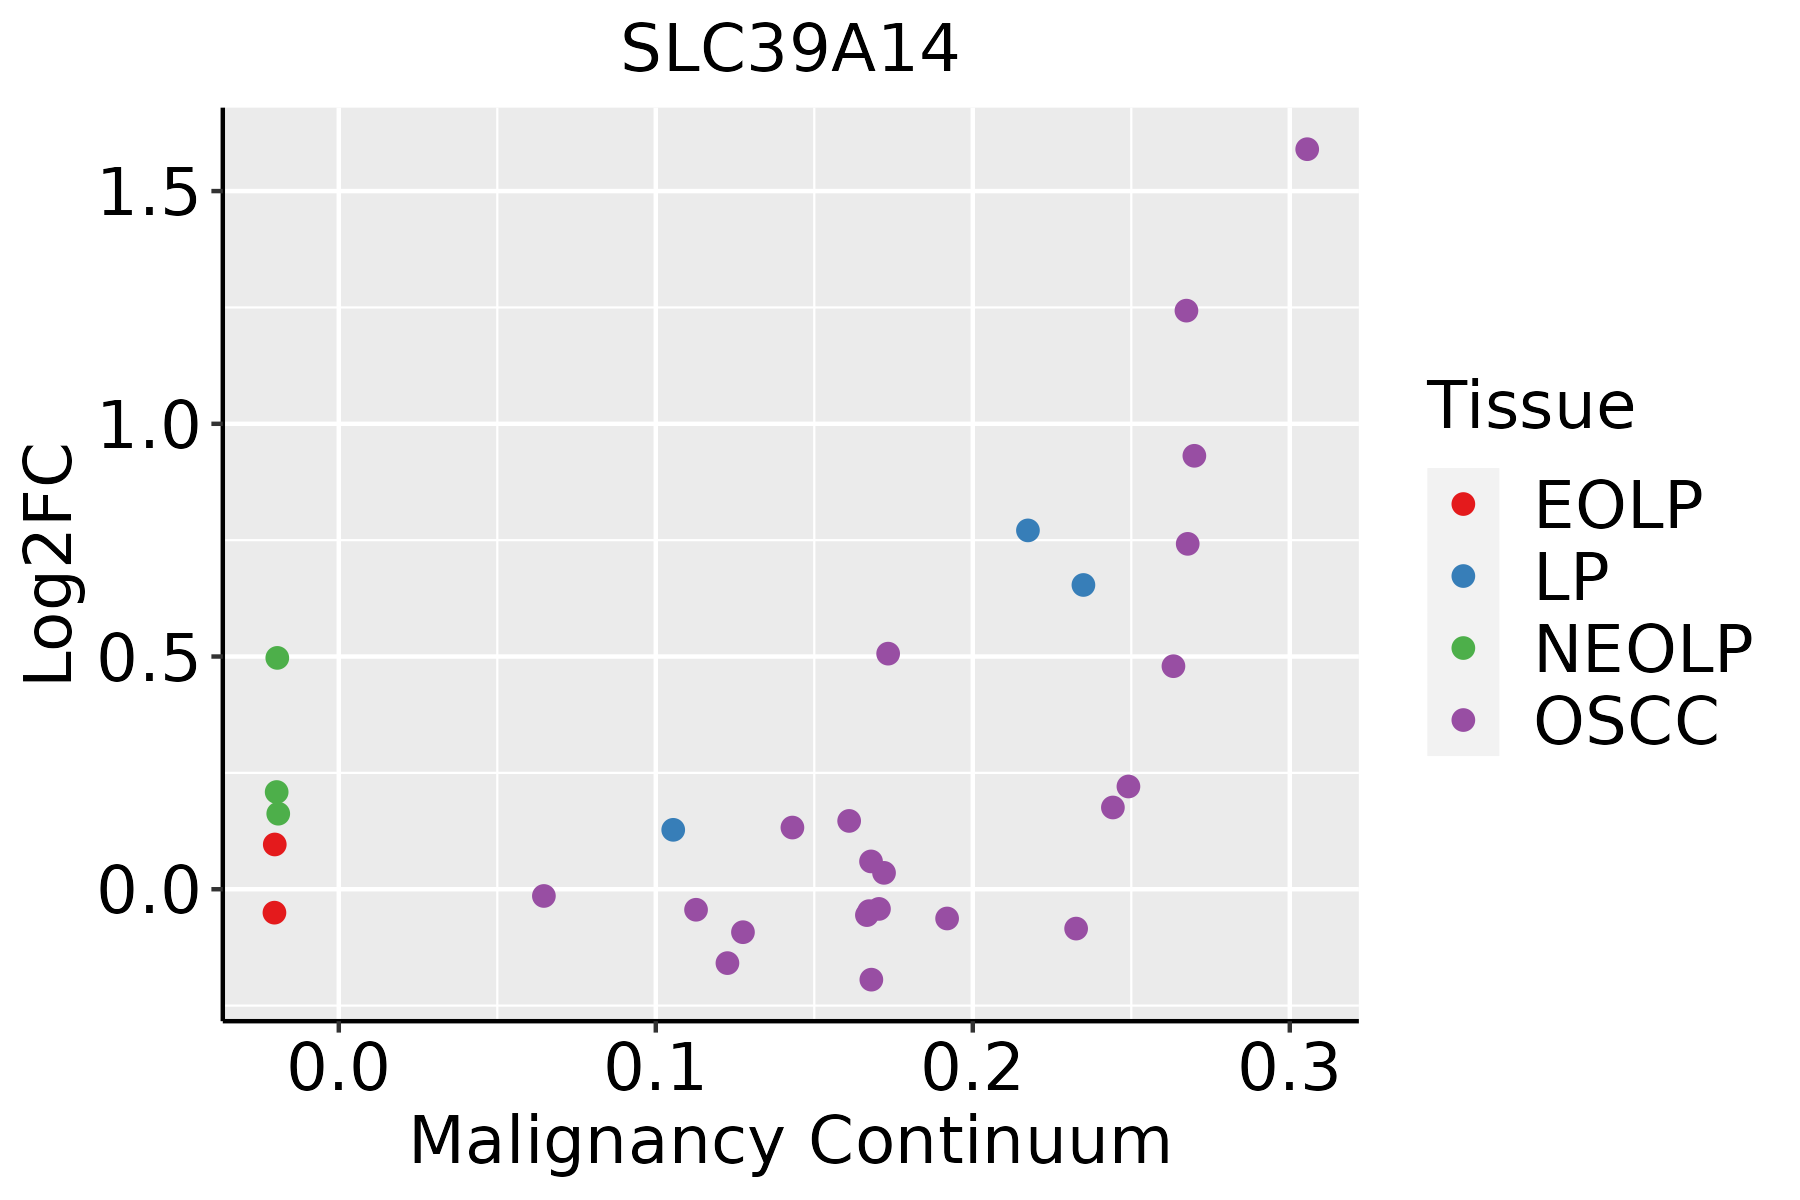 | EOLP: Erosive Oral lichen planus |
| LP: leukoplakia | ||
| NEOLP: Non-erosive oral lichen planus | ||
| OSCC: Oral squamous cell carcinoma | ||
| Thyroid | 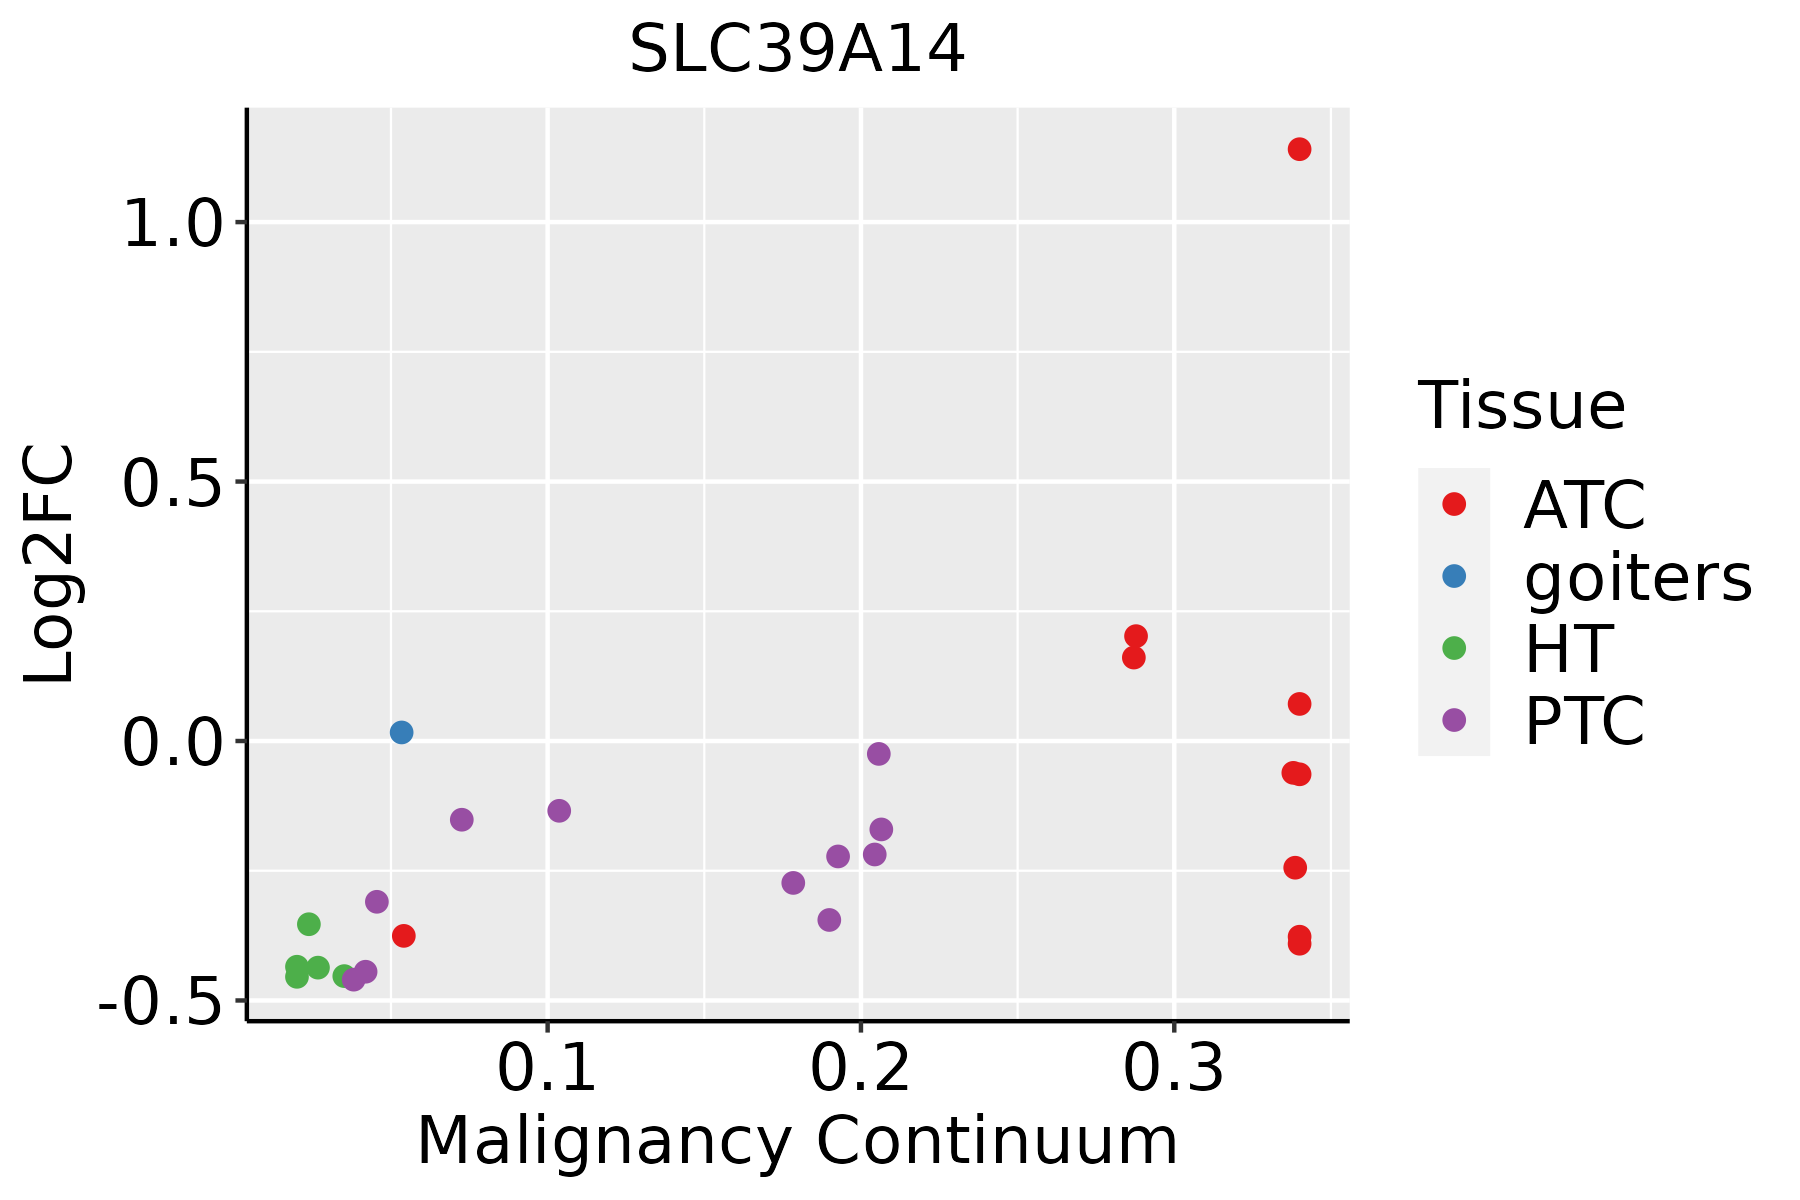 | ATC: Anaplastic thyroid cancer |
| HT: Hashimoto's thyroiditis | ||
| PTC: Papillary thyroid cancer |
| ∗log2FC in expression of this searched gene in stem-like cells from each diseased tissue sample relative to stem-like cells in normal samples in each tissue plotted against the malignancy continuum. Samples are colored based on if they are from different disease stage. |
Top |
Malignant transformation related pathway analysis |
| Find out the enriched GO biological processes and KEGG pathways involved in transition from healthy to precancer to cancer |
| Tissue | Disease Stage | Enriched GO biological Processes |
| Thyroid | PTC |  |
| Thyroid | goiters |  |
| Thyroid | ATC |  |
| ∗Top 15 enriched GO BP terms are showed in the bar plot of each disease state in each tissue. Each row represents a significant GO biological process which is colored according to the -log10(p.adjust). |
| Page: 1 2 3 4 5 6 7 8 9 |
| GO ID | Tissue | Disease Stage | Description | Gene Ratio | Bg Ratio | pvalue | p.adjust | Count |
| GO:0032868 | Colorectum | AD | response to insulin | 91/3918 | 264/18723 | 2.02e-07 | 8.48e-06 | 91 |
| GO:1901653 | Colorectum | AD | cellular response to peptide | 114/3918 | 359/18723 | 8.32e-07 | 2.88e-05 | 114 |
| GO:0009743 | Colorectum | AD | response to carbohydrate | 86/3918 | 253/18723 | 8.43e-07 | 2.90e-05 | 86 |
| GO:0032869 | Colorectum | AD | cellular response to insulin stimulus | 72/3918 | 203/18723 | 1.10e-06 | 3.68e-05 | 72 |
| GO:0071375 | Colorectum | AD | cellular response to peptide hormone stimulus | 95/3918 | 290/18723 | 1.50e-06 | 4.66e-05 | 95 |
| GO:0055076 | Colorectum | AD | transition metal ion homeostasis | 53/3918 | 138/18723 | 1.89e-06 | 5.65e-05 | 53 |
| GO:0043434 | Colorectum | AD | response to peptide hormone | 126/3918 | 414/18723 | 2.70e-06 | 7.86e-05 | 126 |
| GO:0034284 | Colorectum | AD | response to monosaccharide | 76/3918 | 225/18723 | 4.64e-06 | 1.23e-04 | 76 |
| GO:0033500 | Colorectum | AD | carbohydrate homeostasis | 84/3918 | 259/18723 | 9.10e-06 | 2.15e-04 | 84 |
| GO:0009746 | Colorectum | AD | response to hexose | 73/3918 | 219/18723 | 1.20e-05 | 2.65e-04 | 73 |
| GO:0009749 | Colorectum | AD | response to glucose | 71/3918 | 212/18723 | 1.31e-05 | 2.85e-04 | 71 |
| GO:0042593 | Colorectum | AD | glucose homeostasis | 83/3918 | 258/18723 | 1.44e-05 | 3.11e-04 | 83 |
| GO:0001678 | Colorectum | AD | cellular glucose homeostasis | 60/3918 | 172/18723 | 1.49e-05 | 3.18e-04 | 60 |
| GO:0019318 | Colorectum | AD | hexose metabolic process | 77/3918 | 237/18723 | 1.96e-05 | 4.01e-04 | 77 |
| GO:0046916 | Colorectum | AD | cellular transition metal ion homeostasis | 43/3918 | 115/18723 | 3.62e-05 | 6.56e-04 | 43 |
| GO:0071322 | Colorectum | AD | cellular response to carbohydrate stimulus | 56/3918 | 163/18723 | 4.61e-05 | 7.97e-04 | 56 |
| GO:0005996 | Colorectum | AD | monosaccharide metabolic process | 80/3918 | 257/18723 | 7.31e-05 | 1.17e-03 | 80 |
| GO:0071333 | Colorectum | AD | cellular response to glucose stimulus | 52/3918 | 151/18723 | 7.88e-05 | 1.25e-03 | 52 |
| GO:0071331 | Colorectum | AD | cellular response to hexose stimulus | 52/3918 | 153/18723 | 1.16e-04 | 1.71e-03 | 52 |
| GO:0071326 | Colorectum | AD | cellular response to monosaccharide stimulus | 52/3918 | 154/18723 | 1.40e-04 | 1.98e-03 | 52 |
| Page: 1 2 3 4 5 6 7 8 9 10 11 12 13 14 15 |
| Pathway ID | Tissue | Disease Stage | Description | Gene Ratio | Bg Ratio | pvalue | p.adjust | qvalue | Count |
| hsa05012 | Colorectum | AD | Parkinson disease | 147/2092 | 266/8465 | 2.53e-27 | 8.48e-25 | 5.41e-25 | 147 |
| hsa05010 | Colorectum | AD | Alzheimer disease | 174/2092 | 384/8465 | 1.82e-19 | 9.26e-18 | 5.91e-18 | 174 |
| hsa04216 | Colorectum | AD | Ferroptosis | 21/2092 | 41/8465 | 2.23e-04 | 1.78e-03 | 1.13e-03 | 21 |
| hsa050121 | Colorectum | AD | Parkinson disease | 147/2092 | 266/8465 | 2.53e-27 | 8.48e-25 | 5.41e-25 | 147 |
| hsa050101 | Colorectum | AD | Alzheimer disease | 174/2092 | 384/8465 | 1.82e-19 | 9.26e-18 | 5.91e-18 | 174 |
| hsa042161 | Colorectum | AD | Ferroptosis | 21/2092 | 41/8465 | 2.23e-04 | 1.78e-03 | 1.13e-03 | 21 |
| hsa050128 | Colorectum | FAP | Parkinson disease | 80/1404 | 266/8465 | 2.04e-08 | 6.20e-07 | 3.77e-07 | 80 |
| hsa050108 | Colorectum | FAP | Alzheimer disease | 105/1404 | 384/8465 | 3.74e-08 | 1.04e-06 | 6.33e-07 | 105 |
| hsa042164 | Colorectum | FAP | Ferroptosis | 18/1404 | 41/8465 | 3.49e-05 | 3.65e-04 | 2.22e-04 | 18 |
| hsa050129 | Colorectum | FAP | Parkinson disease | 80/1404 | 266/8465 | 2.04e-08 | 6.20e-07 | 3.77e-07 | 80 |
| hsa050109 | Colorectum | FAP | Alzheimer disease | 105/1404 | 384/8465 | 3.74e-08 | 1.04e-06 | 6.33e-07 | 105 |
| hsa042165 | Colorectum | FAP | Ferroptosis | 18/1404 | 41/8465 | 3.49e-05 | 3.65e-04 | 2.22e-04 | 18 |
| hsa05012211 | Esophagus | ESCC | Parkinson disease | 201/4205 | 266/8465 | 1.56e-18 | 8.72e-17 | 4.46e-17 | 201 |
| hsa05010210 | Esophagus | ESCC | Alzheimer disease | 263/4205 | 384/8465 | 1.80e-14 | 5.47e-13 | 2.80e-13 | 263 |
| hsa0421629 | Esophagus | ESCC | Ferroptosis | 33/4205 | 41/8465 | 4.58e-05 | 1.99e-04 | 1.02e-04 | 33 |
| hsa05012310 | Esophagus | ESCC | Parkinson disease | 201/4205 | 266/8465 | 1.56e-18 | 8.72e-17 | 4.46e-17 | 201 |
| hsa0501038 | Esophagus | ESCC | Alzheimer disease | 263/4205 | 384/8465 | 1.80e-14 | 5.47e-13 | 2.80e-13 | 263 |
| hsa0421638 | Esophagus | ESCC | Ferroptosis | 33/4205 | 41/8465 | 4.58e-05 | 1.99e-04 | 1.02e-04 | 33 |
| hsa042168 | Liver | NAFLD | Ferroptosis | 12/1043 | 41/8465 | 2.98e-03 | 2.96e-02 | 2.39e-02 | 12 |
| hsa0421611 | Liver | NAFLD | Ferroptosis | 12/1043 | 41/8465 | 2.98e-03 | 2.96e-02 | 2.39e-02 | 12 |
| Page: 1 2 3 |
Top |
Cell-cell communication analysis |
| Identification of potential cell-cell interactions between two cell types and their ligand-receptor pairs for different disease states |
| Ligand | Receptor | LRpair | Pathway | Tissue | Disease Stage |
| Page: 1 |
Top |
Single-cell gene regulatory network inference analysis |
| Find out the significant the regulons (TFs) and the target genes of each regulon across cell types for different disease states |
| TF | Cell Type | Tissue | Disease Stage | Target Gene | RSS | Regulon Activity |
| ∗The dot plots of a searched regulon are shown for all cell subpopulations in each disease state of each tissue based on the regulon specific score inferred using pySCENIC and by calculating the average expression. |
| Page: 1 |
Top |
Somatic mutation of malignant transformation related genes |
| Annotation of somatic variants for genes involved in malignant transformation |
| Hugo Symbol | Variant Class | Variant Classification | dbSNP RS | HGVSc | HGVSp | HGVSp Short | SWISSPROT | BIOTYPE | SIFT | PolyPhen | Tumor Sample Barcode | Tissue | Histology | Sex | Age | Stage | Therapy Types | Drugs | Outcome |
| SLC39A14 | SNV | Missense_Mutation | novel | c.92N>T | p.Ser31Leu | p.S31L | Q15043 | protein_coding | tolerated_low_confidence(0.32) | benign(0) | TCGA-BH-A0B6-01 | Breast | breast invasive carcinoma | Female | <65 | I/II | Unknown | Unknown | SD |
| SLC39A14 | SNV | Missense_Mutation | c.1357N>G | p.Gln453Glu | p.Q453E | Q15043 | protein_coding | tolerated(0.08) | benign(0.003) | TCGA-C8-A132-01 | Breast | breast invasive carcinoma | Female | <65 | I/II | Unknown | Unknown | SD | |
| SLC39A14 | SNV | Missense_Mutation | novel | c.923G>A | p.Gly308Asp | p.G308D | Q15043 | protein_coding | tolerated(0.31) | benign(0.014) | TCGA-D8-A73W-01 | Breast | breast invasive carcinoma | Female | >=65 | III/IV | Hormone Therapy | tamoxiphen | PD |
| SLC39A14 | insertion | Nonsense_Mutation | novel | c.1439_1440insACTCCAGAGGCTTTAGGGACGACGTAG | p.Val480_Val481insLeuGlnArgLeuTerGlyArgArgArg | p.V480_V481insLQRL*GRRR | Q15043 | protein_coding | TCGA-A2-A0CT-01 | Breast | breast invasive carcinoma | Female | >=65 | I/II | Chemotherapy | cytoxan | SD | ||
| SLC39A14 | insertion | Nonsense_Mutation | novel | c.1329_1330insGTGGCCTAACCACCATTTCTTAACGATTAAATAGATAATTTAAA | p.Met444ValfsTer3 | p.M444Vfs*3 | Q15043 | protein_coding | TCGA-A8-A08H-01 | Breast | breast invasive carcinoma | Female | >=65 | I/II | Unknown | Unknown | SD | ||
| SLC39A14 | insertion | Frame_Shift_Ins | novel | c.718_719insCAGACTGGAGTGCAGTGGTGCCATCTCGGCTCAC | p.Ile240ThrfsTer18 | p.I240Tfs*18 | Q15043 | protein_coding | TCGA-BH-A0DP-01 | Breast | breast invasive carcinoma | Female | <65 | I/II | Hormone Therapy | arimidex | SD | ||
| SLC39A14 | SNV | Missense_Mutation | novel | c.1179N>C | p.Met393Ile | p.M393I | Q15043 | protein_coding | deleterious(0.01) | probably_damaging(0.996) | TCGA-HM-A4S6-01 | Cervix | cervical & endocervical cancer | Female | <65 | III/IV | Chemotherapy | cisplatin | CR |
| SLC39A14 | SNV | Missense_Mutation | novel | c.125N>T | p.Ser42Phe | p.S42F | Q15043 | protein_coding | deleterious(0.01) | benign(0.01) | TCGA-PN-A8MA-01 | Cervix | cervical & endocervical cancer | Female | <65 | I/II | Chemotherapy | cisplatin | SD |
| SLC39A14 | SNV | Missense_Mutation | novel | c.763N>A | p.His255Asn | p.H255N | Q15043 | protein_coding | deleterious(0.01) | probably_damaging(0.992) | TCGA-VS-A9UD-01 | Cervix | cervical & endocervical cancer | Female | >=65 | III/IV | Chemotherapy | cisplatin | CR |
| SLC39A14 | SNV | Missense_Mutation | novel | c.1096G>T | p.Gly366Cys | p.G366C | Q15043 | protein_coding | deleterious(0) | probably_damaging(1) | TCGA-A6-2672-01 | Colorectum | colon adenocarcinoma | Female | >=65 | III/IV | Unknown | Unknown | SD |
| Page: 1 2 3 4 5 |
Top |
Related drugs of malignant transformation related genes |
| Identification of chemicals and drugs interact with genes involved in malignant transfromation |
| (DGIdb 4.0) |
| Entrez ID | Symbol | Category | Interaction Types | Drug Claim Name | Drug Name | PMIDs |
| 23516 | SLC39A14 | TRANSPORTER | nortriptyline | NORTRIPTYLINE | 20970119 |
| Page: 1 |

Copyright 2023-Present -The University of Texas Health Science Center at Houston |