
|
|||||
|
 | |
| |
| |
| |
| |
| |
|
Gene: SELM |
Gene summary for SELM |
| Gene information | Species | Human | Gene symbol | SELM | Gene ID | 140606 |
| Gene name | selenoprotein M | |
| Gene Alias | SELM | |
| Cytomap | 22q12.2 | |
| Gene Type | protein-coding | GO ID | GO:0003008 | UniProtAcc | Q8WWX9 |
Top |
Malignant transformation analysis |
| Identification of the aberrant gene expression in precancerous and cancerous lesions by comparing the gene expression of stem-like cells in diseased tissues with normal stem cells |
| Entrez ID | Symbol | Replicates | Species | Organ | Tissue | Adj P-value | Log2FC | Malignancy |
| 140606 | SELM | GSM4909280 | Human | Breast | Precancer | 5.06e-04 | -5.94e-01 | 0.0305 |
| 140606 | SELM | GSM4909281 | Human | Breast | IDC | 3.27e-25 | -5.94e-01 | 0.21 |
| 140606 | SELM | GSM4909282 | Human | Breast | IDC | 2.34e-26 | -5.94e-01 | -0.0288 |
| 140606 | SELM | GSM4909285 | Human | Breast | IDC | 5.65e-26 | -5.94e-01 | 0.21 |
| 140606 | SELM | GSM4909286 | Human | Breast | IDC | 1.87e-24 | -5.94e-01 | 0.1081 |
| 140606 | SELM | GSM4909287 | Human | Breast | IDC | 3.08e-30 | -5.94e-01 | 0.2057 |
| 140606 | SELM | GSM4909288 | Human | Breast | IDC | 4.63e-08 | -5.94e-01 | 0.0988 |
| 140606 | SELM | GSM4909289 | Human | Breast | IDC | 6.02e-06 | -5.94e-01 | 0.1064 |
| 140606 | SELM | GSM4909290 | Human | Breast | IDC | 4.47e-22 | -5.94e-01 | 0.2096 |
| 140606 | SELM | GSM4909291 | Human | Breast | IDC | 3.78e-18 | -5.94e-01 | 0.1753 |
| 140606 | SELM | GSM4909292 | Human | Breast | IDC | 6.05e-03 | -5.94e-01 | 0.1236 |
| 140606 | SELM | GSM4909293 | Human | Breast | IDC | 1.36e-25 | -5.94e-01 | 0.1581 |
| 140606 | SELM | GSM4909294 | Human | Breast | IDC | 3.27e-25 | -5.94e-01 | 0.2022 |
| 140606 | SELM | GSM4909295 | Human | Breast | IDC | 1.54e-14 | -5.94e-01 | 0.0898 |
| 140606 | SELM | GSM4909296 | Human | Breast | IDC | 1.36e-25 | -5.94e-01 | 0.1524 |
| 140606 | SELM | GSM4909297 | Human | Breast | IDC | 9.66e-27 | -5.94e-01 | 0.1517 |
| 140606 | SELM | GSM4909298 | Human | Breast | IDC | 1.36e-25 | -5.94e-01 | 0.1551 |
| 140606 | SELM | GSM4909299 | Human | Breast | IDC | 7.84e-25 | -5.94e-01 | 0.035 |
| 140606 | SELM | GSM4909300 | Human | Breast | IDC | 5.60e-13 | -5.94e-01 | 0.0334 |
| 140606 | SELM | GSM4909301 | Human | Breast | IDC | 1.36e-25 | -5.94e-01 | 0.1577 |
| Page: 1 2 3 4 5 6 7 8 9 10 11 12 |
| Tissue | Expression Dynamics | Abbreviation |
| Breast | 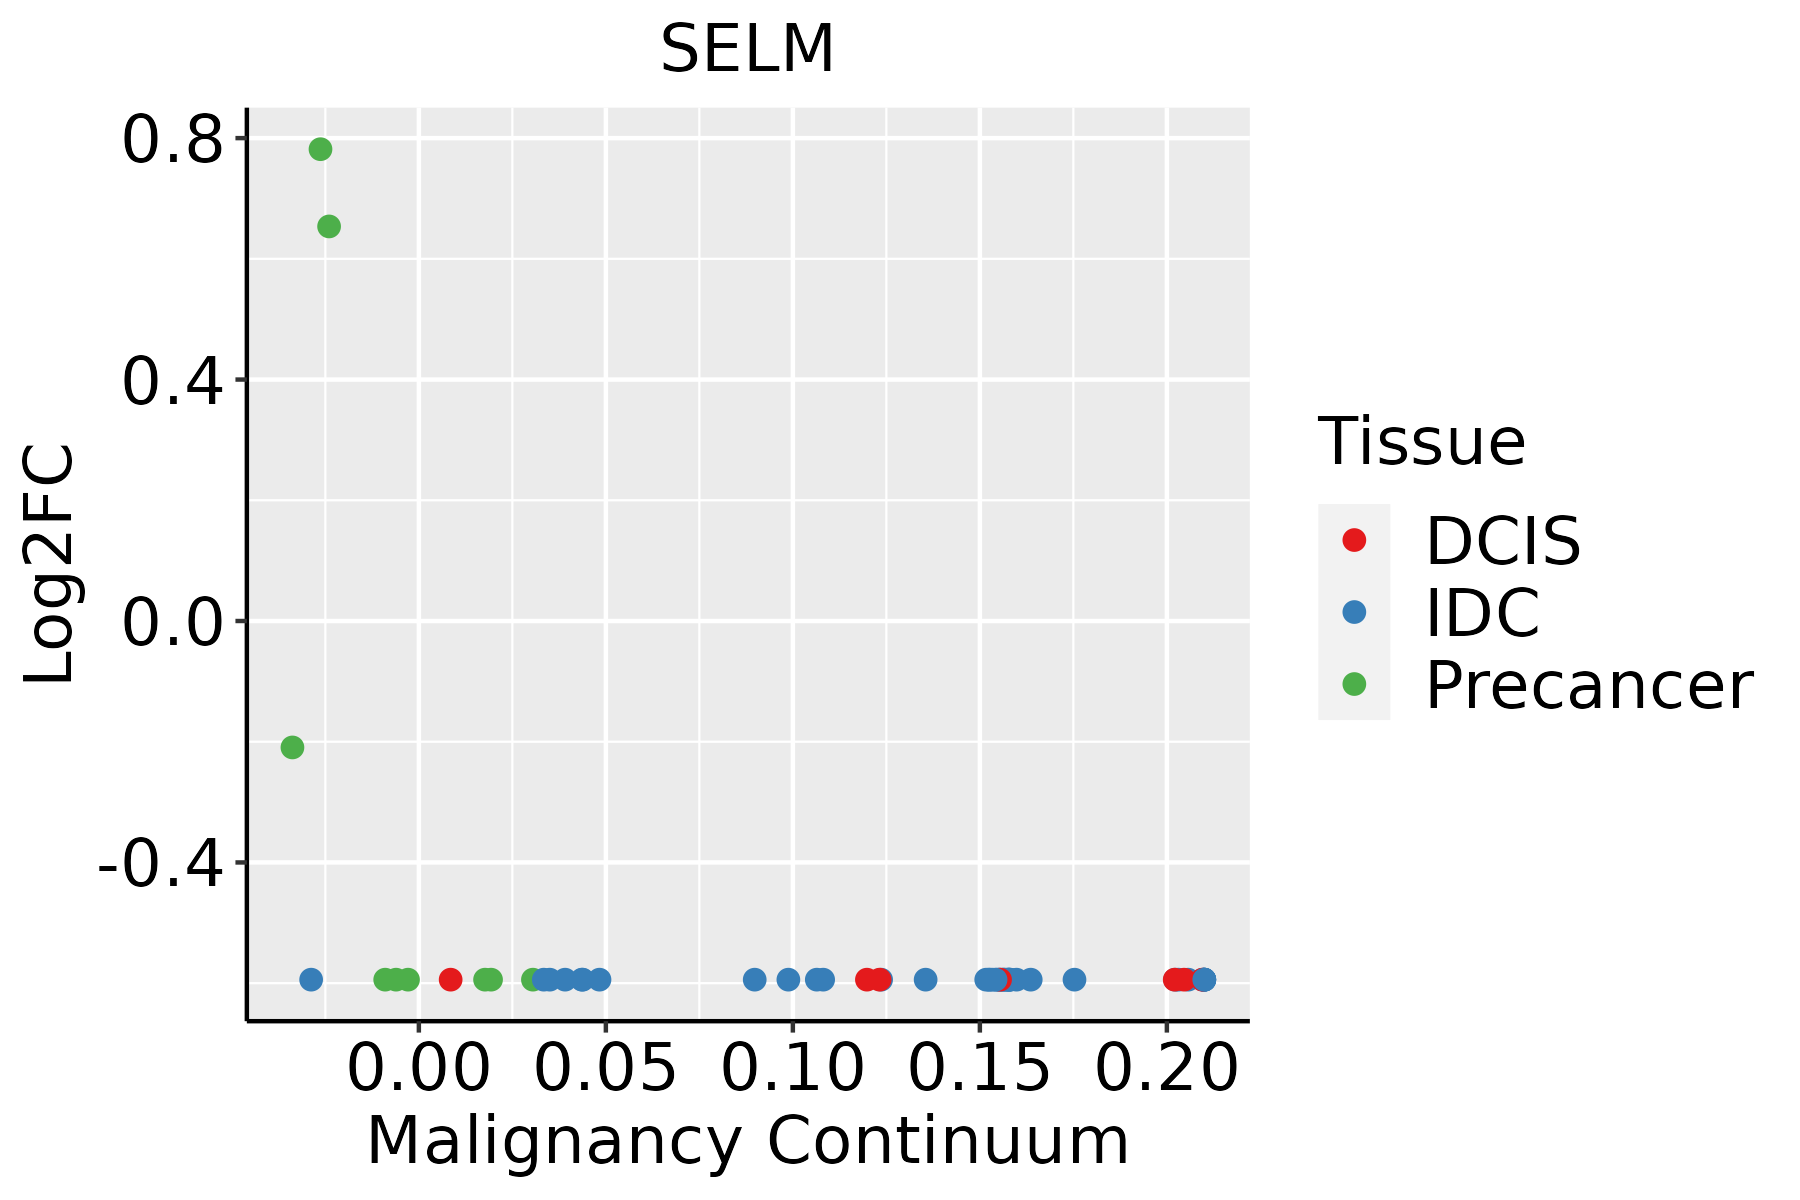 | IDC: Invasive ductal carcinoma |
| DCIS: Ductal carcinoma in situ | ||
| Precancer(BRCA1-mut): Precancerous lesion from BRCA1 mutation carriers | ||
| Endometrium | 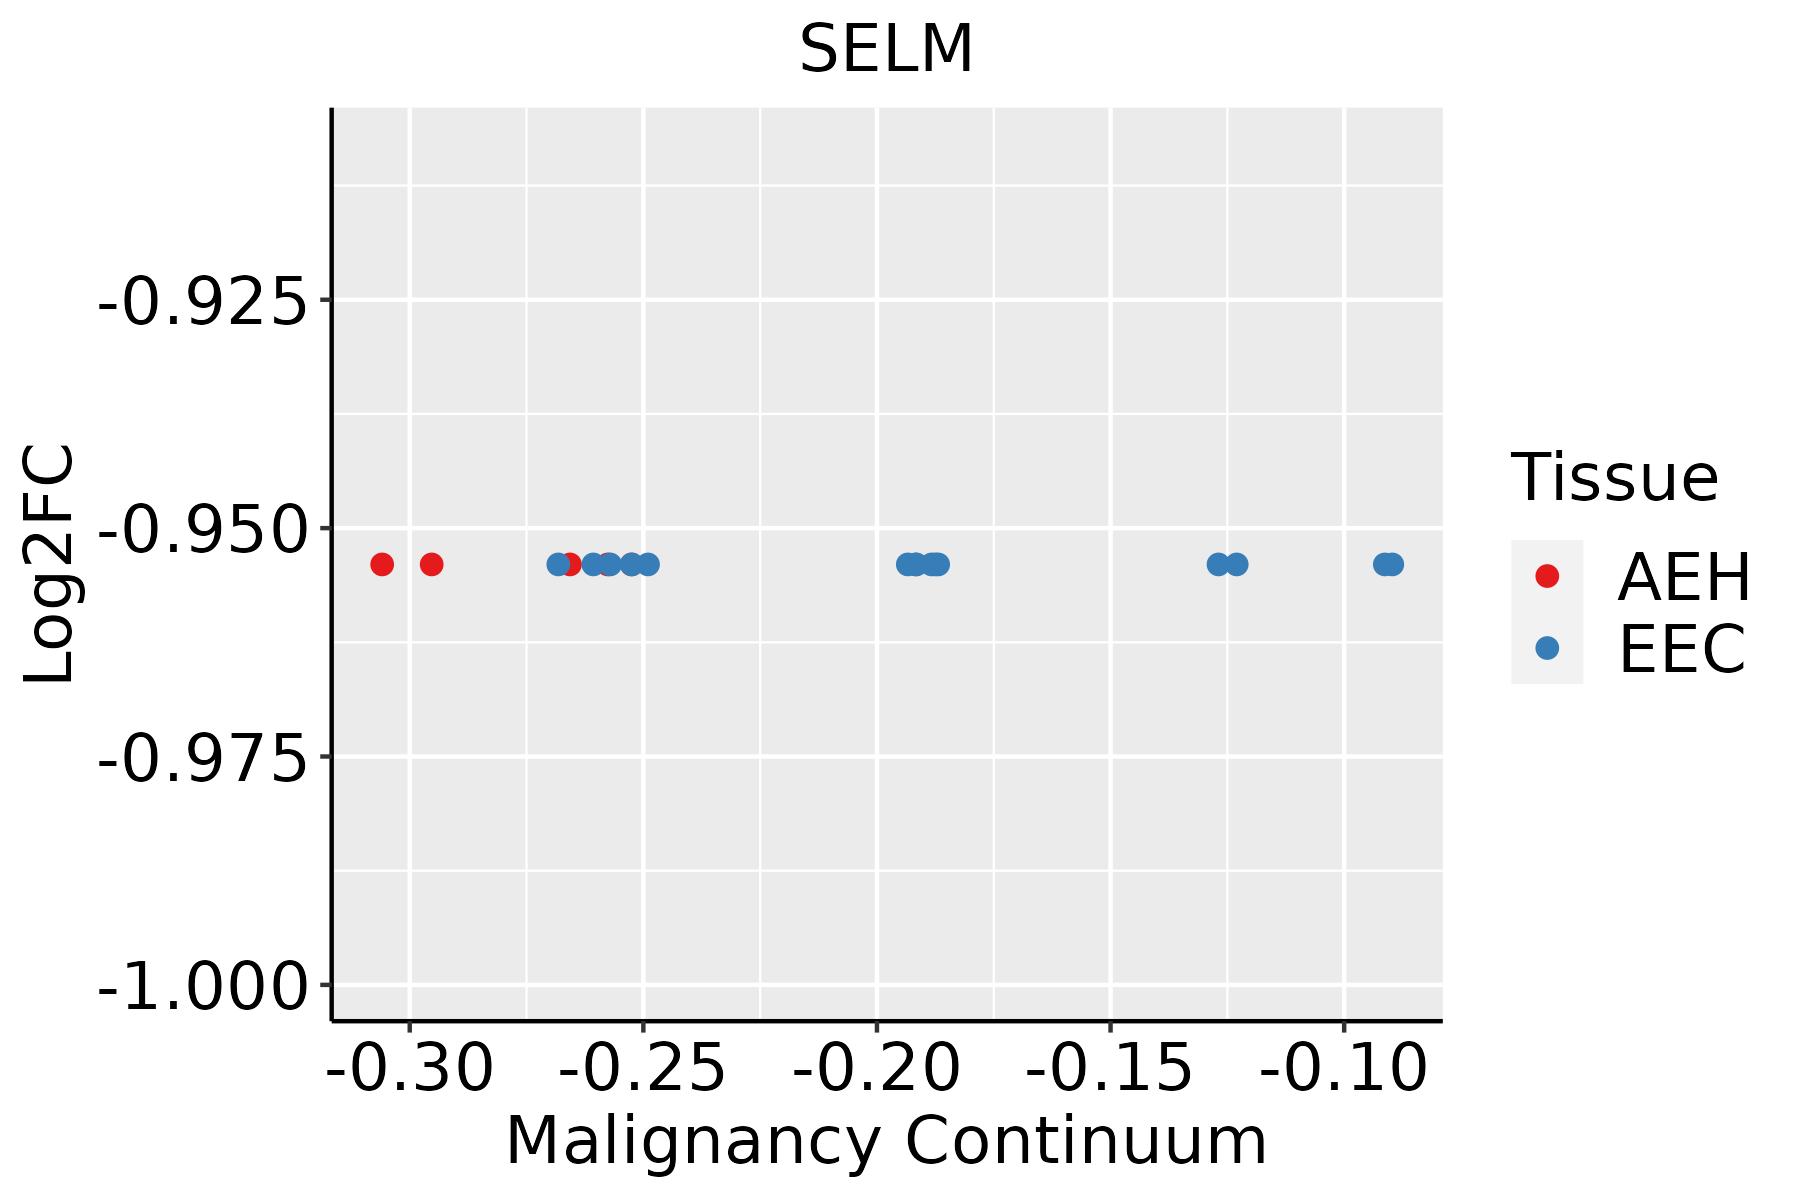 | AEH: Atypical endometrial hyperplasia |
| EEC: Endometrioid Cancer | ||
| Esophagus | 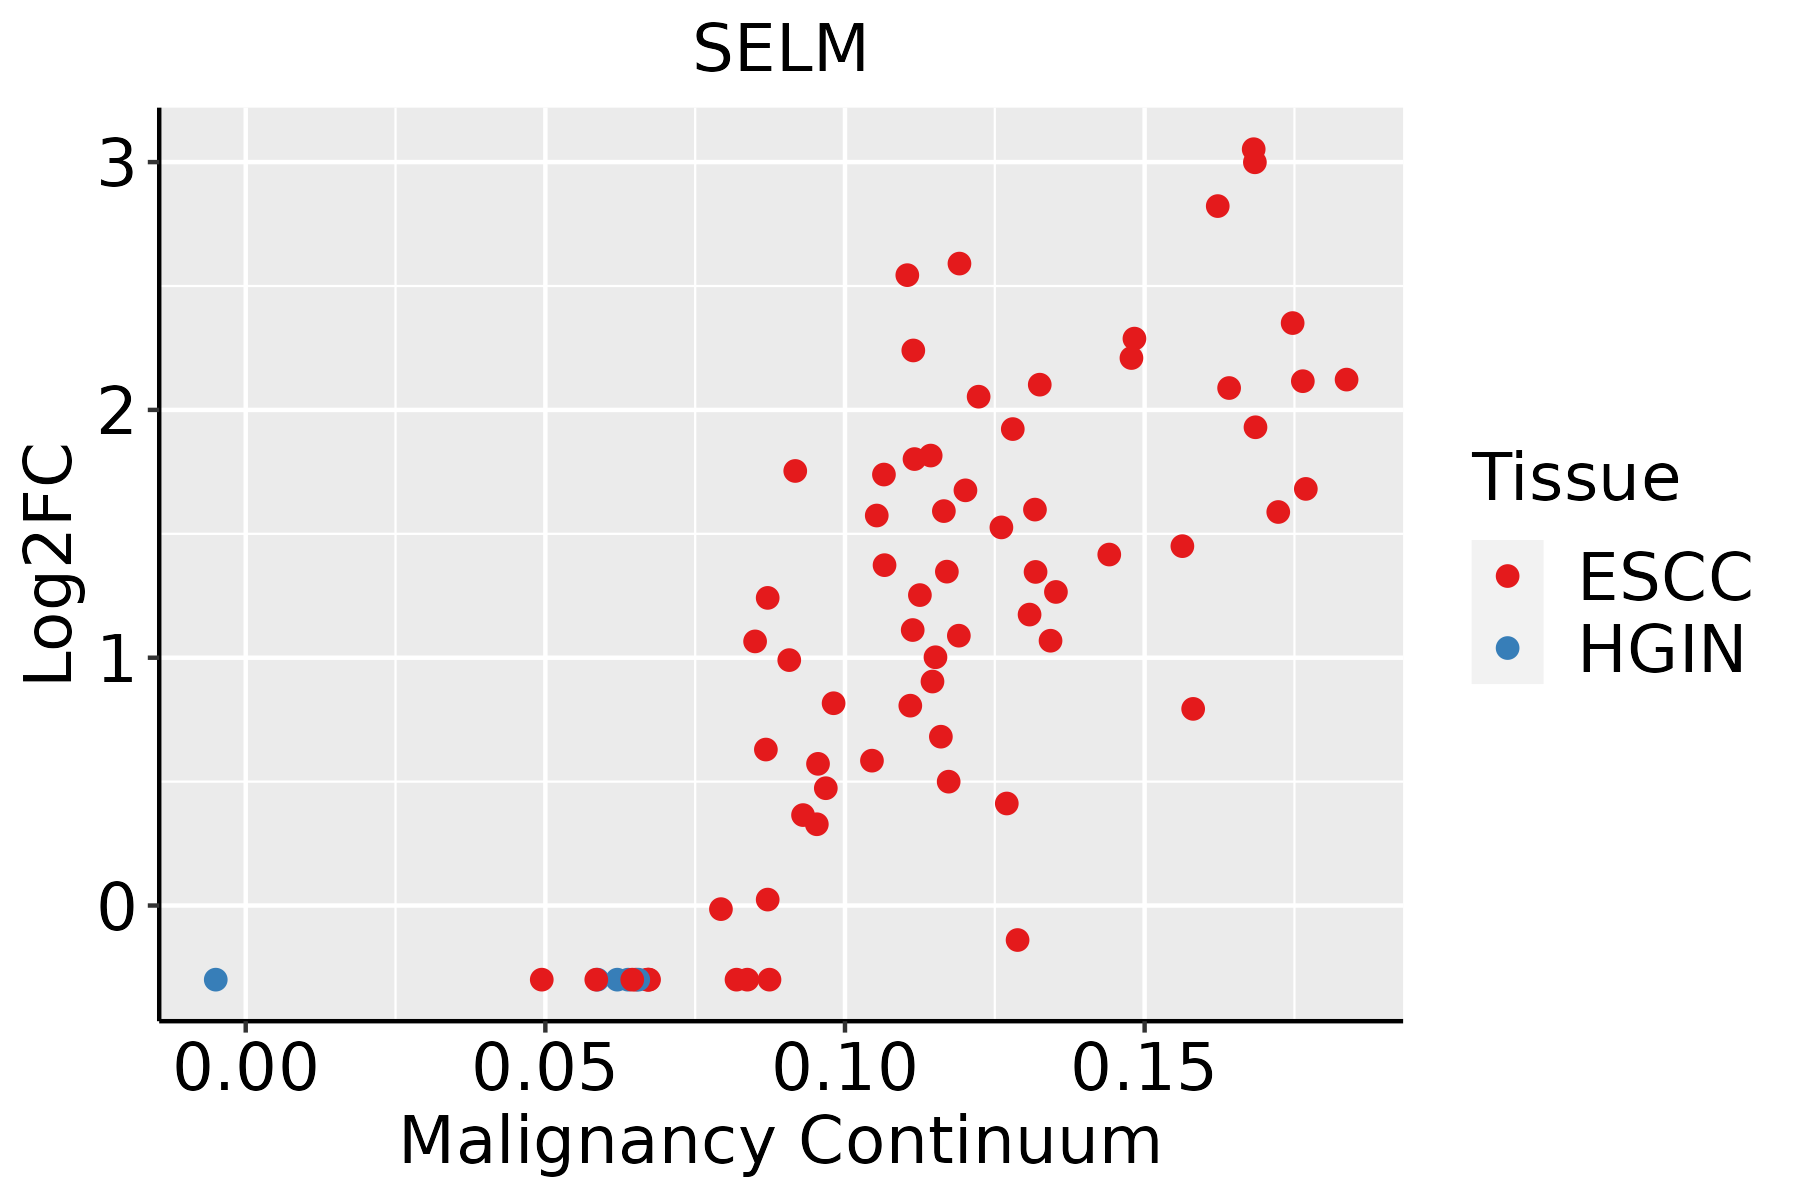 | ESCC: Esophageal squamous cell carcinoma |
| HGIN: High-grade intraepithelial neoplasias | ||
| LGIN: Low-grade intraepithelial neoplasias | ||
| Liver | 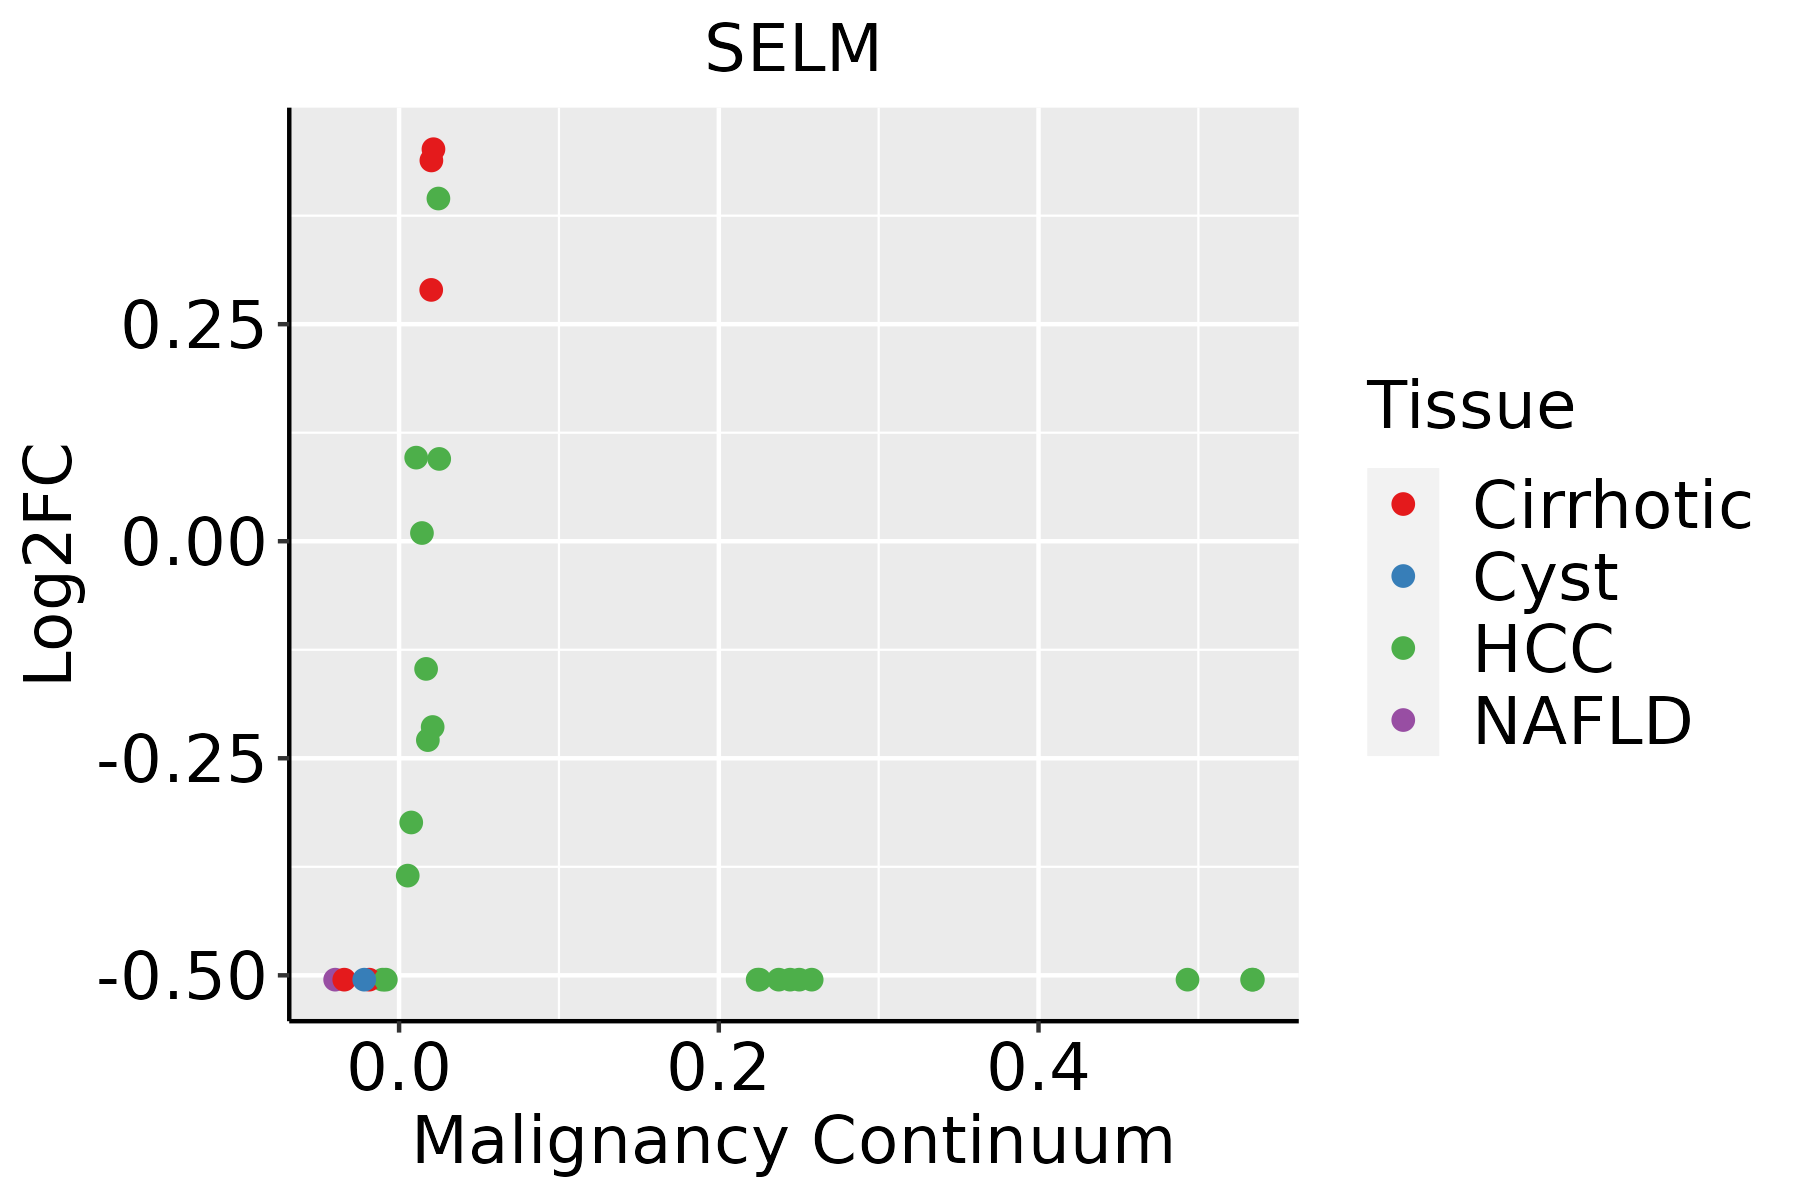 | HCC: Hepatocellular carcinoma |
| NAFLD: Non-alcoholic fatty liver disease | ||
| Oral Cavity |  | EOLP: Erosive Oral lichen planus |
| LP: leukoplakia | ||
| NEOLP: Non-erosive oral lichen planus | ||
| OSCC: Oral squamous cell carcinoma | ||
| Prostate | 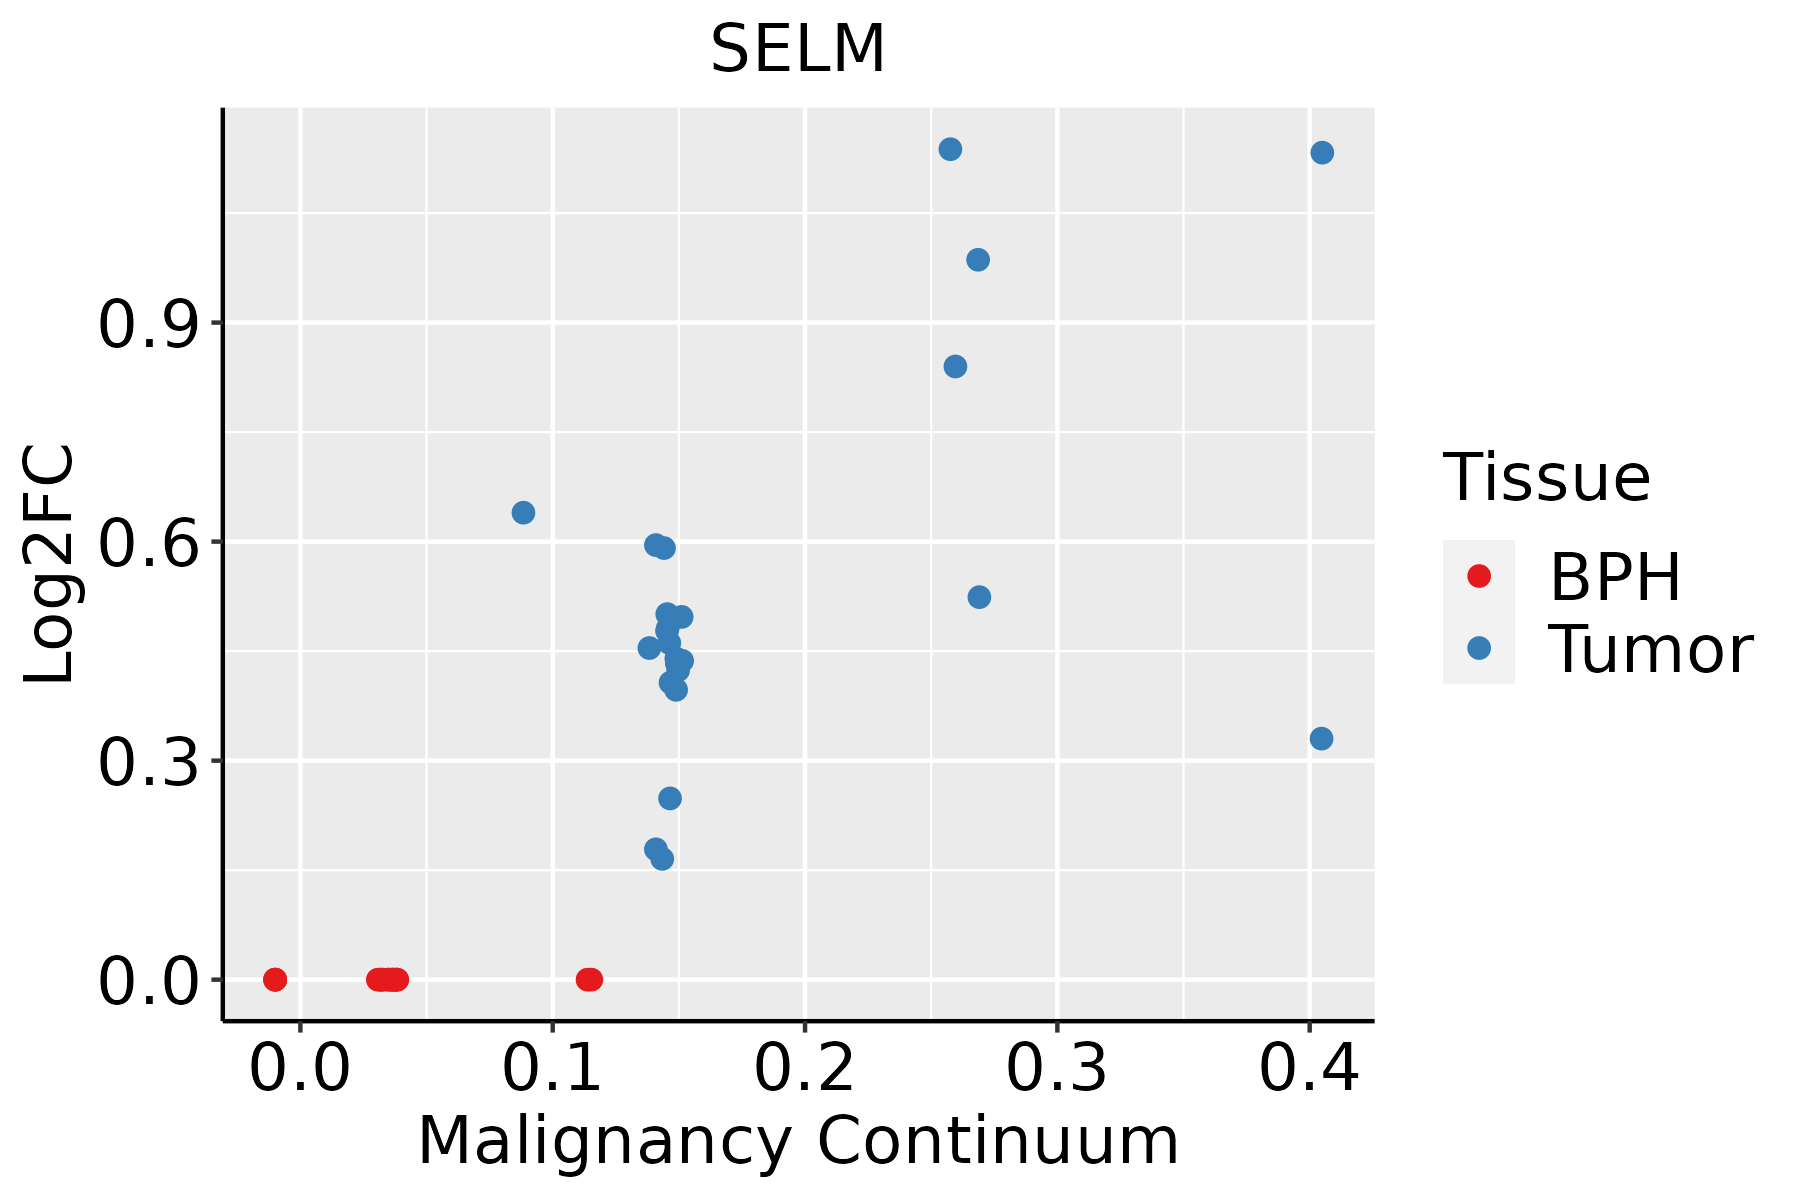 | BPH: Benign Prostatic Hyperplasia |
| Skin | 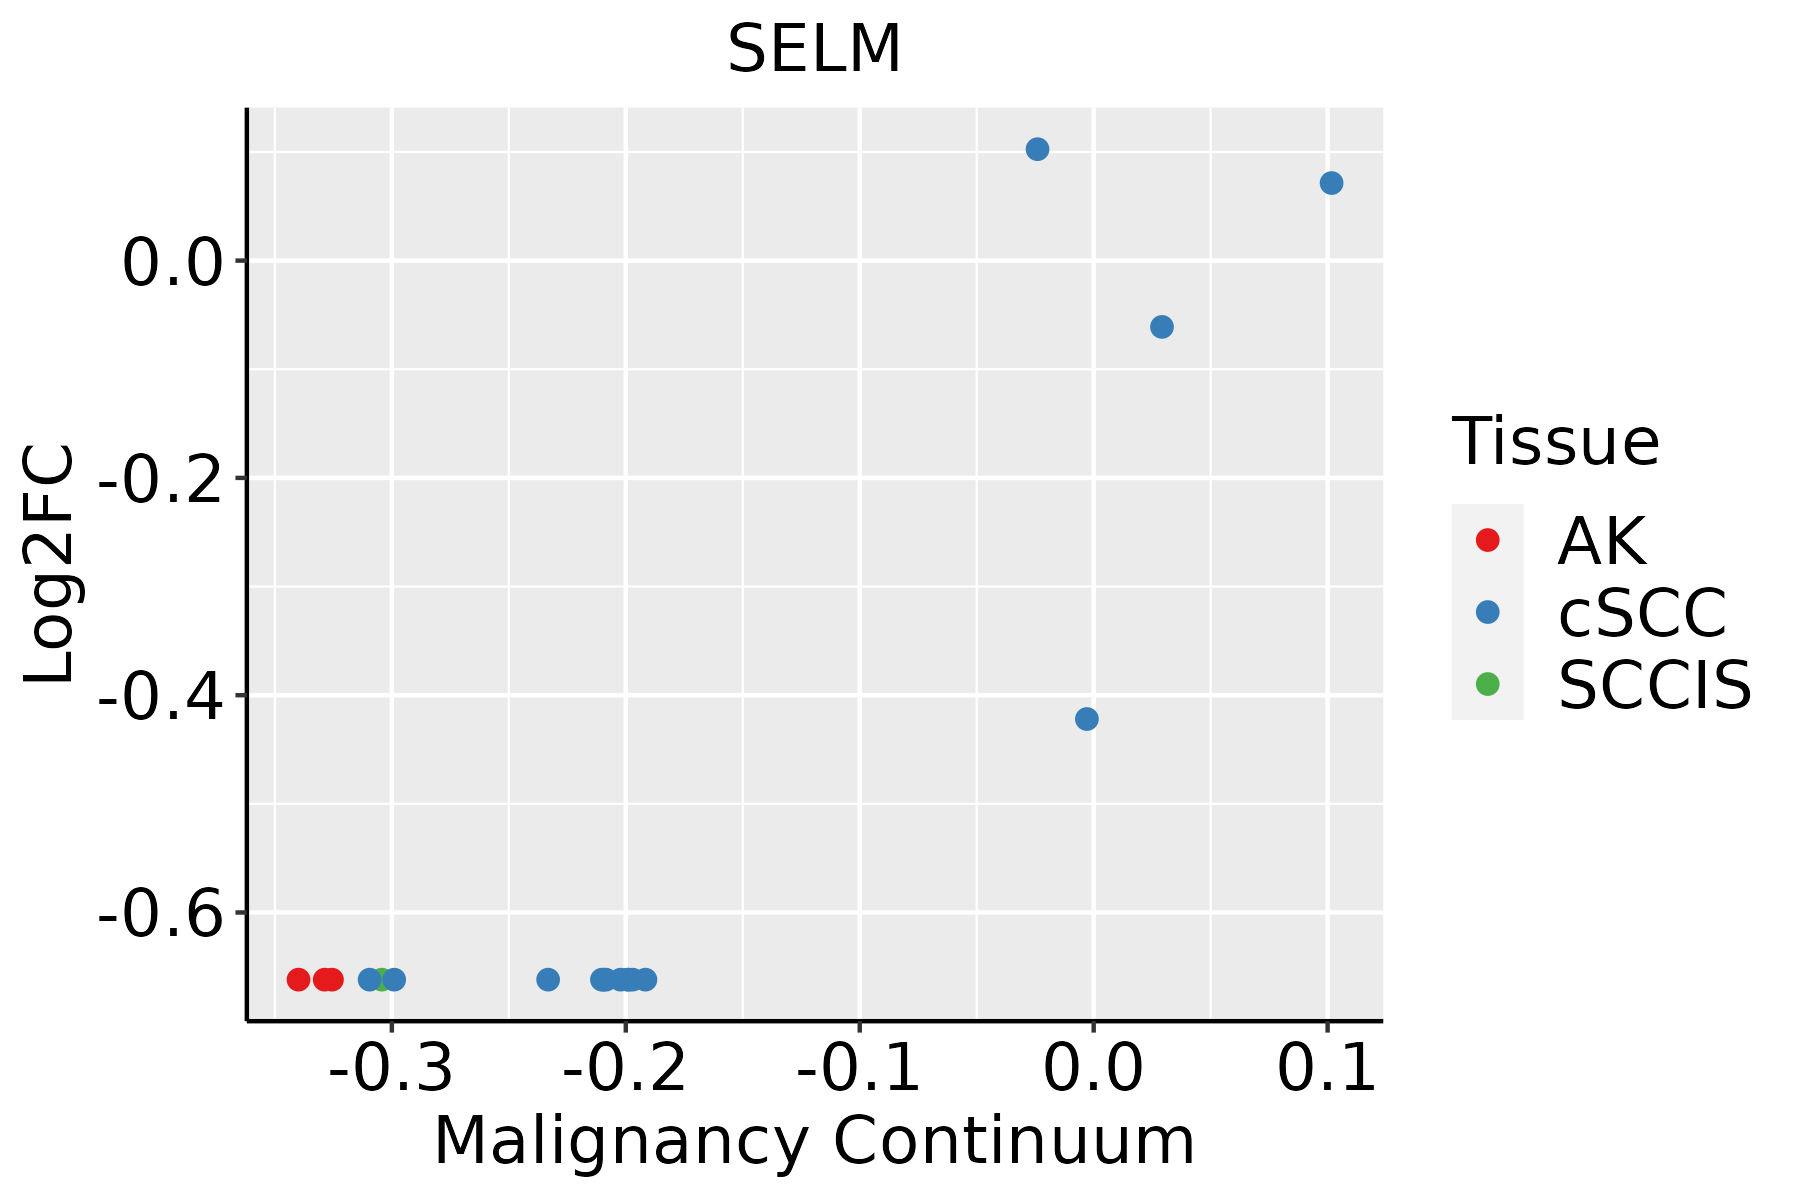 | AK: Actinic keratosis |
| cSCC: Cutaneous squamous cell carcinoma | ||
| SCCIS:squamous cell carcinoma in situ | ||
| Thyroid | 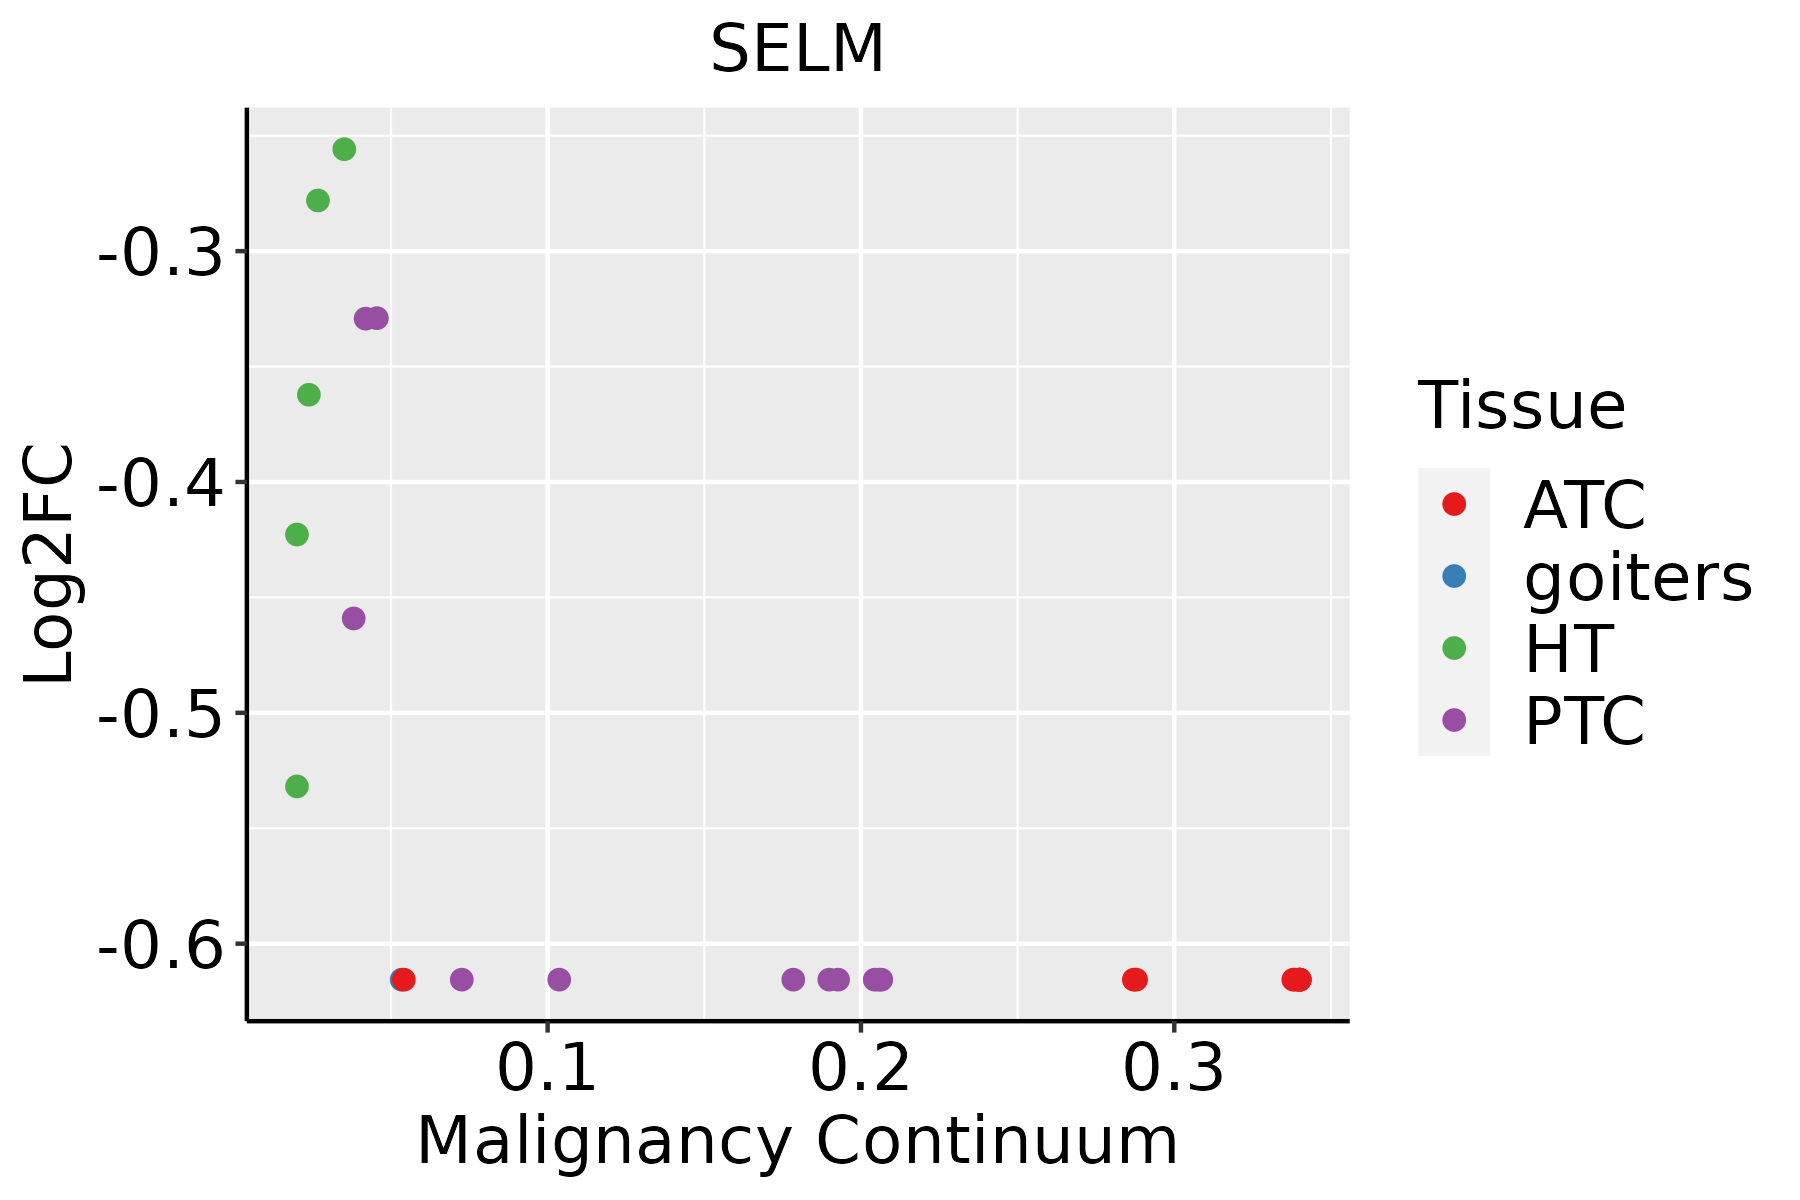 | ATC: Anaplastic thyroid cancer |
| HT: Hashimoto's thyroiditis | ||
| PTC: Papillary thyroid cancer |
| ∗log2FC in expression of this searched gene in stem-like cells from each diseased tissue sample relative to stem-like cells in normal samples in each tissue plotted against the malignancy continuum. Samples are colored based on if they are from different disease stage. |
Top |
Malignant transformation related pathway analysis |
| Find out the enriched GO biological processes and KEGG pathways involved in transition from healthy to precancer to cancer |
| Tissue | Disease Stage | Enriched GO biological Processes |
| Thyroid | PTC |  |
| Thyroid | goiters |  |
| Thyroid | ATC |  |
| ∗Top 15 enriched GO BP terms are showed in the bar plot of each disease state in each tissue. Each row represents a significant GO biological process which is colored according to the -log10(p.adjust). |
| Page: 1 2 3 4 5 6 7 8 9 |
| GO ID | Tissue | Disease Stage | Description | Gene Ratio | Bg Ratio | pvalue | p.adjust | Count |
| Page: 1 |
| Pathway ID | Tissue | Disease Stage | Description | Gene Ratio | Bg Ratio | pvalue | p.adjust | qvalue | Count |
| Page: 1 |
Top |
Cell-cell communication analysis |
| Identification of potential cell-cell interactions between two cell types and their ligand-receptor pairs for different disease states |
| Ligand | Receptor | LRpair | Pathway | Tissue | Disease Stage |
| Page: 1 |
Top |
Single-cell gene regulatory network inference analysis |
| Find out the significant the regulons (TFs) and the target genes of each regulon across cell types for different disease states |
| TF | Cell Type | Tissue | Disease Stage | Target Gene | RSS | Regulon Activity |
| ∗The dot plots of a searched regulon are shown for all cell subpopulations in each disease state of each tissue based on the regulon specific score inferred using pySCENIC and by calculating the average expression. |
| Page: 1 |
Top |
Somatic mutation of malignant transformation related genes |
| Annotation of somatic variants for genes involved in malignant transformation |
| Hugo Symbol | Variant Class | Variant Classification | dbSNP RS | HGVSc | HGVSp | HGVSp Short | SWISSPROT | BIOTYPE | SIFT | PolyPhen | Tumor Sample Barcode | Tissue | Histology | Sex | Age | Stage | Therapy Types | Drugs | Outcome |
| Page: 1 |
Top |
Related drugs of malignant transformation related genes |
| Identification of chemicals and drugs interact with genes involved in malignant transfromation |
| (DGIdb 4.0) |
| Entrez ID | Symbol | Category | Interaction Types | Drug Claim Name | Drug Name | PMIDs |
| Page: 1 |

Copyright 2023-Present -The University of Texas Health Science Center at Houston |